Gold I already posted in the base to blast the gold now it's going very nice with 1:11 ratio.i will blast again also.plan execute Sl or target no partial booking no cost to cost .follow the system
Trade ideas

Smart Money Liquidity Trap Explained⭐ Smart Money Liquidity Trap Explained
✨ A deep dive into how institutions manipulate price before major moves ✨
In every financial market — Forex, Crypto, Stocks, Indices — price doesn’t simply move at random. Behind the scenes, Smart Money (institutions, banks, hedge funds) engineer setups that allow them to enter positions at the best possible price. One of their most effective tools is the Liquidity Trap.
Let’s break it down beautifully and clearly. 👇
🔥 What Is a Liquidity Trap?
A Liquidity Trap occurs when Smart Money deliberately pushes price into areas loaded with:
❌ Stop-loss orders
📉 Sell-side liquidity
📈 Buy-side liquidity
😰 Emotional retail entries
🔥 Breakout traders placing pending orders
These areas become liquidity pools — perfect fuel for institutions to fill their massive positions.
Retail traders think it’s a breakout…
But Smart Money thinks:
➡️ "Thank you for the liquidity."
🧩 How Smart Money Creates the Trap
1️⃣ Phase 1: Build the Setup
Smart Money guides price slowly toward an obvious level:
A clean high
A clean low
A trendline
A double top/bottom
Retail traders get excited:
📢 “Breakout coming!”
But institutions are simply gathering attention.
2️⃣ Phase 2: The Liquidity Grab ⚡
Price spikes violently above/below the obvious level.
This move triggers:
🟥 Stop-loss hunts
📉 Forced liquidations
💥 Breakouts that fail instantly
This sudden spike gives institutions the liquidity needed to place large buy or sell orders without causing massive slippage.
This is why the spike is often fast and dramatic.
3️⃣ Phase 3: The Real Move Begins 🚀
After the liquidity is collected, price reverses sharply.
This is the moment Smart Money actually commits to the real direction.
Retail traders feel:
🤯 “Why did it reverse?!”
😭 “I got stopped out for nothing!”
😵 “The breakout was fake!”
But Smart Money simply executed their strategy perfectly.
🎯 How to Use Liquidity Traps in Your Trading
Study where retail traders commonly place:
⛔ Stops
📌 Breakout orders
❗ Predictable entries
Then wait for the fast liquidity grab followed by:
A displacement 🎇
A sharp wick rejection
A structure shift (CHoCH / BOS)
These signals often reveal the true direction of the upcoming move.
💡 Key Features of a Smart Money Liquidity Trap
✨ Sudden spike into obvious areas
✨ Fast liquidation and stop-hunting behavior
✨ Sharp wick rejections
✨ Structure shift after the spike
✨ Smooth continuation in the real direction
🚀 Why This Concept Is So Powerful
Recognizing liquidity traps allows you to:
❌ Avoid fake breakouts
🛡️ Protect yourself from stop-hunts
🎯 Enter the market at premium/discount levels
🤝 Align with Smart Money
💼 Improve long-term consistency
This is how professional traders stay on the right side of volatility — by understanding why the market moves, not just where it moves.

Instant BEARish Trade Any RISE above 4068 is SELL till 4072
SL at 4077.30
TP 1: 4061
TP 2: 4058
TP 3: 4053

Gold H1 – Is This Just a Range or a Break Incoming?🟡 XAUUSD – Intraday Smart Money Plan | by Ryan_TitanTrader (21/11)
📈 Market Context
Gold continues to trade inside a compressed intraday range as markets react to the latest discussion on whether the Federal Reserve is likely to cut interest rates anytime soon.
According to new reports, policymakers remain cautious, and early rate-cut expectations are fading as inflation progress slows.
This shift pushes USD stronger, increases Treasury yields, and temporarily weakens gold’s bullish momentum.
Key takeaways from the news:
• Fed officials note that inflation is “still not where it needs to be,” reducing the probability of early rate cuts.
• Markets have scaled back expectations for a Q1 cut, keeping USD supported.
• Higher yields → tighter financial conditions → gold struggles to break premium levels.
• Institutions are likely engineering liquidity grabs on both sides before committing to a new directional move.
Price is currently sitting near the 4030–4045 zone, right above discount liquidity, waiting for a catalyst to break out of the short-term compression.
🔎 Technical Analysis (1H / SMC Structure)
• Market Structure:
Gold has completed a clear CHoCH + short-term bearish sequence and is now compressing into the discount zone around 4030.
• Premium Sell Zone (4H Supply):
4128–4130 aligns with unmitigated supply + buy-side liquidity resting above internal highs.
• Discount Buy Zone:
4030–4028 sits inside the last clean demand zone where a previous sweep occurred.
• Liquidity Map:
→ Buy-side liquidity: above 4128–4135
→ Sell-side liquidity: below 4028–4020
Institutions are likely to sweep one side before delivering direction.
🔴 Sell Setup (Premium Reaction Zone)
• Entry: 4128 – 4130
• Stop-Loss: 4140
• Take-Profit:
→ 4080 (minor imbalance fill)
→ 4045 (range EQ)
→ 4030–4028 (discount demand retest)
📌 Execution rule: Wait for liquidity sweep into the zone + bearish CHoCH on M5–M15 before entering.
🟢 Buy Setup (Discount Reaction Zone)
• Entry: 4030 – 4028
• Stop-Loss: 4020
• Take-Profit:
→ 4060 (short-term reaction level)
→ 4095 (inefficiency fill)
→ 4120 (premium retest)
📌 Valid only if price sweeps the 4030–4028 pocket and shows bullish displacement from discount.
⚠️ Risk Management Notes
• USD strength may spike unexpectedly as rate-cut bets fade — reduce position size during volatility.
• Avoid trading inside the 4045–4085 chop zone unless a clean structure break forms.
• Manage trades aggressively once liquidity levels are taken.
• Expect engineered manipulation during low-volume Asian hours.
📝 Summary
Gold is compressing inside a narrow intraday range as markets reassess the likelihood of Fed rate cuts.
SMC structure suggests a two-sided liquidity sweep before a decisive move:
• Sell Zone: 4128–4130 (premium supply)
• Buy Zone: 4030–4028 (discount demand)
Expect classic accumulation → sweep → displacement patterns until macro conditions create a new trend.
📍 Follow @Ryan_TitanTrader for more Smart Money updates.

XAUUSD – Where Smart Money Strikes Today🌐 MARKET CONTEXT
Gold enters today’s session after a period of controlled volatility, with price repeatedly reacting around key liquidity pockets but failing to produce a clean breakout. The M30 structure remains bearish, with price rejecting premium levels and forming consistent lower highs.
Recent Drivers
USD stays firm as markets maintain expectations of a slightly hawkish Federal Reserve
Traders await upcoming mid-week data → low conviction, cautious positioning
Overall sentiment remains neutral — no strong safe-haven pressures
Session Outlook
London Session: Likely to engineer early sweeps into premium supply zones
New York Session: Higher chance of real directional expansion
Bias: Bearish intraday until discount zones trigger a CHoCH (shift of character)
Price is currently inside mid-range, so the safest setups remain at extremes where liquidity is concentrated.
📉 TECHNICAL ANALYSIS (SMC + LIQUIDITY)
Market Structure
M30 Trend: Lower High → Lower Low sequence
Equilibrium zone: 4068–4085
Inducement layers resting above 4147 and 4081
Liquidity Levels
BSL: Above 4147 & 4081
SSL: Below 4033 & deep liquidity at 3993
Market continues printing engineered wicks, trapping impulsive traders
Imbalances
Bearish FVG: 4147–4148 → perfect for premium scalp sells
Minor imbalance: 4081
Discount inefficiencies near 4033 and 3993 → ideal buy setups
🔑 KEY PRICE ZONES (Strong Logic + Clear Explanation)
4148–4147 ▶️ Premium Liquidity Trap – High-Quality Sell Zone
This area holds an unmitigated bearish order block combined with buy-side liquidity.
Smart Money typically uses this zone to trap breakout buyers before reversing sharply.
4079–4081 ▶️ Secondary Premium Sweep Zone – Fast Rejection Expected
A mini liquidity pool just above equilibrium, designed for early-session stop hunts.
Often triggers sharp intraday reversals.
4035–4033 ▶️ Discount Reaction Zone – Clean Scalping Demand
This zone holds micro-demand + SSL resting below.
Expect low-drawdown reactions ideal for quick intraday buys.
3995–3993 ▶️ Deep Discount Liquidity Pool – High-Probability Reversal Base
A rich accumulation of Sell-Side Liquidity combined with HTF discount structure.
Strong reversal potential if price reaches this level.
⚙️ TRADE SETUPS (High-Precision SMC Execution)
✔️ SELL SETUP 1 – Premium Rejection Sell
Entry: 4148–4147
Stoploss: 4126
TP1: 4135
TP2: 4120
TP3: 4085
Logic: BSL sweep + bearish imbalance fill → sharp sell-off expected.
✔️ SELL SETUP 2 – Mid-Range Liquidity Sweep
Entry: 4079–4081
Stoploss: 4087
TP1: 4065
TP2: 4048
TP3: 4033
Logic: Quick liquidity hunt above equilibrium followed by displacement.
✔️ BUY SETUP 1 – Intraday Scalping Rebound
Entry: 4035–4033
Stoploss: 4027
TP1: 4048
TP2: 4070
Logic: SSL sweep → micro CHoCH → ideal for fast bullish reaction.
✔️ BUY SETUP 2 – Deep Discount Reversal
Entry: 3995–3993
Stoploss: 3987
TP1: 4010
TP2: 4040
TP3: 4070
Logic: Major discount zone + liquidity buildup → strong reversal potential.
🧠 NOTES / SESSION PLAN
Avoid mid-range trading — only trade at liquidity extremities
Expect London fake-outs; real movement likely in NY
Always wait for M5/M15 confirmation (CHoCH + BOS)
Avoid buying in premium areas; avoid selling in deep discount zones
Follow strict risk management — volatility may spike unexpectedly
🏁 CONCLUSION
Gold continues to hold a bearish intraday structure, favouring premium sell setups at 4147 and 4081.
Discount zones at 4033 and 3993 offer high-probability buy reactions and possible deeper reversals.
Trade with patience. Execute only at liquidity extremes.
Let Smart Money show its trap — then strike with precision.

XAU/USD: Gold Set to Test Downtrend Line!⏰ Timeframe: 30m
📅 Update: 11/21/2025
🔍 Market Context
After adjusting from the 4,107 USD area, gold is moving sideways in the liquidity rebalancing zone – indicating a tug-of-war between the two sides.
The consecutive CHoCH – BOS movements forming around the 4,006 USD bottom show that buying pressure is starting to reappear.
The current decline seems to be just a correction phase, not yet showing enough signs of a complete reversal of the medium-term uptrend structure.
📊 Technical Structure
Downtrend line: continues to act as dynamic resistance – a confirmation area for the recovery trend if broken.
OB Bullish (4,006 USD): confluence with the previous liquidity bottom, is a potential BUY Zone.
Break–Resistance (4,045 USD): the first level to surpass to confirm buying pressure.
OB Bearish (4,086–4,107 USD): short-term supply zone – short-term SELL Zone, may witness profit-taking reactions if the price touches it.
🎯 Market Outlook
1️⃣ Priority Scenario:
– Price may retest the OB Bullish / BUY Zone (4,006–4,025 USD).
– When a clear upward reaction appears, gold is likely to break through the downtrend line, heading towards OB Bearish (4,086–4,107 USD).
2️⃣ Alternative Scenario:
– If the price does not hold the 4,006 USD area, the short-term structure will be invalidated, opening the possibility of retreating to a lower equilibrium area around 3,985 USD.
💎 Key Zones
BUY Zone: 4,006 – 4,025 USD → demand zone confluence OB + liquidity bottom.
SELL Zone: 4,086 – 4,107 USD → potential supply zone if the recovery trend is activated.
🧠 Analyst’s View
Gold is in a short-term accumulation state with signs of capital flow gradually leaning towards the buyers.
The retest phase of the 4,006 USD support area will be the key confirmation for a reversal – retest – continuation phase.
As long as the price stays above this area, the priority remains a buy-the-dip scenario in the short term.
🛡️ Risk Note
The market is operating in a "break or hold" zone – clear confirmation is needed before following the trend.
Analysis is for technical and educational purposes, not trading advice.

OVERVIEW GOLD CHART H1 11/21 🧭 1. CURRENT MARKET CONTEXT
Gold remains in a downtrend on the H1 timeframe, despite a minor rebound after the NFP release.
A sharp drop to 4,039 created a new low, followed by a weak recovery and sideways movement during the Asian session.
When the London session opened, price broke below the consolidation zone, confirming that sellers are still in control of the market.
Key highlights:
• The market remains bearish as long as price stays below 4,052–4,060
• Volume Profile shows VAL at 4,052 turning into a new resistance
• Intraday structure continues to form lower highs → maintaining the main downtrend
⸻
🔍 2. TECHNICAL ANALYSIS – H1
🔹 Trend overview
• H1: Clear bearish pattern with consecutive LL – LH.
Breakout from the Asian session sideways confirms the continuation of the downtrend.
🔹 Price action
• Asian session: Price consolidates after the sharp drop
• European session: Break below the sideways range → sellers continue to push
• All upward moves are just retracements – not a reversal
⸻
📌 3. IMPORTANT PRICE ZONES
🔥 Resistance zones (SELL priority)
• 4,040 – 4,052 → Strong intraday resistance
– Confluence of VAL, supply zone, and downtrend line
• 4,060 – 4,070 → For deeper pullbacks
🟩 Support zones (downside targets)
• 3,995 – 4,005 → Stronger support – extended target if selling momentum increases
⸻
🎯 4. TRADING SCENARIOS
🔻 Scenario 1 – Most important (priority)
SELL on pullback
If price retraces to 4,040 – 4,052 and shows rejection signals (M5/M15):
Sell zone: 4,040 – 4,052
TP: 4,025 → 4,010 → 3,995
SL: Above 4,060
🔻 Scenario 2 – Continuation after breaking the low
If price breaks 4,028 with a strong H1 candle close:
Sell continuation
TP: 4,010 → 3,995
SL: 4,045
🔻Scenario 3 – Only trigger on reversal structure
If price breaks & closes above 4,060, the structure weakens:
➡️Quick Buy: up to 4,075 → 4,092
(Only trade with strong signals – this is a counter-trend setup)
⸻
🥇 5. CONCLUSION
• Main trend: Down – SELL is preferred
• Best entry zone: 4,040 – 4,052 (strong confluence)
• Only Buy on a clear break above 4,060

Gold Drops to 4050 – Testing a Key Support Zone📊 Market Overview:
Gold continues to fall toward the 4050 region as the US Dollar strengthens and US bond yields edge higher, reducing safe-haven demand. The market is now awaiting clearer signals from the Fed minutes and upcoming US economic data, causing bullish momentum to weaken.
________________________________________
📉 Technical Analysis:
Key Resistance: 4072 – 4085
Stronger Resistance: 4095 – 4105
Nearest Support: 4055
Stronger Support: 4045 – 4040
EMA09: Price is trading below the EMA09 on the H1 chart → short-term bearish signal.
Candlestick / Momentum:
H1 candles continue forming lower highs, showing sellers are in control. Volume is gradually decreasing, indicating the market is waiting for a reaction at the 4050 support zone.
________________________________________
📌 Outlook:
• Gold may continue to decline in the short term if price breaks below 4045.
• Conversely, if gold bounces strongly from 4050 with a clear reversal candle, price could retrace toward 4072–4085, and may extend to 4095 if buying pressure strengthens.
________________________________________
💡 Suggested Trading Strategy:
🔻 SELL XAU/USD at: 4082 – 4085
🎯 TP: 40 / 80 / 200 pips
❌ SL: 4088
🔺 BUY XAU/USD at: 4040 – 4037
🎯 TP: 40 / 80 / 200 pips
❌ SL: 4035


Elliott Wave Analysis XAUUSD – November 20, 20251. Momentum
D1:
The D1 momentum is turning upward, suggesting the market may see a mild bullish retracement or continue moving sideways within a narrow range.
H4:
H4 momentum is also preparing to turn upward. This indicates that today we may see a slight bullish push on the H4 chart, or price may continue to move sideways.
H1:
H1 momentum is preparing to turn upward, meaning we may see a small corrective bounce or continued sideways movement.
________________________________________
2. Wave Structure
D1:
Price is currently moving sideways with small candle bodies. Combined with rising momentum, this suggests the market may continue forming a short-range corrective bounce.
H4:
Our main expectation remains a 5-wave structure for wave Y (purple).
Currently, price may be:
• Entering the early phase of wave 3, or
• Still completing wave 2.
👉 A clear confirmation for wave 3 will only come when price breaks below 4001. At that point, we expect price action to turn fast and steep—characteristics of a true wave 3 decline.
H1:
I have temporarily labeled the current structure as a bearish wave sequence since our primary bias is a developing red wave 3.
In this scenario, price may already be in the early part of wave 3.
❗️If price breaks above the green wave 2 high at 4097, this wave count becomes invalid. It would mean the market is still in red wave 2, and I will update the plan if that happens.
________________________________________
3. Trade Plan
Sell Zone: 4093 – 4096
SL: 4016
TP1: 4000
TP2: 3885
TP3: 3746

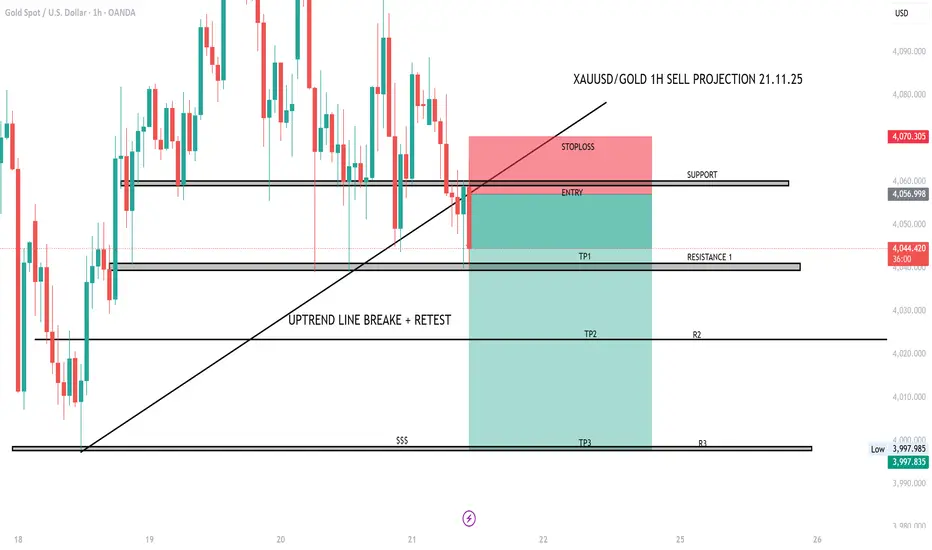
XAUUSD/GOLD 1H SELL PROJECTION 21.11.25XAUUSD / GOLD 1H SELL projection based on the chart you uploaded:
✅ Overall View
The chart shows a confirmed uptrend line break + clean retest, which is a strong bearish signal on 1H timeframe. Your setup is technically correct and follows proper structure.
📉 SELL SETUP ANALYSIS
1. Entry Zone
Your entry is placed exactly at the support → turned resistance zone after the trendline break + retest.
This is a smart location because:
Price rejected the retest
Previous support is now acting as resistance
Weak bullish candles on retest confirm sellers are active
🛑 Stop Loss
Stop loss is placed above the retest wick, which is correct.
Because:
If price moves above this, structure becomes bullish again
SL protects you from fake breakout
🎯 Targets
TP1 – Resistance 1 (Now Support Zone)
Good first target. High probability area where price may react.
TP2 – R2
This level has strong confluence:
Previous consolidation zone
Fresh liquidity area
High chance price may reach here if bearish momentum continues.
TP3 – R3 (Final Target)
This is your deep liquidity zone ($$$).
Smart money usually reaches this zone after trend reversal.
⭐ Trade Quality Rating: 9/10
Reasons:
Trendline break + retest = strong confirmation
Clean structure
Proper RR setup
Logical TP placements
SL placed safely
📌 Suggested Trade Plan
Enter only if candle closes below your entry zone again
Book partial profits at TP1
At TP1: move SL to breakeven
Let runner hit TP2 / TP3
XAUUSD–FRIDAY BEFORE PMI: MAINTAINING HEAD AND SHOULDERS PATTERN💛 XAUUSD – FRIDAY BEFORE PMI: MAINTAINING HEAD AND SHOULDERS PATTERN, WAITING TO BREAK RANGE 4132–3998 🎯
🌤 1. Overview
Hello everyone, it's Lana here again 💬
Today is the last Friday of the week, the market is waiting for PMI and preparing to enter a phase with a lot of important data in December.
Meanwhile, BTC has been rising faster than XAU in recent weeks, indicating that speculative money is leaning towards crypto, while gold is temporarily moving sideways accumulating.
The US Department of Labor will release the November employment report on December 16, which is 6 days after the December Fed meeting. In other words, the Fed is in a "blackout" state regarding labor data for nearly another month – this forces the market to price in advance, making gold's volatility range wide but lacking a clear trend.
💹 2. Technical Analysis – Range & Head and Shoulders Pattern
On the H3/H4 frame, gold is fluctuating within the large range of 4132 – 3998.
The price wave is gradually narrowing towards the end of the triangle, represented by:
Lower highs,
Higher lows,
→ When one of the two boundaries is broken, a new trend is likely to explode in the direction of the breakout.
The inverse Head – Shoulders – Head pattern has not been broken:
Left shoulder – Head – Right shoulder are all above the rising trendline.
For the final wave of the pattern to follow the rhythm, the price needs to confirm surpassing 4109:
When closing a candle above 4109, the short-term uptrend is confirmed,
At that point, gold can aim for higher liquidity areas such as 4132 → 4145 → 4200.
Conversely, if gold breaks 3998, this will be both:
breaking the range bottom,
and negating the Head and Shoulders pattern,
→ opening the possibility of a deeper decline to the 3960–3920 area.
🎯 3. Reference Trading Scenarios
💖 BUY Scenario – following the pattern & range bottom support
1️⃣ Buy at support 3998–4000
Entry: 3998–4000
SL: below 3990 (depending on risk management)
TP: 4025 → 4040 → 4078
2️⃣ Buy when confirmed above 4109
Condition: Price closes a candle above 4109, confirming the Head and Shoulders pattern is maintained.
Entry: around 4100–4105
SL: 4090
TP: 4132 → 4145 → 4200
💢 SELL Scenario – trading the upper boundary of the range
Sell: 4130–4132
SL: 4138
TP: 4110 → 4095 → 4070 → 4045
Selling should only be considered as scalping against resistance within the range, not the main trend if the Head and Shoulders pattern is still valid.
⚠️ 4. Notes & Risk Management
Range 4132–3998 is still controlling the market:
Above 4109 → prioritize Buy according to the short-term uptrend.
Below 3998 → consider shifting bias to Sell following the breakout.
PMI, Fed expectations, and upcoming employment data may trigger unexpected volatility, therefore:
🌷Gold is at the intersection of technical patterns and macro stories 💛
Be patient and wait for reactions at 3998 and 4109, as these are the two key points that determine whether we enter a new upward wave or a deeper decline.
💛 Like – 💬 Comment – 🔔 Follow LanaM2 to follow gold with me every day ✨

XAU/USD: Gold Adjusts, Awaiting Fibo 4,092 Confirmation📊 Market Structure
Gold is moving in the ABC–D–E adjustment pattern after a strong decline from the peak. Current structure:
Wave (C) peaks at the 4,128 – 4,130 USD region and strong selling pressure appears.
The price then creates a temporary bottom (D) but does not touch the Demand Zone at 4,007 USD, indicating the BUY side still has strength.
Currently, the price is in a small upward adjustment phase to form wave (E).
Key points:
The major trend still leans towards an increase as long as the bottom at 4,007 USD is not broken.
The BUY side is looking for a complete structure to continue pushing up to the FVG region.
💎 Key Technical Zones
1. Fibo Retracement Zone — 4,092 USD
Confluence region of:
Fibo 0.5 – 0.618
Adjustment structure (small wave)
→ Suitable for light SELL scalp, according to candle reaction signals.
2. FVG Zone — 4,128 – 4,151 USD
This is a large FVG region, coinciding with the market's "loss cost."
If the price pushes up as expected in wave (E), this is the main SELL region of the day.
3. Supply Zone — 4,207 – 4,210 USD
Extremely strong region, if the price breaks the FVG, it will move to this region.
This is the extended target for the BUY side if the market rises strongly.
4. Demand Zone — 4,007 – 4,020 USD
The strongest liquidity bottom region of the session.
If the price breaks 4,092 and does not maintain structure, gold will retest this region before a major increase.
🎯 Trading Plan – According to the current chart
1️⃣ SELL Scalp – Main scenario
Wait for the price to retrace to the Fibo 4,092 USD region and observe the reaction:
Entry: 4,092
SL: 4,105
TP1: 4,075
TP2: 4,060
TP3: 4,030 (lower FVG)
→ This is a short-term scalp order, suitable for the current weak market.
2️⃣ SELL Setup – FVG Zone
If the price breaks 4,092 and runs up to FVG:
Entry: 4,126 – 4,151
SL: 4,160
TP1: 4,092
TP2: 4,060
TP3: 4,030
→ This is the best SELL region of the day.
3️⃣ BUY Setup – Demand Zone
Only activate if the market drops deeply:
Entry: 4,020 – 4,007
SL: 3,995
TP1: 4,060
TP2: 4,092
TP3: 4,128 – 4,151
→ Buy according to the major trend when the price reaches the liquidity bottom region.
🧠 Vincent’s View
The current market is in a controlled adjustment phase.
Priority:
✔ SELL scalp at 4,092
✔ Beautiful SELL at 4,126–4,151
✔ BUY only activates when reaching 4,020–4,007
The major trend is still waiting to complete the wave pattern to push up to the Supply Zone 4,207 USD.

XAUUSD 15M | MSS Break + FVG + OB + Fibonacci Retracement (FRL)
XAUUSD – 15M ICT/SMC Analysis
Price grabbed internal liquidity ($) and created a clean MSS (Market Structure Shift).
After the shift, price retraced into the discount zone, aligning perfectly with key SMC levels:
🔹 FVG – Fair Value Gap
Price filled imbalance and respected the gap.
🔹 OB – Bullish Order Block
Strong reaction from the order block confirms smart money involvement.
🔹 FRL – Fibonacci Retracement Level
FRL represents the 38.2%–50% Fibonacci retracement, the ideal ICT pullback zone after MSS.
This is where high-probability buy setups form.

XAUUSD – Battle Zones of the Day🌐 MARKET CONTEXT
Gold enters today’s session after a period of compressed volatility, where price tapped both buy-side and sell-side liquidity several times without forming a decisive trend. On the M30 chart, the intraday structure remains bearish, with price consistently rejecting premium levels and forming lower highs.
Recent Catalysts:
USD holds mild strength following a slightly hawkish tone from the Federal Reserve
Market is awaiting mid-week economic releases → leading to a cautious sentiment
Risk appetite remains neutral with no strong safe-haven flows
Session Expectations:
London Session: Likely to generate early liquidity sweeps towards premium zones
New York Session: Higher probability of seeing genuine directional expansion
Bias: Bearish intraday unless price reaches discount zones and forms a CHoCH
Price is currently trading within mid-range levels, making the extreme liquidity zones the safest points for execution.
📉 TECHNICAL ANALYSIS (SMC + LIQUIDITY STRUCTURE)
Market Structure
M30 structure: Lower Highs → Lower Lows
Equilibrium zone: 4075–4085
Inducement layers accumulating above 4147 and 4070
Liquidity
BSL: Above 4147 & 4070
SSL: Below 4033 and the deeper pocket at 3993
Market forming engineered liquidity wicks on both sides
Imbalance Zones
Bearish FVG: 4147–4148 → strong scalp sell zone
Minor imbalance: 4070–4071
Discount imbalances: 4033 and 3993 support buy setups
🔑 KEY PRICE ZONES (Clear & Attractive Explanations)
4148–4147 → Premium Liquidity Trap – Ideal Scalp Sell
A premium zone combining an unmitigated bearish order block and BSL inducement.
This area often triggers breakout buyers before institutions reverse the move.
4071–4070 → Secondary Premium Liquidity – Fast Rejection Zone
A small liquidity pool above equilibrium designed to sweep early highs before price turns bearish again.
4035–4033 → Discount Reaction Zone – Scalping Demand
A micro order block aligned with a cluster of sell-side liquidity.
Provides clean, low-drawdown intraday rebounds.
3995–3993 → Deep Discount Liquidity Pool – High-Value Reversal Zone
A major liquidity pocket aligned with higher-timeframe discounts.
If price reaches here, a strong reversal is highly probable.
⚙️ TRADE SETUPS (SMC-Driven, High Precision)
✔️ SELL SETUP 1 – Premium Scalp
Entry: 4148–4147
Stop-loss: 4126
Targets: 4135 → 4120 → 4085
Logic: BSL sweep + FVG fill leading to strong bearish rejection.
✔️ SELL SETUP 2 – Mid-Range Liquidity Sweep
Entry: 4071–4070
Stop-loss: 4077
Targets: 4058 → 4043 → 4033
Logic: Sweep of mini BSL followed by downward displacement.
✔️ BUY SETUP 1 – Intraday Rebound
Entry: 4035–4033
Stop-loss: 4027
Targets: 4048 → 4070
Logic: SSL sweep with potential for a micro CHoCH → clean bounce setup.
✔️ BUY SETUP 2 – Deep Discount Reversal
Entry: 3995–3993
Stop-loss: 3987
Targets: 4010 → 4040 → 4070
Logic: Strong higher-timeframe discount zone → excellent reversal potential.
🧠 NOTES / SESSION PLAN
Avoid trading in mid-range areas — only execute at the extreme liquidity zones
Expect fake movements during London open
New York session likely provides the main trend direction
Wait for M5/M15 confirmation signals (CHoCH + BOS)
Avoid buying around premium levels to stay clear of liquidity traps
🏁 CONCLUSION
XAUUSD continues to hold a bearish intraday structure, favouring premium-zone sell opportunities at 4147 and 4070.
Discount-zone levels at 4033 and 3993 remain high-probability areas for intraday bounces or deeper reversals.
Trade only at liquidity extremes.
Be patient.
Let the market form the trap — and then strike with precision.

XAUUSD – Bearish Retracement Into Supply Zones With Potential Sh1. Overall Context
The market recently had a strong bearish leg after rejecting the upper resistance zone (labelled HIGH PROB POI).
Price is currently retracing upward into a series of supply zones, indicating a potential area for continuation shorts.
2. Key Zones
High Probability POI (Supply)
This is the upper beige zone.
Previously caused a strong sell-off → confirms strong institutional presence.
If price pushes this high again, it may offer the most reliable reversal area.
Extreme POI
The central horizontal zone marked “EXTREME POI”.
Current price is tapping into it.
Market may react here if sellers decide to re-enter early.
3. Internal Structure
A series of labeled SSS (Sell-Side Sweeps) indicate liquidity grabs beneath short-term lows.
After sweeping these lows, price retraced upwards, likely moving toward premium territory to fill sell orders.
The 80% level marked on the chart seems to be your optimal entry zone within the inefficiency/imbalance.
4. Entry Idea
Your marked entry level 4080 sits inside the grey supply block.
This aligns with:
Prior breakdown zones
Fresh supply
Retracement to premium pricing
Liquidity sweep structure
This creates a high-probability short setup, assuming the trend continues downward.
5. Expectation
If price respects the first supply zone (grey box), downside continuation should follow.

XAU/USD: Gold in Downtrend, Waiting for Demand Surge⏰ Timeframe: 30m
📅 Update: 11/20/2025
🔍 Market Context
After the technical rebound at the beginning of the week, gold returns to adjust within the descending channel pattern, indicating that short-term upward momentum is temporarily weakening.
The current structure reflects a rebalancing state after the price was rejected at the 4,127 USD supply zone – coinciding with the 30-minute frame Supply Zone.
However, the Demand Zone below still plays an important role in maintaining the medium-term upward structure.
📊 Technical Structure
Supply Zone (4,127 USD): main resistance area, confluence with the nearest peak – where the price was strongly rejected during the Asian session.
OB Bearish (4,106 USD): short-term supply area, highly likely to be retested after completing the adjustment phase.
Demand Zone (4,013 USD): main support area in the descending channel, also the confluence point between the channel boundary and the lower liquidity zone.
Liquidity Sweep: signal indicating that lower liquidity has been absorbed, opening up the possibility of forming a higher low.
🎯 Market Outlook
High probability scenario:
1️⃣ Price continues to fluctuate within the descending channel, retesting the 4,013 USD Demand Zone.
2️⃣ If a clear price reaction occurs, the market is likely to break the channel, opening up a technical rebound to OB Bearish 4,106 USD or Supply Zone 4,127 USD.
3️⃣ Losing the 4,013 USD area will temporarily invalidate the rebound structure, bringing the price back to a lower balance area around 3,990 USD.
🧠 Analyst’s View
Gold is in a corrective pullback phase – where the market needs to regenerate liquidity before forming a new expansion wave.
A reasonable scenario is sweep – retest – expansion: sweep lower liquidity, retest the supply area, then determine the main trend for the end of the week.
Buyers still have a slight advantage as long as the Demand Zone is maintained.
🛡️ Risk Note
This is a phase of market liquidity accumulation, fluctuations may be erratic.

LiamTrading – XAUUSD H1 | A bearish structure has formed...LiamTrading – XAUUSD H1 | A bearish structure has formed, waiting for confirmation during the European session
Overall, gold is in a corrective downtrend after the previous bullish move. On the H1 timeframe, a clear Dow bearish structure (lower highs, lower lows) has formed. However, the support zone around 4,030 and the lower Fibonacci cluster are still potential areas where buying pressure may appear. Today’s European session will be crucial to confirm whether price continues to drop deeper or bounces back, aligning with the inverse head-and-shoulders pattern developing on H4.
Macro – Short Fundamental Outlook
The minutes from the Fed’s October meeting revealed a strong internal division:
One group opposed rate cuts and wanted to maintain current levels.
The other group supported cutting rates and even suggested further reductions in December.
This lack of consensus shows high uncertainty in monetary policy, encouraging defensive flows to continue favouring gold. In the long run, gold only surges when confidence in the financial system weakens — a gold price peak is not a sign of prosperity but a warning signal.
Technical Analysis – H1 (trendline, Fibonacci, liquidity)
Price is trading below the short-term descending trendline, confirming that the bearish phase remains active.
The 4,082–4,090 zone is an important liquidity zone — repeatedly tested and now acting as near-term resistance.
The 4,029–4,031 cluster is a key support area:
Overlaps with technical support + Fibonacci retracement.
Beginning of the large FVG that extends down to 3,985 (Fibo 1.618 + psychological support).
Above current price, the 4,129–4,130 zone is strong resistance. If price breaks and holds above this area, the bearish Dow structure will weaken significantly.
Suggested Trading Scenarios
BUY Scenario – Buying at Support / Fibonacci
Logic: Price holds above the support–Fibonacci zone, showing bottom-fishing demand.
Entry BUY: 4,029–4,031
SL: 4,022
TP: 4,040 → 4,065 → 4,090 → 4,120
Only consider buying if price shows strong reaction at 4,029–4,031 (long wick rejection or clear reversal candle on M15–H1).
Cancel this BUY plan if H1 closes below 4,022.
SELL Scenario – Following the current bearish structure (preferred if trendline remains intact)
Logic: Price retraces to resistance + descending trendline and gets rejected.
Entry SELL: 4,098–4,100
SL: 4,105
TP: 4,088 → 4,070 → 4,035 → 4,000–3,985
Only sell if price touches 4,098–4,100 with clear rejection (bearish pin bar/engulfing).
If H1 closes above 4,105 and breaks the trendline strongly, stop all sell setups and reassess.
Key Levels for Scalping
4,082 – 4,060 – 3,985 – 4,129
These levels can be used for quick intraday trades, but reduce position size and take profit fast.
Important Notes
If price closes firmly above the descending trendline and holds above 4,090–4,100, bias will gradually shift toward BUY setups, as an inverse head-and-shoulders pattern is forming on H4.
If the 4,029–4,022 support breaks decisively, gold is likely to drop toward the FVG and Fibonacci 1.618 zone around 3,985.
What scenario are you leaning toward for gold today — a pullback for another sell, or holding the bottom for a rebound? Leave your view in the comments and follow LiamTrading for daily XAUUSD updates on TradingView.

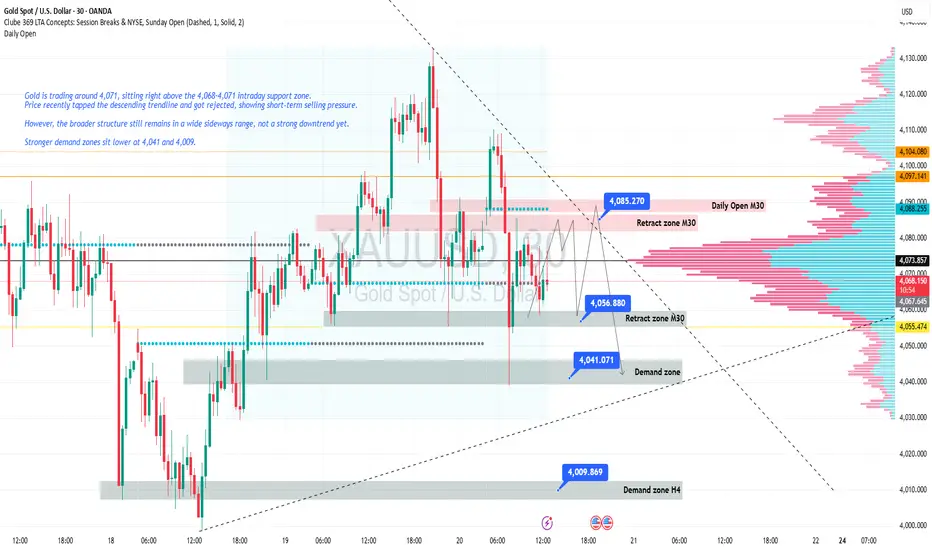
OVERVIEW MARKET CHART M30 11/201. Current Context
Gold is trading around 4,071, sitting right above the 4,068–4,071 intraday support zone.
Price recently tapped the descending trendline and got rejected, showing short-term selling pressure.
However, the broader structure still remains in a wide sideways range, not a strong downtrend yet.
Stronger demand zones sit lower at 4,041 and 4,009.
⸻
2. Price Action at 4,071
Currently gold is:
• Retesting 4,068–4,071 support
• Showing lower wicks → light buying pressure
• Still trading below M30/H1 downtrend line
This suggests the probability of sideways movement – accumulation – or a small bullish retest is high.
📌 If 4,068 breaks → price may head to 4,056 and then 4,041
📌 If 4,071 holds → price may bounce toward 4,077–4,080, possibly 4,085
⸻
3. Conclusion (Real-Time)
👉 No BUY yet – wait for confirmation at 4,071
👉 No SELL yet – only sell if price closes below 4,068
👉 Low volatility – prioritize safety
XAU/USD – Inverse H&S Forming, Gold Eyes Bullish Reversal🔍 Market Context
Early today, Gold dropped nearly 70 points, but immediately rebounded strongly from 4040, signaling aggressive BUY interest and a clear rejection of downside continuation.
On the H2 chart, XAU/USD is shaping a clean Inverse Head & Shoulders pattern — a classic reversal structure that often precedes a strong bullish expansion.
The macro layer for today is packed with high-impact catalysts:
📌 Key Data & Events – 20 Nov
Speech by U.S. President Donald Trump
Barkin (2027 FOMC voter) speaks on economic outlook
Federal Reserve FOMC Meeting Minutes
Williams (permanent FOMC voter) speech
U.S. Unemployment Rate
Non-Farm Payrolls (NFP)
Initial Jobless Claims
➡️ A heavy news lineup capable of triggering high volatility and validating (or rejecting) the reversal pattern.
📊 Technical Analysis – MMF View
Gold bounced sharply from BUY ZONE 4044–4046 with strong volume.
The market structure is creating a complete Inverse H&S formation.
The Neckline Zone 4101–4111 is the key breakout level — clearing this zone opens the door for a full bullish reversal.
Trendline compression + liquidity sweeps show buyers gaining control.
Strategy for today: BUY bias. SELL only for quick scalps.
🎯 MMF Daily Trading Plan
BUY (Priority Setup – Swing / Intraday)
Buy 4046–4048
SL: 4039
TP: 4060 → 4085 → 4100 → 4125
✔️ BUY aligns with the reversal pattern + fresh liquidity shift.
SELL (Scalping Only)
Sell 4146–4148
SL: 4154
TP: 4132 → 4120 → 4110
✔️ SELL only if price taps liquidity at upper supply and rejects clearly.
⚠️ Key Levels to Watch
4101 – 4111 – 4142 → liquidity clusters + breakout confirmation
4029 → major support in case volatility spikes from news
🧠 MMFLOW TRADING Outlook
If Gold holds its corrective pullback and breaks above the Neckline (4101–4111), we may see a strong continuation toward:
4146 → 4187 → 4210+
The Inverse H&S on H2 is a powerful bullish setup — smart positioning favors building long exposure and holding into high-impact events.

New Traders’ Mistakes That They Should Avoid1. Trading Without a Proper Plan
One of the biggest and most common mistakes is trading without a plan. Many beginners jump into the market based on tips, social media signals, or impulses. They take trades without having clear entry criteria, stop-loss levels, or profit targets. Trading without a strategy is like driving without direction—you may reach somewhere, but not where you intended.
A good trading plan should include:
Market selection (stocks, forex, commodities, crypto, etc.)
Timeframe you want to trade
Entry and exit conditions
Risk management rules
Position sizing
Maximum daily or weekly loss limit
A plan provides structure and minimizes emotional decisions.
2. Ignoring Risk Management
Risk management is the backbone of successful trading, yet beginners often overlook it. Many new traders risk too much on a single trade or avoid using stop-loss orders because they are “sure” the price will move in their favor.
Typical risk-management mistakes include:
Risking more than 2% of account capital per trade
Not placing a stop-loss
Moving the stop-loss further away to avoid exiting
Using high leverage without understanding it
Effective risk management ensures that a few losing trades don’t destroy your entire account. Professionals understand that preservation of capital is more important than chasing big profits.
3. Overtrading and Revenge Trading
New traders often feel pressured to be in the market constantly. Overtrading happens when traders take too many trades, even when there is no clear setup. This usually leads to emotional decisions and unnecessary losses.
Another related mistake is revenge trading, where traders try to quickly recover losses by placing impulsive trades. This behavior results in even bigger losses.
To avoid this, trade only when your setup appears. Quality beats quantity.
4. Letting Emotions Drive Decisions
Trading is a psychological game. Fear, greed, hope, and frustration are powerful emotions that influence new traders. Examples include:
Greed leading to holding positions too long
Fear preventing you from entering a good setup
Hope making you avoid closing a losing trade
Frustration causing revenge trades
Emotions cloud judgment and break discipline. Successful traders follow logic, not feelings. Practicing discipline and sticking to your plan is key to long-term success.
5. Using Too Much Leverage
Leverage amplifies gains—but also losses. New traders are often attracted to high leverage because it allows larger positions with small capital. However, even small market movements can wipe out the account.
For example, in forex or futures, 1:50 or 1:100 leverage can be extremely risky if not used properly.
To avoid this mistake:
Start with low leverage
Use proper position sizing
Understand margin requirements and liquidation risk
Smart traders treat leverage like a sharp tool—useful, but dangerous if mishandled.
6. Not Keeping a Trading Journal
Most beginners take trades and move on without analyzing what went right or wrong. Without a trading journal, you cannot identify patterns in your behavior or strategy.
A trading journal should record:
Date and time of entry
Chart screenshot
Entry/exit price
Stop-loss and target
Result of the trade
Emotions and reasoning behind the trade
This habit helps improve discipline and refine your system.
7. Following Tips, Noise, and Social Media Signals
Many new traders rely on tips from friends, influencers, Telegram groups, or YouTube videos. The problem is that most of these sources do not explain the logic behind the trade or the risk involved. Acting on tips without understanding the market leads to blind trading and quick losses.
Instead:
Learn technical and fundamental analysis
Understand the reason behind every trade
Follow a tested strategy, not random opinions
Smart traders trust data, not noise.
8. Unrealistic Expectations of Fast Wealth
The biggest psychological trap for new traders is the belief that trading will make them rich quickly. This mindset pushes traders to take oversized risks, leading to frequent blow-ups.
Successful trading requires:
Years of learning
Discipline and emotional control
Proper risk management
Realistic expectations
Think long-term and focus on consistency rather than big, quick profits.
9. Not Understanding Market Conditions
Markets don’t behave the same every day. Sometimes they trend strongly; other times they move sideways or show high volatility. New traders often use the same strategy in all market conditions, leading to losses.
Understanding market phases helps you adapt your strategy. For example:
Trending markets favor breakout or trend-following strategies
Sideways markets favor range trading or mean reversion
High volatility requires wider stop-loss and smaller positions
Adapting to market conditions drastically improves performance.
10. Lack of Patience
Patience is a superpower in trading. New traders often:
Enter too early
Exit too early
Fail to wait for confirmation
Want every trade to be profitable instantly
Markets reward patience and punish impulsiveness. Waiting for the perfect setup improves win rates and reduces unnecessary losses.
11. Not Practicing on Demo/Backtesting
Many beginners jump straight into live trading without testing their strategy. This is like flying a plane without training. Practicing on a demo account helps you understand:
Market movements
Platform functions
Strategy performance
Emotional reactions
Backtesting on historical data helps validate your strategy’s reliability.
12. Ignoring News and Economic Events
Major economic events—like interest rate decisions, CPI data, jobs reports—can cause sharp market movements. Beginners often get trapped when they trade unknowingly during high-impact events.
Always check the economic calendar before entering a trade.
Conclusion
New traders often fail not because markets are impossible, but because they repeat common, avoidable mistakes. Success in trading comes from discipline, risk management, continuous learning, and emotional control. By avoiding the mistakes listed above and building a strong foundation, new traders can gradually develop the skills required to navigate the financial markets confidently.

XAUUSD – CLEAR INVERSE HEAD & SHOULDERS FORMATION, CONTINUE ...💛 XAUUSD – CLEAR INVERSE HEAD & SHOULDERS FORMATION, CONTINUE TO PRIORITISE BUY SETUPS 🎯
🌤 1. Overview – Today’s Market Picture
Hello everyone, Lana here again 💬
During the Asian session this morning, gold completed the right shoulder of a very clear Inverse Head & Shoulders pattern on the H3/H4 timeframe. Those who bought following the previous setup are now in a favourable position, and in my view, this is still a good time to hold Buy positions and prepare for additional entries once the market confirms the trend.
On the macro side, according to the CME FedWatch tool, the probability of the Fed cutting rates by 25bp in December has dropped to around 30–33%, while the likelihood of keeping rates unchanged remains dominant.
This means the USD is not weak enough to push gold sharply higher, but also not strong enough to suppress it—creating a volatile range-bound environment, which is ideal for technical-pattern trading.
💹 2. Technical Analysis – Inverse Head & Shoulders & Market Structure
The Inverse Head & Shoulders pattern has formed quite cleanly:
Left shoulder → Head → Right shoulder, all supported by the long-term ascending trendline.
The demand zone around 4040–4050 is acting as a liquidity box supporting the entire structure.
The neckline is currently around 4089–4090:
Once price breaks above and closes above 4089, we can consider a confirmed bullish trend.
After the breakout, gold may extend toward 4145 → 4200, which aligns with higher liquidity zones + upper FVGs.
Zone 4130–4132:
A major liquidity cluster—where many take-profit orders & short-term sell orders may appear.
If this zone is broken decisively, price may accelerate quickly toward 4200.
Zone 4040:
This is both the bottom of the pattern and a key support.
The bullish structure fails if gold closes below 4040 on H4, which would invalidate the Inverse H&S pattern.
Overall, price is currently compressing right below the neckline, and just one strong breakout could trigger the next bullish wave.
🎯 3. Reference Trading Plan (For Study Purposes Only)
💖 Primary BUY Scenario – Following the Pattern
1️⃣ Buy on retracement to support
Entry: 4060–4063
SL: 4055
TP: 4088 → 4108 → 4130 → 4143 → 4200
2️⃣ Buy the neckline breakout
Condition: Price breaks the descending trendline & neckline, and closes above 4089.
Entry: around 4089–4092
SL: 4080
TP: 4132 → 4145 → 4200
💢 Notes on SELL Setups
Selling now is counter-trend against the pattern and not the priority.
Consider only short-term sells if:
Price reacts strongly at 4132–4145, and
Clear bearish signals appear on M15–M30 (pin bar, bearish engulfing, rising sell volume).
⚠️ 4. Fundamental Factors to Watch
High probability that the Fed keeps rates unchanged → market may stay flat before data releases, then spike in volatility.
Gold remains sensitive to data: employment, inflation, and speeches from Fed officials.
🌷 In summary
The Inverse Head & Shoulders on XAUUSD supports the bullish scenario as long as price stays above 4040 💛
Strategy:
Prioritise Buy setups: first at 4060–4063, then on the breakout above 4089.
Watch the 4132–4145 zone closely—if broken, the move toward 4200 becomes highly probable.
If you found this analysis helpful, don’t forget to 💛 Like – 💬 Comment – 🔔 Follow LanaM2 for daily gold updates!

Gold Recovers, Targeting FVG & Liquidity Zone 4.20x📊 Market Structure
Gold has completed a deep decline from the 4,20x zone and continuously created bearish BoS, indicating sellers controlled the period from 14–18/11.
However, a significant sign appeared when:
Price created an Order Block at 4,008 USD
Then surged to create a Change of Character (ChoCH) on the H1 timeframe
The market maintained higher lows on the intraday structure
This indicates that selling momentum has weakened, and buyers are starting to rebuild a short-term bullish structure.
Currently, the price is approaching the Supply & Resistance zone at 4,086 USD – the zone confirming the strength of the BUY side.
If the price decisively breaks this zone, the next targets are clear:
FVG 4,150 USD
Liquidity Zone 4,202 USD – where old peak liquidity is concentrated
💎 Key Technical Zones
• Order Block: 4,000 – 4,009 USD → the main reversal zone of the current rally
• Supply & Resistance: 4,078 – 4,086 USD → trend confirmation point
• FVG Zone: 4,132 – 4,150 USD → zone where a corrective reaction may occur
• Liquidity Zone $$$: 4,195 – 4,205 USD → target of large capital flows
🎯 Trading Plan – Prioritize BUY according to structure
1️⃣ BUY Setup – Trend Following
Activated when price breaks and retests the 4,086 USD zone:
Entry: 4,086 – 4,090
SL: 4,058
TP1: 4,132
TP2: 4,150
TP3: 4,202
→ This is the highest probability setup: a new uptrend is forming + retesting the invalidated supply zone.
2️⃣ BUY Setup 2 – Deep Retracement (safer)
If the price is rejected at 4,086 and returns to test the lower zone:
Entry: 4,050 – 4,058 (Premium Zone on chart)
SL: 4,028
TP: 4,086 → 4,132 → 4,150
→ This setup offers a higher R:R, suitable for patient traders.
3️⃣ SELL Scalp – For intraday only
If the price hits FVG 4,150 and shows strong rejection signals:
Entry: 4,148–4,150
SL: 4,160
TP: 4,130 → 4,100
→ Not for swing traders. This is merely a technical reaction at the FVG zone.
🧠 Vincent’s View
The main trend of the day leans towards recovery – expanding towards upper liquidity.
As long as the price remains above 4,008 USD, the BUY side will continue to lead the market.
“Follow the structure, follow the liquidity — the market never lies.” ⚜️
