Banking Sector Leadership in the Trading Market1. Why Banking Sector Holds Leadership in the Market
1.1 Highest Weightage in Index
The Nifty 50 allocates the largest share — around 33–38% — to financials, mainly banks.
Bank Nifty itself is a major index, made up of leading private and public banks.
When banks move, the entire index moves, causing large-scale shifts in sentiment.
Because of this high weightage, even a small percentage change in heavyweights like HDFC Bank, ICICI Bank, SBI, Kotak, or Axis Bank heavily influences Nifty’s direction.
1.2 Heart of the Economy
Banks are essential to every major economic activity:
Loans to corporates
Retail credit (housing, auto, personal loans)
Government bond investments
Infrastructure project financing
MSME support
If the banking sector is healthy, it signals that the economy is healthy — which boosts market confidence.
1.3 Institutional Ownership & Liquidity
Foreign investors (FIIs) and domestic institutions (DIIs) prefer banking stocks because:
They offer high liquidity
Business models are predictable
Regulated by the RBI
They move directly with interest rate cycles
This heavy ownership ensures that banking stocks are actively traded, making them natural leaders.
2. How Banking Sector Influences Market Sentiment
2.1 Reacts Fast to Macro Events
The banking sector responds immediately to:
RBI interest rate decisions
Inflation data
GDP trends
Liquidity conditions
Global interest rate changes
Whenever an economic event occurs, banking stocks show the first and strongest reaction. Traders watch them closely to judge market direction.
2.2 Credit Growth vs. Market Trend
High credit growth indicates:
Expansion in business activity
Higher consumption demand
Strong financial health
This fuels bullish sentiment across the market.
On the other hand, slowing credit growth reflects:
Weak business confidence
Stress in industries
Tightened liquidity
Markets often turn bearish when banks show declining loan growth.
2.3 NPA (Non-Performing Assets) Cycle
Bank NPA trends influence corporate health and market mood:
Falling NPAs = better profitability = bullish sector = bullish market
Rising NPAs = stress in corporates = bearish tone
Thus, traders consider NPA cycles as early indicators of broader market conditions.
3. Why Traders Focus on Bank Nifty as a Lead Indicator
3.1 Bank Nifty Moves Faster and Sharper
Bank Nifty is more volatile than Nifty due to:
Leverage-based business model
High sensitivity to macroeconomic shifts
Higher FII participation
Bigger intraday moves
Because of this, it often leads the market — if Bank Nifty is bullish, Nifty usually follows.
3.2 Option Trader’s Favourite Index
Bank Nifty has:
High liquidity in options
Narrow bid-ask spreads
Better price discovery
Faster momentum
Day traders, scalpers, and positional option traders use Bank Nifty as a sentiment gauge.
3.3 Banking Stocks Form Market Breadth
When major banks like HDFC Bank, ICICI Bank, SBI surge together, it signals:
Strong institutional buying
Rising market confidence
Start of a broader upward trend
When they fall together, it often marks:
Weak sentiment
FII selling pressure
Potential index correction
4. Key Drivers of Banking Sector Leadership
4.1 Interest Rate Cycle
The banking sector's performance is strongly tied to interest rates:
Rate hikes increase banks' net interest margin (NIM)
Rate cuts boost loan demand
Stable rates create predictable earnings
Traders use interest rate expectations to forecast banking stock direction.
4.2 Liquidity Environment
Banks thrive when liquidity is high:
Credit expansion happens easily
Market cap of banks rises
Valuations improve
Low liquidity can stress banking stocks, sending negative signals to the overall market.
4.3 Corporate & Retail Loan Mix
Private sector banks with strong retail portfolios (HDFC Bank, Kotak) often lead bullish rallies due to stable earnings.
PSU banks lead when:
Government spending rises
Infrastructure cycle strengthens
Bond yields fall
The leadership shifts based on the credit cycle.
5. How Banking Sector Leadership Affects Other Sectors
5.1 Triggers Rally in Interest-Sensitive Sectors
When banks are bullish, other sectors also pick up:
Real estate
Auto
Infra
Metals
FMCG (due to consumer spending boost)
This creates a broad-based market rally.
5.2 Influences Economic Cyclicals
Banks act as a barometer for:
Capital expenditure cycles
Corporate profit cycles
Manufacturing activity
Consumption levels
Strong banks = strong growth cycle = bullish markets.
5.3 Leads Early Reversals
Before a major rally or correction, banks usually turn first.
In early bull markets → banks break out first
In early bear phases → banks drop sharply before other sectors
This makes the banking sector a predictive indicator.
6. Traders’ Framework for Using Banking Leadership
6.1 Monitor Bank Nifty First
Before trading Nifty or other indices, traders check:
Bank Nifty trend
Price action
Volume profile
Leading stocks strength
Derivatives data
If Bank Nifty is strong, traders prefer bullish trades in the broader market.
6.2 Track Leading Banks
Key stocks to watch:
HDFC Bank
ICICI Bank
Axis Bank
SBI
Kotak Mahindra Bank
IndusInd Bank
These stocks often show early signs of trend continuation or reversal.
6.3 Use Leadership for Confirmation
A market cannot sustain a bullish trend for long without support from banks.
So traders look for:
Breakouts in Bank Nifty
Strong candle formations
Low wicks (showing buying pressure)
Heavy volumes
Positive FII data
These signals confirm strength.
7. Conclusion: Why Banking Sector Remains Market Leader
The banking sector’s leadership is not temporary — it is structural. Banking acts as:
The largest weighted sector in indices
The economic engine of credit and liquidity
The favorite playground for institutions and traders
The macro-sensitive sector that reacts first
The trendsetter for bullish and bearish phases
In simple terms:
If banks rise → the market rises.
If banks fall → the market weakens.
For any trader trying to understand market structure, trend strength, or broader sentiment, analyzing the banking sector — especially Bank Nifty — is essential.
Trade ideas

Part 9 Trading Master Class With Experts Best Practices for Safe Option Trading
Start with buying options, not selling.
Use a defined stop-loss and target.
Avoid trading during low liquidity.
Choose ATM/ITM options for better probability.
Follow trend + volume + price action.
Don’t trade based on emotions or rumours.
For selling, always hedge positions.
Keep risk per trade under 1–2% of capital.

Gold Possible scenarioIn 4H TF price has been made 5 ways structure so please very carefully trade, my bias still bullish side, one of the reason is bitcoin, nasdaq and spx are in correction phase so gold and silver for the time being will remain still bullish.
Its my idea not trading advise so plan your trade as per your rules, all the best for all traders.
Thanks

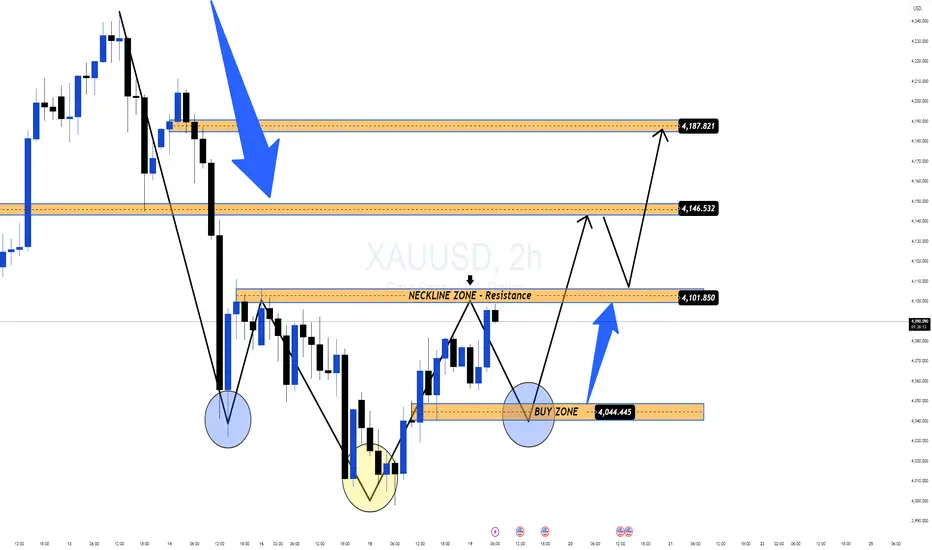
Gold Forms Inverted Head & Shoulders: Reversal Signal!After a short-term corrective decline, the $4,000 level has triggered strong BUY momentum, creating a clear price rebound at the end of yesterday's session. The increase in buying volume indicates that the BUY side is returning to the market after several sessions of being pushed down.
📊 Prominent Technical Structure
On the 2H chart, gold is completing the Inverted Head & Shoulders pattern – one of the strongest bullish reversal patterns.
• Head: liquidity bottom at 4,00x
• Two shoulders: forming symmetrically with good bounce
• Neckline: area 4,101–4,102, currently a key resistance
Price is likely to:
1️⃣ Slightly adjust to the neckline area or BUY ZONE 4,044–4,046
2️⃣ Retest – Accumulate – Confirm breakout
3️⃣ Break out towards 4,146 → 4,187 when the pattern is complete
🎯 Short-term Expectations
Volatility may increase ahead of upcoming economic data, so the reasonable strategy remains:
✅ Prioritize BUY according to the pattern
• Wait for retest of neckline or area 4,044–4,046
• Observe confirmation force (Volume – Momentum – Rejection)
• Target towards 4,146 → 4,187 if the pattern is activated
⚠️ Note
– The reversal trend is only truly confirmed when the price clearly breaks the 4,101–4,102 area.
– Market sentiment currently leans towards recovery, but clear signals are needed before entering large (long-term HOLD) positions.
GOLD H1 – Trump’s Fed Comments Shake Market Sentiment🟡 XAUUSD – Intraday Smart Money Plan | by Ryan_TitanTrader (19/11)
📈 Market Context
Gold is trading in a tight corrective structure as markets react to breaking headlines that Donald Trump is considering removing Fed Chair Jerome Powell.
This news injects uncertainty into Fed policy expectations, causing short-term volatility in USD and positioning gold at a critical decision zone.
• Trump’s comments increase speculation about a potential policy shift, which may temporarily weaken USD sentiment.
• However, gold remains capped below the premium supply zone as institutional flows continue to engineer liquidity sweeps.
• Price is hovering near $4,080 ahead of key Fed-related discussions, keeping both sides of liquidity active.
Institutional order flow suggests controlled accumulation at the discount range while premium regions remain defended by sellers.
🔎 Technical Analysis (1H / SMC Structure)
• Structure: Price is forming a short-term distribution pattern after multiple BOS events from the 4150 breakdown.
• Premium Sell Zone: 4109–4111, aligning with unmitigated supply and internal liquidity pockets.
• Discount Buy Zone: 4009–4007, sitting inside a clean demand block + previous sell-side sweep.
• Liquidity:
→ Buy-side liquidity sits above 4111, where equal-high clusters form.
→ Sell-side liquidity rests between 4007–4000, where earlier long positions were cleared.
🔴 Sell Setup (Premium Reaction Zone)
• Entry: 4109 – 4111
• Stop-Loss: 4119
• Take-Profit:
→ 4055 (minor inefficiency)
→ 4028 (BOS retest)
→ 4009–4007 (discount demand)
📌 Execute only after a liquidity sweep into the zone + bearish CHOCH on M5–M15.
🟢 Buy Setup (Discount Reaction Zone)
• Entry: 4009 – 4007
• Stop-Loss: 4000
• Take-Profit:
→ 4040 (short-term range high)
→ 4075 (inefficiency rebound)
→ 4105/4110 (premium retest)
📌 Valid if price sweeps 4007 and shows bullish displacement.
⚠️ Risk Management Notes
• Expect volatility as traders react to Trump’s comments on Fed leadership.
• Avoid trading in the 4030–4080 chop zone without a clear structural break.
• Reduce position size during impulsive spikes around USD sentiment shifts.
• Trail stops once price clears each liquidity pocket.
📝 Summary
Gold is being influenced heavily by uncertainty around Trump’s remarks about replacing Fed Chair Powell. Liquidity is building at both extremes, offering clean opportunities at the edges of the range.
• Sell Zone: 4109–4111 (premium supply)
• Buy Zone: 4009–4007 (discount accumulation)
Expect a manipulation → reaction → continuation pattern as institutions play both sides of the current structure.
📍 Follow @Ryan_TitanTrader for more Smart Money updates.
🎁 Gifts in BIO for traders who follow daily plans.

WEEKLY PROFILE ON GOLDGold opened and made a weekly low on Monday and later stop hunt it on Tuesday before it broke structure to make a market structure shift (MSS) now we expect to see a distribution phase FOR THE REST OF THE WEEK to the upside to the level 105.00.

XAUUSD Weekend Analysis Nov 19,2025
Looking at the chart, the market is still moving inside a broad descending channel, and the price is currently sitting just below a major trendline that has been acting as resistance for some time. Every attempt to break above it has been rejected, which tells us that sellers are still defending that level strongly.
Support
4025–4030: Very strong support. If the market breaks below this zone, momentum could quickly shift to the downside.
4000: Psychological support.
Resistance
4150–4180: Immediate resistance area where price may struggle.
4250–4300: The next major hurdle if the upside continues.
Trendline resistance from the descending channel.
📈 What to Expect Next
Bullish Case
If the price continues to hold above 4025, the market has room to push higher. A clean breakout above the trendline would open the way towards 4170, and eventually 4250–4300. This becomes more likely as long as buyers protect the demand zone.
Bearish Case
If the market closes below 4025, the structure weakens. In that scenario, we could see a deeper correction toward 3950, and possibly even 3850 if selling pressure increases.
🎯 Final Thoughts
The market is currently in a tight consolidation phase, building pressure between support and resistance. The 4025–4030 zone is the line in the sand — hold it, and the market remains bullish; lose it, and sellers take control. The upcoming breakout from the trendline will likely decide the next major move.

Weekly profile on GoldSo gold opened the week and made a monday low that was later stop hunt yesterday on Tuesday during London session to make a weekly low so we expect to see a distribution phase throughout the week in the upperside to price level 105.00
XAUUSD – Head & Shoulders Pattern Forming on H4 💛 XAUUSD – Head & Shoulders Pattern Forming on H4 🎯
🌤 Overview
Hello everyone, Lana here again 💬
After a strong drop, Gold is forming a clear Head & Shoulders structure on the H4 timeframe, aligned with the long-term ascending trendline. This pattern suggests the possibility of a bullish move back toward previous highs — but price may still dip lower to complete the structure first.
💹 Technical Analysis (ICT Perspective)
The Left Shoulder – Head – Right Shoulder is gradually shaping around the trendline + supporting FVG.
The upper 50% Fibonacci area is a reasonable zone for the right shoulder to form. If price breaks above the neckline, it may head toward the major liquidity zone around 4200.
In the short term, the 4118–4120 zone serves as resistance + neckline, making it suitable for a technical Sell setup.
The 4040–4042 area aligns with the trendline + Order Block, forming a strong support zone for potential Buy entries if price makes a deeper correction.
🎯 Trading Plan (For Reference Only)
💢 SELL Scenario (scalping at resistance)
Sell: 4118–4120
Stop Loss: 4125
Take Profit: 4105 → 4086 → 4060 → 4040
💖 BUY Scenario (preferred with the main pattern)
Buy: 4042–4040
Stop Loss: 4034
Take Profit: 4075 → 4090 → 4100 → 4140 → 4200
⚠️ Important Notes
Trading based on patterns is always expectation-driven, so combine it with candlestick confirmation on smaller timeframes (M15–M30) before entering.
Upcoming FOMC Meeting and NFP report, especially after the long U.S. government shutdown period, may cause unpredictable volatility.
Reduce position size and avoid holding large trades during major news events.
🌷 Final Thoughts from LanaM2
The H4 Head & Shoulders pattern on Gold is offering attractive opportunities for both short-term Sells and trend-aligned Buys 💛
Stay patient, wait for price to reach the marked zones, follow your stop-loss rules, and avoid FOMO during high-impact news.
If you found this helpful, please 💛 Like – 💬 Comment – 🔔 Follow LanaM2 for daily Gold insights!

Spot goldDetails provided in the chart, gold is forming like triangle flag pattern support 4000 to 4060
Gold is stronger in longer terms short term it will move up and down
Bullish for longer term
Disclaimer:
Only for education purposes not recommendation

Current Market Structure & Key Observations Previous Trend: The Current Market Structure & Key Observations
Previous Trend: The chart shows a strong uptrend from late October, peaking around November 14th at approximately $4,400. This peak marked a significant reversal.
Correction/Reversal: Since the peak, the price has undergone a sharp downward correction or potential reversal.
Trendline Interaction: The price has recently fallen to and is currently interacting with a major long-term ascending trendline (the solid black line).
Current Price: The price is hovering right at the trendline, indicated by the dashed pink line at approximately $4,034.
Analysis of the Projected Path (Red Lines)
The red lines drawn on the chart suggest a specific bearish scenario:
Trendline Break and Retest: The price is shown to break below the ascending trendline. This is a critical technical signal, often indicating the end of the uptrend and the start of a downtrend.
Pullback/Retest: The price then executes a pullback back up to the broken trendline (now acting as a resistance level). The projected high for this pullback is around $4,060.
Bearish Continuation: After failing to break back above the trendline, the price is projected to continue its decline, heading towards the area of $3,900 and then possibly $3,850 in the following days.
Potential Scenarios (Alternative View)
While the red lines illustrate a clear bearish path, it's important to consider an alternative:
Scenario 1: Bearish Continuation (As Projected)
Action: If the price confirms a breakout below the trendline (closes below it on multiple candles), the trendline turns into resistance.
Target: The focus shifts to lower support levels, with initial targets around $3,900 - $3,850. This confirms the end of the recent uptrend.
Scenario 2: Trendline Hold/Bounce
Action: If the trendline acts as strong support and the price fails to close significantly below it, it could lead to a bounce.
Target: A bounce would target the previous swing high before the major drop, potentially aiming back toward $4,150. This would maintain the longer-term bullish structure.

GOLD H1 – Hawkish Fed Pressure Ahead of Key NFP Data🟡 XAUUSD – Intraday Smart Money Plan | by Ryan_TitanTrader (18/11)
📈 Market Context
Gold is trading inside a bearish corrective channel as markets react to hawkish Federal Reserve commentary and positioning ahead of this week’s U.S. NFP data.
• Fed officials signaled a stronger stance against premature rate cuts, keeping USD supported and limiting gold’s upside.
• Price continues to hover near $4,080, reflecting uncertainty as traders balance Fed tone with upcoming labour-market reports.
Institutional order flow shows controlled downside pressure, with engineered liquidity sweeps forming around both channel extremes.
🔎 Technical Analysis (1H / SMC Structure)
• Structure: Price remains inside a Bearish Correction Channel, creating consecutive BOS points, confirming distribution.
• Premium Sell Zone: 4107–4105 aligns with a previous mitigation block + internal liquidity.
• Discount Buy Zone: 3983–3985 sits at the lower boundary of the channel + liquidity sweep zone.
• Liquidity:
→ Buy-side liquidity above 4107 (clean equal-high pocket).
→ Sell-side liquidity resting around 3985–3976, where prior long positions were removed.
🔴 Sell Setup (Premium Reaction Zone)
• Entry: 4,107 – 4,105
• Stop-Loss: 4,117
• Take-Profit Targets:
→ 4,060 (minor imbalance fill)
→ 4,030 (BOS retest)
→ 3,985 (discount zone)
📌 Execute only after a liquidity sweep into the zone + bearish BOS on M5–M15.
🟢 Buy Setup (Discount Reaction Zone)
• Entry: 3,983 – 3,985
• Stop-Loss: 3,976
• Take-Profit Targets:
→ 4,030 (short-term structure high)
→ 4,060 (inefficiency midpoint)
→ 4,105 (premium retest)
📌 Valid if price taps channel low + shows bullish displacement.
⚠️ Risk Management Notes
• Expect volatility as markets digest hawkish Fed remarks before NFP.
• Avoid entering trades inside the 4020–4070 chop region without clear BOS.
• Reduce position size during news hours.
• Trail stops once price clears each liquidity pocket.
📝 Summary
Gold remains pressured by Fed rhetoric, but liquidity is building at both extremes.
• Sell Zone: 4107–4105 (premium mitigation area)
• Buy Zone: 3983–3985 (discount liquidity sweep)
Price is likely to form a manipulation → reaction → continuation pattern within the channel.
📍 Follow @Ryan_TitanTrader for more Smart Money updates ⚡
🎁 More insights & gifts on my TradingView profile.

Xauusd making pennantA big move expected in NY session wait for either side to break to catch the move
Expected is Selling

Gold direction today November 17📊 Support – Resistance – Fibonacci Analysis
1. Trend Overview
Price has broken below the ascending channel, signaling a shift into a corrective downtrend phase.
2. Key Resistance Zone
4,215 – 4,230
Confluence of Fibonacci retracement 0.5 – 0.618
Overlaps with a supply zone + EMA89
→ Strong resistance, high probability of selling pressure.
This is also the expected pullback/retest area before the next bearish leg.
3. Key Support Levels
Support 1 – 4,000
Fibonacci extension 0.5
Horizontal support
→ Likely to generate a short-term reaction.
Support 2 – 3,890
Major downside target if the structure fully breaks
→ Primary bearish target for a deeper continuation.
4. Price Scenario
Price may pull back toward 4,215 – 4,230.
BUY GOLD : 4000 - 3997
Stoploss : 3987
Take Profit : 100-300-500pips
SELL GOLD : 4212 - 4215
Stoploss : 4225
Take Profit : 100-300-500pips


BUY AGAIN BREAKOUT TREND LINE🕯SELL GOLD: 4018- 4015
⚠️ SL: 4015
✔️ TP: 4024→ 4030→3934( 60- 170 pips)
The 4018–4015 zone has just been broken, and with the temporary bearish structure on M15 also violated, there is a high probability that price will pull back and retest this zone.
If that happens, we’ll have a beautiful and technically clean BUY pullback opportunity aligned with the post-breakout structure.
📌 Notes:
This is a BUY pullback setup based on the M15 break of structure
Only BUY with clear candle confirmation
Small lot size + tight SL for safety
I’ll update again when price approaches the retest zone. 🔔🔥

GOLD (XAU/USD): THE BATTLE OF NFP AND FED!1️⃣ TECHNICAL VIEW (TA): Awaiting Sell Confirmation
Structure: The short-term uptrend has ended, prices are adjusting/reversing.
Main Supply Zone (Order Block - OB): Prices are retracing to the ideal sell zone (around $4,064 - $4,081).
Strategy: Prioritise seeking SELL signals at the OB zone.
Target: $3,976 and $3,931 if the OB zone holds.
2️⃣ FUNDAMENTAL VIEW (FA): Interest Rate Pressure
Selling pressure is increasing from:**
Fed Rate Cut Expectations Dwindle: The probability of a 25bps rate cut in December has fallen below 50%. The "Higher for Longer" signal reduces Gold's appeal.
Upcoming Risks: The market awaits NFP and FOMC Minutes. Strong data will bolster USD and sink Gold.
⚠️ Opposing risk: Uncertainty from the US Government shutdown and geopolitical tensions (Russia/Ukraine) may restrain the decline.
#XAUUSD #Gold #TradingSetup #SELLZone #Fed #NFP #PriceAction #SmartMoneyConcepts #Forex

XAUUSD – TWO MAIN SCENARIOS FOR THE DAY: MONITOR REACTION AT...💛 XAUUSD – TWO MAIN SCENARIOS FOR THE DAY: MONITOR REACTION AT TRENDLINE 🎯
🌤 1. Overview
Hello everyone 💬
Gold is currently waiting at the H4 trendline, indicating the market is lacking volume to decide the next direction.
Although the price is adjusting after the drop from the 4,400 USD zone, the larger trend is still supported by strong buying flows from central banks.
💹 Market Context
According to Goldman Sachs, the current decline is only temporary, as the demand for gold as a safe haven asset remains strong:
US bond yields are falling
USD is weakening
The US economy is under pressure from unemployment and inflation
In September alone, central banks purchased 64 tonnes of gold, and forecasts suggest that November may continue this strong accumulation trend.
💹 Technical Analysis
📉 If Gold breaks below the trendline → the market will trigger strong selling pressure, pulling back to the 395x zone, where there is low liquidity and important support.
📈 Conversely, if the price holds the trendline and volume pushes up, a short-term upward structure will form.
📌 The 4068 zone is a key level — if the price retests this area and falls back, Buy will only activate when it reaches 4034.
🎯 Reference Trading Scenarios
🔻 SELL – When breaking the trendline (priority if volume is strong)
Sell 4036–4038 │ SL: 4044
TP: 4010 → 3995 → 3970 → 3945
🔹 BUY – Strong support 395x
Buy 3952–3954 │ SL: 3957
TP: 3975 → 3995 → 4030
🔸 BUY maintaining trend (if price rebounds at 4068)
Buy at 4034 after confirmation signal
⚠️ Important Note
Volume is currently low, making the market prone to stop sweeps, so enter orders with small volume.
The larger trend is still supported by flows from central banks, but in the short term, Gold may fluctuate strongly around the trendline.
Prioritize trading based on price reactions at key zones rather than predicting direction in advance.
🌷Gold is in a sensitive phase at the H4 trendline 💛
If you find this useful, please 💛 Like – 💬 Comment – 🔔 Follow LanaM2 to receive daily gold analysis ✨

GOLD H1 – Will Retail Sales Trigger Gold’s Next Big Move?🟡 XAUUSD – Intraday Smart Money Plan | by Ryan_TitanTrader (17/11)
📈 Market Context
Gold is trading inside a corrective phase as markets anticipate today’s U.S. Retail Sales data and several Fed speeches — both crucial for assessing whether inflation momentum is slowing or rebounding.
• Weak retail numbers may hint at cooling consumer strength, supporting safe-haven bids in gold.
• Strong data could revive USD demand, prompting sell-side setups from premium zones.
Institutional flows show engineered pushes into inefficiency before a directional leg unfolds.
🔎 Technical Analysis (1H / SMC Structure)
• Structure: Gold is forming a short-term accumulation at the discount range after consecutive bearish candles and a deep liquidity sweep below 4030.
• FVG Sell Zone: 4140–4138 aligns with an unmitigated FVG + internal liquidity — ideal for sell-side reactions.
• Discount Zone: 4008–4010 is the last clean demand zone + sweep area, matching the chart’s projected bullish inducement.
• Liquidity:
→ Buy-side liquidity rests above 4140.
→ Sell-side liquidity remains exposed near 4000–3995.
🔴 Sell Setup (Premium Reaction Zone)
• Entry: 4,140 – 4,138
• Stop-Loss: 4,150
• Take-Profit Targets:
→ 4,095 (intra-day imbalance fill)
→ 4,060 (previous BOS block)
→ 4,010 (discount accumulation area)
📌 Trade only after a liquidity sweep into FVG + bearish BOS on M5–M15.
🟢 Buy Setup (Discount Reaction Zone)
• Entry: 4,010 – 4,008
• Stop-Loss: 4,000
• Take-Profit Targets:
→ 4,060 (short-term structure high)
→ 4,095 (mid-range inefficiency)
→ 4,138 (final premium reaction zone)
📌 Valid if price sweeps 4008 and shows bullish BOS + displacement.
⚠️ Risk Management Notes
• Expect volatility during the U.S. Retail Sales release.
• Avoid chasing price inside the 4060–4100 chop region.
• Lock profits at each liquidity level and trail stops.
• Keep total risk under 1–2% per setup.
📝 Summary
Gold remains in a engineered pullback phase with clear liquidity pockets at both extremes.
• Sell Zone: 4140–4138 (FVG / premium reaction zone)
• Buy Zone: 4008–4010 (discount accumulation zone)
A clean manipulation–reaction–continuation pattern is likely before the next intraday move.
📍 Follow @Ryan_TitanTrader for more Smart Money updates ⚡
Check out my TradingView profile for special gifts 🎁

XAUUSDFinally the wait is over. From morning I was on sell side for gold and everyone was waiting for the breakout finally it happened booked good profit after so many fakeouts.

XAUUSD Bearish Breakout Setup from Ascending Triangle Retest1. Market Structure
The chart shows a strong downtrend, followed by a Break of Structure (BOS) to the downside.
After BOS, price formed a corrective ascending structure (an ascending triangle / rising wedge).
2. Current Pattern
Price is moving upward in a corrective manner, showing lower bullish strength.
The ascending trendline is acting as temporary support.
The horizontal resistance at the top of the triangle reflects slowing bullish momentum.
3. Short Entry Logic
The marked point (yellow circle) shows price tapping the ascending trendline.
The red arrow indicates entry short, expecting a breakdown from this rising structure.
This matches the logic:
✔ Downtrend
✔ BOS
✔ Weak bullish correction
✔ Short at trendline retest before a bearish continuation
4. Target Expectation
The “TARGET” label points upward, but based on context this seems contradictory.
Given BOS and corrective rise, the logical target is downward, toward previous liquidity levels or lows.
The triangle breakout normally aligns with continuation of the previous trend, which is bearish.
5. Trade Bias
Bias: Bearish
Reason: Structural break + corrective pullback + rising wedge = continuation pattern.
6. Risk Considerations
Stop-loss usually goes above the most recent swing high inside the correction.
Watch for any strong bullish candle breaking above the ascending structure — that invalidates the setup.

XAU/USD TRADING PLAN 17/11/20251️⃣ CONTEXT
Last Friday saw a drop of ~200 points → confirming strong selling pressure.
No major news today, expected movement:
Wide sideways 4030–4120
Sell bias (priority to sell at high zones)
The major trend remains in a down channel, any rise is mainly for unloading.
2️⃣ GENERAL RULES
SL: 10 points for all trades
TP: 10 points for all trades
3️⃣ SELL ZONES (PRIMARY)
4120–4125
4146–4148
4160–4165
4182–4185
4210–4215 (strongest resistance of the day)
4️⃣ BUY ZONES (RETRACEMENT)
4056–4050
4033–4030
3996–3994
3966
3888
5️⃣ SUMMARY
Bias: Sideways → priority to Sell.
Sell at resistance zones, Buy at strong support zones.
SL/TP adjusted according to RR ratio 1:1, 1:2
Pay attention to appropriate volume

XAU/USD – Rebalancing Structure, Support Zone Holding Steady⏰ Timeframe: 30m
📅 Update: 17/11/2025
🔍 Market Context
After the extended decline late last week, gold is gradually stabilizing around the 4,050–4,080 USD zone, showing a positive reaction at the structural support zone.
The recent Break of Structure (BOS) sequence indicates that the selling momentum is gradually weakening, while the newly formed Order Block is acting as a temporary balance for the market.
The current structure slightly leans towards a technical recovery, as buying flows are returning around the main support zone.
📊 Technical Structure
Support Zone (4,049–4,080 USD): a critical support zone, confluencing with the previous liquidity bottom.
Order Block (4,096–4,115 USD): a short-term supply-demand area, potentially a retest point before the price expands higher.
Resistance Zone (4,145 USD): the first intermediate level to overcome to confirm upward momentum.
Target Zone (4,210 USD): the upper liquidity zone, corresponding to the potential expansion mark of the recovery wave.
🎯 Market Outlook
Priority scenario for the day:
1️⃣ Gold may retest the Order Block zone 4,096–4,115 USD before forming the first push up to 4,145 USD.
2️⃣ If buying pressure is maintained and this resistance zone is broken, the expansion momentum may head towards 4,210 USD, corresponding to a higher liquidity zone.
3️⃣ Losing the 4,049 USD mark will invalidate the recovery structure and bring the market back to a lower balance zone.
🧠 Analyst’s View
The market is currently in a reaccumulation phase after a strong correction.
Buyers still maintain a technical advantage as long as the price remains above the 4,049 USD support zone.
Observing price behavior around the Order Block and the 4,145 USD zone will be key signals to confirm the strength of this recovery wave.
🛡️ Risk Note
The current phase is a “pullback phase” within the larger structure.
Traders should wait for clear price behavior confirmation at technical zones rather than predicting movements in advance.
