HBAR Market Report: Structural Recovery in ProgressHBAR Market Report: Structural Recovery in Progress
HBAR Market Report
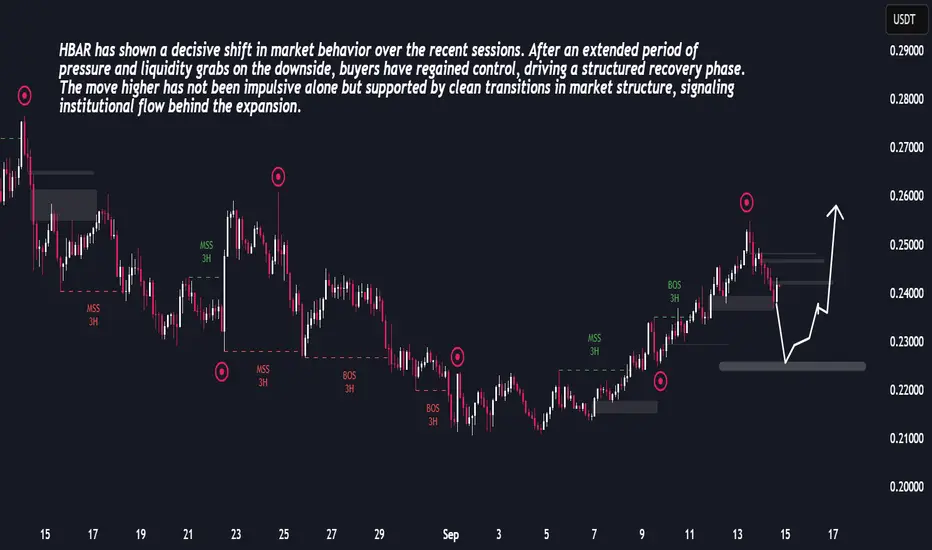
HBAR has recently completed a clear cycle of distribution, decline, and recovery. After experiencing extended downside pressure in late August, the market shifted into accumulation, showing liquidity sweeps and structural shifts that hinted at buyer activity.
As momentum built, HBAR transitioned into expansion, confirming strength with higher highs and consistent breaks in structure. The rally into mid-September reflects healthy order flow, with corrections acting as controlled pauses rather than signals of weakness.
The latest pullback indicates a short-term re-balancing phase. Price action suggests liquidity is being collected, preparing the market for another impulsive leg higher. This rhythm of decline, absorption, and expansion continues to align with a constructive medium-term outlook.
HBARUSDT.3S trade ideas
HBARUSDT BUY ZONEHBARUSDT BUY ZONE
The buy zone for HBAR is as follows:
Price range: $0.13853, or around that level.
Timing: Wait for a "has bottom" signal on the weekly timeframe.

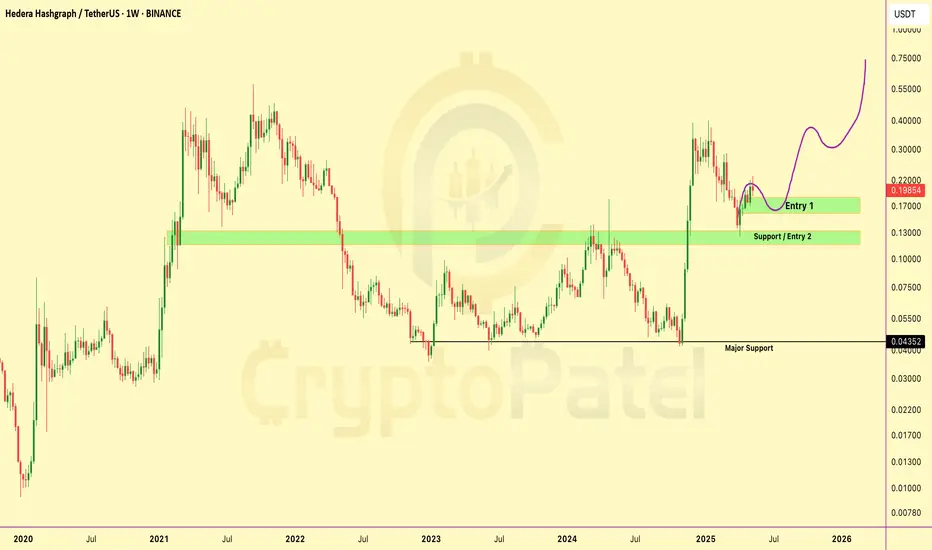
HBAR/USDT Chart Analysis and Price ProjectionMassive CRYPTOCAP:HBAR Rally Loading – Only If This Zone Holds!
Price is holding the critical support at $0.130 — a confirmed base here could trigger a major upside move toward $0.50–$1 🚀
▶️ Accumulation Zone: $0.180–$0.160
▶️ Invalid below $0.124
▶️ Above = ultra bullish structure in play!
Hedera (HBAR) Spot Trade SetupWith HBAR trading at a key support level, this presents a solid long opportunity if buyers step in to defend the zone. A successful bounce could push the price towards key resistance levels.
🛠 Trade Details:
Entry: Around $0.18 (Support Level)
Take Profit Targets:
$0.25 - $0.285 (First TP Zone - Initial Resistance)
$0.35 - $0.39 (Second TP Zone - Major Resistance)
Stop Loss: Just below $0.175
Watching for bullish confirmation before entry. 🚀

Hbar Playing the Strength Hbar has strong buyers since the start of current BullRun, trade setup 2H TF entry 30M TF.
Start of OG style Alt Session.

Hbar Playing the Strength Hbar has strong buyers since the start of current BullRun, trade setup 2H TF entry 30M TF.
Start of OG style Alt Session.

HBAR/USDT now 855% up From our Entry HBAR/USDT Huge Profit Update 🚀
Big congratulations to everyone who followed Cryptopatel's CRYPTOCAP:HBAR analysis! 🎉
➡️ HBAR/USDT is now up 855% from our entry point!
➡️ Entry: $0.037 - $0.040
✅ Target 1: $0.083
✅ Target 2: $0.170
✅ Target 3: $0.252
✅ Target 4: $0.44 (almost reached!)
Now’s a good time to take 80% profit at this level.
If you started with $1000, it’s now worth $8500.
Let’s keep the momentum going. 🚀

Are Bears Of HBAR Halting The Run?Hedera has a market cap of $3.23 Billion and is ranked 32nd in the cryptoverse. It has observed a decline of 54% in the overall volume in the intraday session. HBAR is currently trading near the value of $0.09 with a slight gain in the intraday session.
The asset price is currently forming bearish candles on the daily chart. It is trading below the 50 and 100 EMA on the daily chart. The upside trend of HBAR can see a halt near the value of $0.125. Meanwhile the support of the asset price can be seen near $0.085.
The RSI of the HBAR is near 32 with a strong negative slope. The overall sentiment of the RSI is bearish in nature.

Is HBAR Bulls Aiming For $0.3?HBAR has a market cap of $4.04 Billion and is ranked 27th in the CMC. The overall volume of the asset price has seen a decline of 36% in the past 24 hours. Hedera token price is currently trading near the value of $0.1129 with a decline of 2.19% in the intraday session. It has a total supply of 50,000,000,000 HBAR and has a total supply of 71.5%.
HBAR token price is currently trading above the 50 and 200 EMA. The token price is currently forming a consolidated pattern on the daily chart. The upside trend of HBAR can see a halt near $0.2 while the support price can be observed near $0.085.
The RSI of the HBAR is currently near 53 highlighting its presence in the neutral zone. The overall sentiment of the RSI and HBAR is neutral.

HBAR's breakout from the W pattern suggests a bullish reversal.💎 Paradisers, #HBAR has successfully broken out of a W pattern, indicating a potential bullish reversal. If #HBARUSDT undergoes a retest of the broken resistance level, confirming the validity of the W pattern, it could provide us with targets towards the next resistant level, given the nature of this reversal pattern.
💎In the event of a pullback, we may anticipate a bounce from the Bullish OB, which often serves as a significant support level.
💎However, if the price breaks down below the bullish OB as well, it might be wise to exercise patience and wait for clearer price action to develop before considering any trading decisions.

HBAR/USDT 180% up from our Entry and Still 10x Potential #HBAR Ready for $1 in Bull Market?
1000% Potential as per Chart.
CRYPTOCAP:HBAR is currently 180% up from our entry and the most important thing we bought at the actual Bottom.
Our Entry was: $0.037 ✅
You booked a huge Opportunity to buy at Dips in the Green Box ✅
New Re-Entry Zone: $0.07-$0.08 ( If Price dump )
Targets:-
TP1: $0.083 ✅ ( 180% up )
TP2: $0.17
TP3: $0.25
TP4: $0.5
Long Term Target: $1
Still Potential 1000% gains in this bull run from our Re-entry zone.
Supports: $0.07
If you are happy with my analysis please Rt/Like
#cryptocurrency

SMC Concept | Pullback | Long BiasOn 1h TF
HBAR is pullback to 0.0786 this level is Good Entry Zone based on #SMC
Wait for rejection around this level to join

HBAR USDT IDEAThere are two possible moves in HBAR.
Just watch the market sentiments and follow the trend.
This is an easy trade to do. Meet You on Monday. 25th Sep


Hedera HashgraphOn-Chain Analysis
According to DefiLlama, the total value locked (TVL) of Hedera has grown by 88% since 1st Jan 2023 and currently stands at $44.2 million. This increase is driven by the sustained success of Saucerswap and launch of Heliswap and Bubbleswap, as per Messari report.
Technical Analysis
The two most important metrics in the analysis is price action and volume. Our aim is to trade with trend and trend direction is governed by momentum. When momentum decreases, there is a high probability of market moving sideways.
To determine momentum of trend, we will use price and volume.
1. When price crosses above 7-moving average price or breaks resistance with 7-moving average volume > 21-moving average volume, we can say there is high momentum and lesser probability of price breaking below that particular resistance.
2. When price crosses above 7-moving average price or breaks resistance with 7-moving average volume < 21-moving average volume, we can say there is low momentum and higher probability of price again moving below that particular resistance.
Support level: 0.847
Resistance level: 0.993
RSI: 70 (high momentum)
MACD> signal line
Note:
Note:
Please DYOR before trading/ investing.
Studies are for educational purposes only.
We will not be responsible for any kind of your Profits & Losses.

HBAR | Hedera Hashgraph gonna Blast !The price of HBAR is in a primary trendline support! Big Whales are accumulating HBAR. Soon the price will skyrocket.

HBARUSDT LONGHBARUSDT Long At Live price 0.0736
Target and Stop Loss given in the chart
Happy Trading


hbar usdt longtrying to pierce the zone the third time , keeping in mind btc and the bull market if btc rallies , this coin has no choice but to follow the foot steps.
Long 15% qty as of now, rest on break out and then go on pyramydding.
Volumes picking up

HEDERA HASHGRAPH CRYPTO 15 MINUTESHEDERA HASHGRAPH crypto 15 minutes candles chances to breakout and big stoploss


Hbar usdtExpect a good bounceback fron 50 ema and also has some duppirt over ther......we can also dee it is following an uptrend
