GOlD WEEKLY CHART BREAKOUTGold chart weekly Breakout of trendline good move possible keep in watchLongby patelmanoj2491Published 0
Gold Dec LongGold Dec Long Buy at CMP- 47960 SL- 47600 Target- 48345, 47470, 48580 Join us, Learn more, Earn more Disclaimer- We are not SEBI registered advisor. Charts and views are only for educational purpose. Longby ashwinjethwani1409Published 1
Gold may show some of its colorsIt has been observed that Gold may give a breakout above Rs. 48000/10G (a monthly chart). Keep your Goldbees on the radar. by SpunkygamerUpdated 0
BreakOut🟢 MCX:Gold future has given a #SymmetricalTriangle breakout on the weekly scale. 🟢 Weekly RSIStairs breaking out above 55. Bullish for a #ShortTerm to #MediumTerm 🟢 Looks good to buy #GoldBees for #PortfolioBuilding #Investment till its above 40Longby TradersVenueUpdated 0
Gold Dec LongGold Dec Long Trend is still positive Buy at CMP- 47411 SL- 47130 Target- 47830, 47985, 48130 Join us, Learn more, Earn more Disclaimer- We are not SEBI registered advisor. Charts and views are only for educational purpose. Longby ashwinjethwani1409Updated 3
MCX GOLD ANALYSIS - Short CallGold on MCX is very bullish this month. Since October 1st, Gold rallied from ₹ 45800 to ₹ 47800 today on MCX. Gold has a major support at 47850. Currently Gold is trading around 47800 Conclusion If you are a trader then you can have a short term short call in Gold, target can be seen upto ₹ 47400. Make a strict stop loss of ₹ 47880Shortby moneymarinePublished 0
Gold Dec LongGold Dec Long Buy at CMP- 47430 SL- 47280 Target- 47830, 47985, 48130 Join us, Learn more, Earn more Disclaimer- We are not SEBI registered advisor. Charts and views are only for educational purpose. Longby ashwinjethwani1409Published 114
Gold is about to fly. !!!!Buy gold for your Diwali before it hikes to upper circuit… Not for investment purpose just for your Diwali jewelry… Longby prajwalpawarPublished 1
GOLD Trading ideas !gold currently facing resistance at 47300-47500 and trying to breakout this zone and volume higher than 21 DMA keep this in your radar with SL as support zone Longby agasthya_dPublished 0
Gold Mcx Buy for long in dipgold running in corrective pattern continues, so may be good reversal after completed this pattern. so can be good buy position at support level as 45900 for long. if price close below 45500, then try to exit form buy at entry point, and wait for good buy position for long at good support level.Longby jainsambhuPublished 0
Gold Dec LongGold Dec Long short term resistance breakout support at 50 Day EMA around 46850 Buy at CMP- 46980 SL- 46750 Target- 47190, 47320 Join us, Learn more, Earn more Disclaimer- We are not SEBI registered advisor. Charts and views are only for educational purpose. Longby ashwinjethwani1409Updated 1
GOLD MCXGold has possibly completed its complex correction in wave II and now it looks like wave III is unfolding, today it has given breakout from the down sloping resistance trendline, along with macd positive crossover and uptick in daily time frame, other indicators are also giving positive signs of uptrend at breakout point, as wave III unfolds, gold can possibly rise higher towards 52000 and more, one can go long at these levels or in dips ( if any ) with key levels mentioned on chart. wave struchture could be like this key levels are mentioned on chart macd in weekly macd in daily ready to bbc rsi in daily uptick and ready to cross above 60 levels dmi adx positive ungali Disclaimer I am not sebi registered analyst My studies are for educational purpose only Consult your financial advisor before trading or investingby RK_ChaartsPublished 5
Buy Gold at CMP 46000 sl 45777 tgt 46444 46555 46666 46777 46999The current trend in XAU/USD seems positive after bouncing off its long-term area of support (1752 – 1763) but gold is likely to struggle to find bullish momentum whilst below 1790 utill it cross and stay their. A break above this area would place buyers in a good position to try and tackle 1800, at which point resistance is likely to be met on the way up to the 61.8% Fibonacci at 1834.Longby riticonsultancyUpdated 0
GOLD IS WAITING .on daily time frame rsi is showing +ve divergence. although market shows -ve for gold but, festive demand and china crisis for energy & realstate might push gold. waiting for one green candle.by vaidhynathdubeyUpdated 3
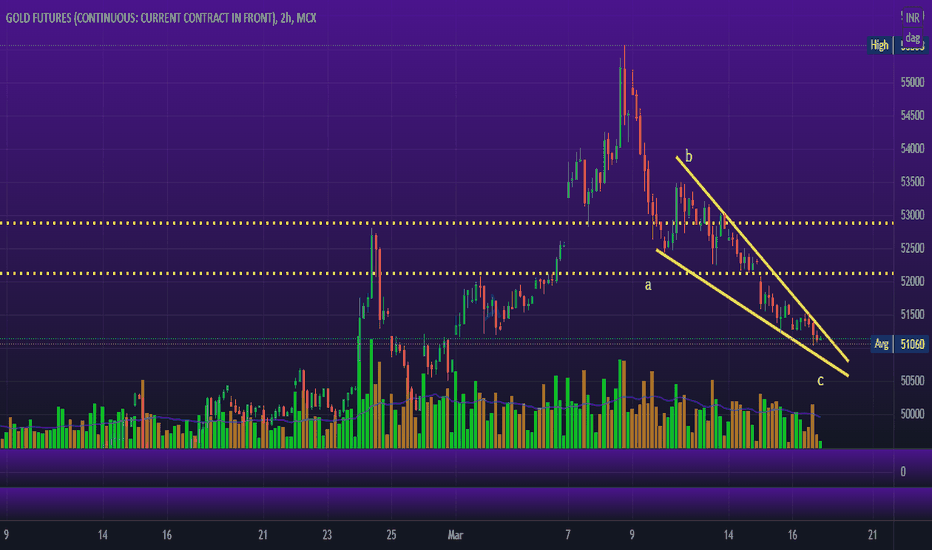
GOLDCMP: 48982 It's a weekly chart of GOLD Future. Breaking out of a falling wedge. Longby OmkarBannePublished 0
MCX GOLD TRADINGYellow metal on MCX may remain volatile, traders can take a short positions. CMP : 46635 at 1:15 (IST) Stop Loss : 46810 Target : 46225 On th October, MCX Gold DEC Contract made a low of ₹ 46477, which is expected to be broken by today or tomorrow amidst a firmer dollar and a rise in US Treasury yields weighed on the precious metal’s appeal. Yellow metal will remain under pressure this week. Buy on dips strategy could work for both the precious metals. Buy zone above - Rs 46,850 for the target of Rs 47,300 Sell zone below - Rs 46,500 for the target of Rs 46,200 December Gold closing price - Rs 46,757, Support 1 - Rs 46450, Support 2 - Rs 46,300, Resistance 1 - Rs 46,850, Resistance 2 - Rs 47,125. MCX:GOLD1!Shortby moneymarinePublished 0
Gold Dec LongGold Dec Long Taking support at lower level Hammer candle Buy at CMP- 46700 SL- 46400 Target- 46950, 47100 Disclaimer- We are not SEBI registered advisor. Charts and views are only for educational purpose. Longby ashwinjethwani1409Published 1
Gold Mini levels...04/10/2021 (1hr Candle)Goldmini forms bearish hormonic pattern but not breaks support ...so will wait for breakout either down or upside after only decide the tradeby albnsecuritiesPublished 111
Is the interest in Gold Coming BackCompression in the Daily Charts and RSI fighting 50Longby Ragaas_FinservePublished 0
MCX Gold Price Limited Downside, Big UpsideMCX gold has started falling since 1st June, and it's moving under a parallel channel. But this time, it can break out this channel. Why? I will explain it through Elliott wave projection in the next update. In the last trading session, it made a Doji candlestick. And that's a sign of trend change. If gold does not break the crucial level, then it can drop up to 0.382 to 0.236 . In simple words, short-term targets: 46200 - 45960 - 45765 And for long-term traders: 45600 - 45060 But, the uptrend isn't far away. If gold does breakout of 46860 level, then we may see 47276 - 47600 - 47960+ . Don't get confused! You have to watch out the level 46860 for an uptrend, and the closing price below the Doji candle indicated a bearish trend signal. This week we may see higher fluctuations due to upcoming economic events. Watch the following significant releases or events that may affect the movement of gold, silver, crude oil, & natural gas: Monday, Oct 04, 2021 15:30 OPEC Meeting - Medium Impact Tuesday, Oct 05, 2021 19:30 ISM Non-Manufacturing PMI (Sep) - High Impact Wednesday, Oct 06, 2021 02:00 API Weekly Crude Oil Stock - Medium Impact 17:45 ADP Nonfarm Employment Change (Sep) - High Impact 18:30 FOMC Member Bostic Speaks - Medium Impact 20:00 Crude Oil Inventories - High Impact 21:00 FOMC Member Bostic Speaks - Medium Impact Thursday, Oct 07, 2021 18:00 Initial Jobless Claims - High Impact 20:00 Natural Gas Storage - Low Impact Friday, Oct 08, 2021 18:00 Nonfarm Payrolls & Unemployment Rate - High Impactby freestocktipsPublished 118
GOLD right time to buy MCX:GOLD1! could see starting of long uptrend. SL- previous week low -on weekly suport. - .618 fibsupport of previous swing low & high -good risk reward please note this is weekly TF. #the_pravin #simplepriceaction #notoindicator #nakedchart #swingtrading Longby the_pravinPublished 0
Gold Dec LongGold Dec Long Flag Pattern Breakout Buy at CMP- 46450 SL- 46190 Target- 46685, 46780, 47030 Disclaimer- We are not SEBI registered advisor. Charts and views are only for educational purpose. Longby ashwinjethwani1409Published 1
GOLDLong can be initiated if close is above yesterday's high with SL of yesterday low. On chart it seems that trend is towards downside but on other side of table it may be trying to flush out weak hands. It has broken previous support and close below that also and now it is coming up again.. it may be a bear trap..Longby YS9Published 0