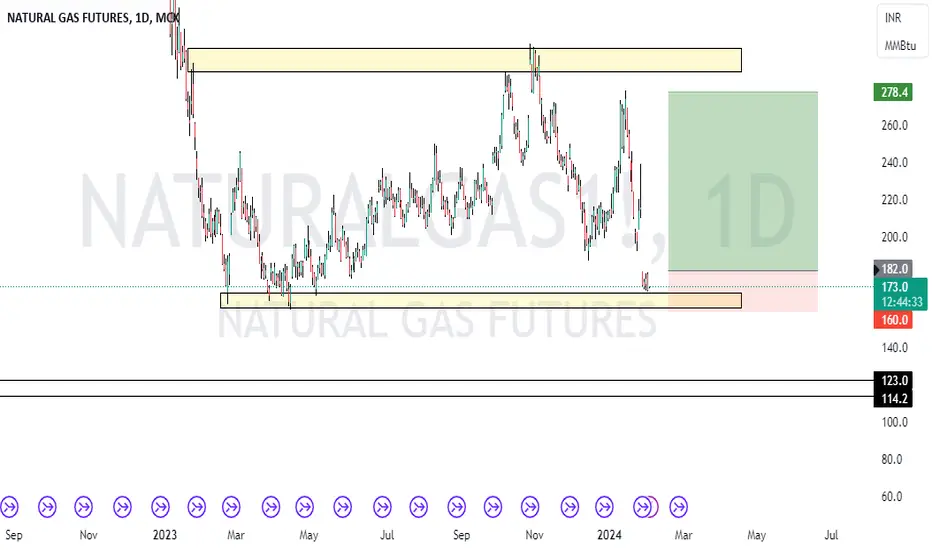
Stays at the support ready to make a move - Natural GasNatural Gas is now residing in its year long support zone around 175 - 160 range if it breaks down it can go till its lifetime support zone of around 115 - 120 . if breaks above 190 (Giving a bullish confirmation) we shall expect it to go at least till 280. Remember this is a positional call which could go on for months.
Trade ideas
Natural Gas MCX Future Analysis for Today 1 Feb., 2024
🔥 NATURAL GAS 27 FEB FUT LEVELS 📊 - Trading Alert! 🚀
📅 Day Range - 9.3 Points
📈 Buy at 176.75
🎯 Target 1 - 182.95
🎯 Target 2 - 186.5
💡 Add one lot at 175.65
🛑 Buyer SL - 173.05
📉 Sell at 174.55
🎯 Target 1 - 171.45
🎯 Target 2 - 167.9
💡 Add one lot at 178.25
🛑 Seller SL - 178.25
Trade smart and good luck! 📊💼 #NaturalGas #GasTrading #CommodityMarket #EnergyPrices #TradingAlert #MarketWatch #FuturesTrading #InvestmentTips #DayTrading #FinancialMarkets - Stay informed and stay profitable! 💹🔍 #MarketAnalysis #TradingStrategies #FinancialFreedom

NaturalGas || Weekly levels || 31st - 2nd FebTimeframe: 4 HOUR
Nat-gas prices rebounded from an 8¾-month low, supported by fund buying near $2/mmbtu. Short covering followed, lifting prices. Warm U.S. temperatures, an LNG terminal outage, and ample supplies persist.

Natural Gas MCX Future Analysis for Today 29 Jan, 2024🔥 NATURAL GAS 27 FEB FUT ANALYSIS 🔥
Levels: Day Range: 29.4 Points
Buy at: 228.17
Target 1: 233.17
Target 2: 244.4
Add one lot: 224.7
Buyer SL: 219.73
Sell at: 221.23
Target 1: 196.83
Target 2: 185.6
Seller SL: 229.67
📊 Analysis:
Natural Gas opens with a Buy entry at 228.17, eyeing targets at 233.17 and 244.4. Adding one lot at 224.7 enhances the position with a cautious Buyer Stop Loss at 219.73. For sellers, an entry at 221.23 is aimed at targets 196.83 and 185.6, with a Seller Stop Loss at 229.67.
📈 Market Outlook:
The day range indicates moderate volatility, providing opportunities for both buyers and sellers. Traders are advised to stay vigilant and adapt strategies based on market movements.
📌 Prominent Hashtags:
#NaturalGas #CommodityTrading #FuturesAnalysis #TradingView #TechnicalAnalysis
Trade smartly and stay informed! 📊💹

NATURALGAS || MCX || 23 JANNatural gas is currently at a crucial support level of 196.2.
Target would be 7-9 points downside!!
If this support level is breached or broken, it implies that there may be a further decline in the price of natural gas. In technical analysis, breaking a support level is often seen as a bearish signal, indicating potential downward momentum in the market.
Support this idea by click on thumbs up button!!


Natural Gas MCX Future Analysis for Today 23 Kan., 2024🔥 NATURAL GAS ANALYSIS - 26 JAN FUT LEVELS 🌬️
Trade Setup:
Buy at: 201.11 📈
Targets: 207.81 🚀, 210.9 🎯
Add one lot at: 200.15 🔄
❌ Buyer Stoploss: 197.69 ⛔
Sell at: 199.19 📉
Targets: 197.79 🎯, 194.7 🔽
❌ Seller Stoploss: 202.61 ⛔
Day Range: 8.1 Points 📊
Seizing Opportunities in Natural Gas Trading! 💹📊
🔍 Analysis:
Natural Gas presents intriguing prospects in today's market. The buy entry at 201.11 opens the door to targets at 207.81 and 210.9, with an option to add a lot at 200.15 for potential gains. Conversely, the sell entry at 199.19 sets the stage for targets at 197.79 and 194.7, with a safeguarding stoploss at 202.61.
💡 Strategy Tips:
Prioritize risk management with specified stop-loss levels.
Stay attuned to market trends and news.
Act decisively based on real-time price movements.
📊 Day Range Insights:
With a day range of 8.1 points, Natural Gas shows moderate intraday volatility. Traders, brace yourselves for potential fluctuations within this range.
🌐 #NaturalGas #Commodities #TradingSignals #IntradayTrading #FinancialMarkets #MarketAnalysis #InvestmentOpportunity
Remember, trade wisely, and always conduct thorough research. Best of luck with your Natural Gas trades! 🌬️📈✨

Natural Gas MCX Future Analysis for Today, 23 Jan., 2024🔥 NATURAL GAS ANALYSIS - 26 JAN FUT LEVELS 🌬️
Trade Setup:
Buy at: 201.11 📈
Targets: 207.81 🚀, 210.9 🎯
Add one lot at: 200.15 🔄
❌ Buyer Stoploss: 197.69 ⛔
Sell at: 199.19 📉
Targets: 197.79 🎯, 194.7 🔽
❌ Seller Stoploss: 202.61 ⛔
Day Range: 8.1 Points 📊
Seizing Opportunities in Natural Gas Trading! 💹📊
🔍 Analysis:
Natural Gas presents intriguing prospects in today's market. The buy entry at 201.11 opens the door to targets at 207.81 and 210.9, with an option to add a lot at 200.15 for potential gains. Conversely, the sell entry at 199.19 sets the stage for targets at 197.79 and 194.7, with a safeguarding stoploss at 202.61.
💡 Strategy Tips:
Prioritize risk management with specified stop-loss levels.
Stay attuned to market trends and news.
Act decisively based on real-time price movements.
📊 Day Range Insights:
With a day range of 8.1 points, Natural Gas shows moderate intraday volatility. Traders, brace yourselves for potential fluctuations within this range.
🌐 #NaturalGas #Commodities #TradingSignals #IntradayTrading #FinancialMarkets #MarketAnalysis #InvestmentOpportunity
Remember, trade wisely, and always conduct thorough research. Best of luck with your Natural Gas trades! 🌬️📈✨

Natural gas near strong support risky traders can book now On Our Harmonic pattern indicator based trade setup take trade as explained below :-
Early trades Buy or sell below/ above 23.6 %, safe trades buy or sell above / below 41% , after taking trade next upside or downside levels will be target ,
When reverse buy or sell signal appear then book profit on Target or trail SL to 23.6 % If trailing SL hit then early trade can be taken above or below 23.6 and safe trade can b taken above/ below 41% ..
Please note:-
It's working on news based and volitile market very well so exit if SL hit

Natural Gas MCX Future Weekly Analysis for 22-26 Jan., 2024. 🔥 NATURAL GAS - 26 JAN MCX FUTURES WEEKLY ANALYSIS FOR 22 TO 26 JAN., 2024
📊 Weekly Range: 60.2
📈 Buy at: 246.5
🎯 Buy Target 1: 248.1
🎯 Buy Target 2: 271.1
🔍 Add one lot at: 239.4
❌ Buyer Stoploss: 226.43
📉 Sell at: 232.3
🎯 Sell Target 1: 173.7
🎯 Sell Target 2: 150.7
❌ Seller Stoploss: 252.37
📈 Analysis:
Natural Gas offers compelling opportunities. Buyers can target 248.1 and 271.1, with an additional position at 239.4. Sellers may find profit at 173.7 and 150.7. The weekly range of 60.2 indicates potential market movements.
📈 Trade with Caution:
Exercise risk management, use suitable position sizes, and stay updated on market conditions.
Note: This analysis is for educational purposes and not financial advice. Trade responsibly.
#NaturalGas #Commodities #TradingAnalysis #FuturesTrading #TechnicalAnalysis #FinancialMarkets #TradingTips

Natural Gas MCX Future Analysis for Today 19 Jan'24📊 NATURAL GAS 26 JAN FUT LEVELS
📊 Day Range: 21.9 Point
📈 Buy at 237.83
🎯 Target 1: 239.03
🎯 Target 2: 247.4
🔍 Add one lot at 235.25
❌ Buyer SL: 231.17
📉 Sell at 232.67
🎯 Target 1: 211.97
🎯 Target 2: 203.6
❌ Seller SL: 239.33
Resiprocate your love by sharing and commenting. Trade with trends to turn green!

Natural Gas - Long for intraday for 2-3 hrs
Tactical upmove scalping opportunity
ENTRY AROUND 230-232

Natural GasThe natural gas trade presents an enticing opportunity with a 1:3 risk-reward ratio, offering the potential for substantial gains. Investors can capitalize on silver's price movements, taking a calculated risk with the prospect of tripling their initial investment if the trade unfolds favorably. This favorable risk-reward ratio makes the silver market an attractive option for those seeking potential high returns relative to the risks involved.

Natgas Reversal likelyReversal didnt happen as expected at 245 due to weather change with too much hope. Next level is at 289 but that ride is entirely based on the cold weather forecast tilll 17th and the difference in JAN and FEB contracts has reached almost 40 showing the short term bullishness. So high chances of crashing on getting close to the weekend if weather forecast remains same as Supply is still above 100 and last Feb 2021 cold also failed to move this much.

NaturalGas Update || MCX || 16- 17 Jan
Timeframe: 30 Min
Analysis: The statement implies a specific condition for taking a bullish stance (expecting prices to rise) on Natural Gas.
Condition:
The condition is that the price of Natural Gas needs to rise above the level of 250.4. This level is crucial because, according to the analysis, a breakthrough above this point is seen as a signal for potential upward movement.

natural gas ? Draw the trend line lower lows and lower highs, and draw the support line ,its useful to predict the market direction early

Natural Gas 275+ Possibility in 2 MonthsNatural Gas 275+ Possibility in 2 Months
Hourly downtrend is been broken & with Winter demand in place we can see spike in natural Gas prices.
Happy Invetsing.

Natural gas ready for big fall many times buy recommended at 220On Our Harmonic pattern indicator based trade setup take trade as explained below :-
Early trades Buy or sell below/ above 23.6 %, safe trades buy or sell above / below 41% , after taking trade next upside or downside levels will be target ,
When reverse buy or sell signal appear then book profit on Target or trail SL to 23.6 % If trailing SL hit then early trade can be taken above or below 23.6 and safe trade can b taken above/ below 41% ..
Please note:-
It's working on news based and volitile market very well so exit if SL hit

Long natural gasFormed a spike low of 190 and reversed and forming a consolidation range
Levels:
Channel top is at 217 to 220 range.
If crosses decisively can rally to the top resistance of around 240 which can be the hurdle and likely to reverse back to 220 again before next rally.
So enter at 220 with stop in the middle of the channel for that entry and exit at 240.

Natural Gas - MCX Time and Price Levels for today
Time and Price Levels have been marked on the chart. For Time Candles refer to Natural Gas Chart in Dollars and trade accordingly.
Time Candle marked in green is the most important (pivotal) candle for today and will decide the future trend for today.
Note : Your trading view time to be set at UTC +5:30 time setting.
Still have a question? Please write to me in the comments. I am duty bound to answer all your valid questions. This is the only way we can learn and grow.
Disclaimer: I am not a SEBI Registered Analyst. Please consult your financial advisor before making any decision. I will not be responsible for any of your profits/losses. This is only for educational purposes.
Let you grow. May! I follow you.

#NATURALGAS || 3rd Jan || Intraday setup || MCX- Indian market
🔸Timeframe: 4 hour
🔸Strategy: Long
🔸Anticipating a breakout in natural gas above 222, targeting a move to 233 within the week.
🔸October 2023 marked the 30th consecutive monthly increase in US dry natural gas production.
🔸Production levels reached 104.5 billion cubic feet per day during this period.
🔸Estimated natural gas consumption experienced a 3.3% year-over-year increase, reaching 78.7 Bcf/d.
🔸The US maintained its position as a net natural gas exporter, with LNG exports growing by 23.9%.

Natural Gas MCX- Uppdate
Today is Gann Static Date and Natural Gas is going higher up. Dont be worried, hold your nerves and expect a level of even 289 and higher till feb 2024. Put SL at 204 at let it go. First Target 237

Waiting for a powerful impulseNatural Gas is waiting to give a huge breakout on either side , Unless the side is identified , Kindly stay put.
