How to Catch Momentum Traders1. Understanding Momentum Trading
Momentum trading is based on a simple but powerful concept: “The trend is your friend.” Momentum traders look for assets that show strong upward or downward trends and enter trades expecting those moves to continue. They don’t rely much on fundamental analysis or l
Contract highlights
Related commodities
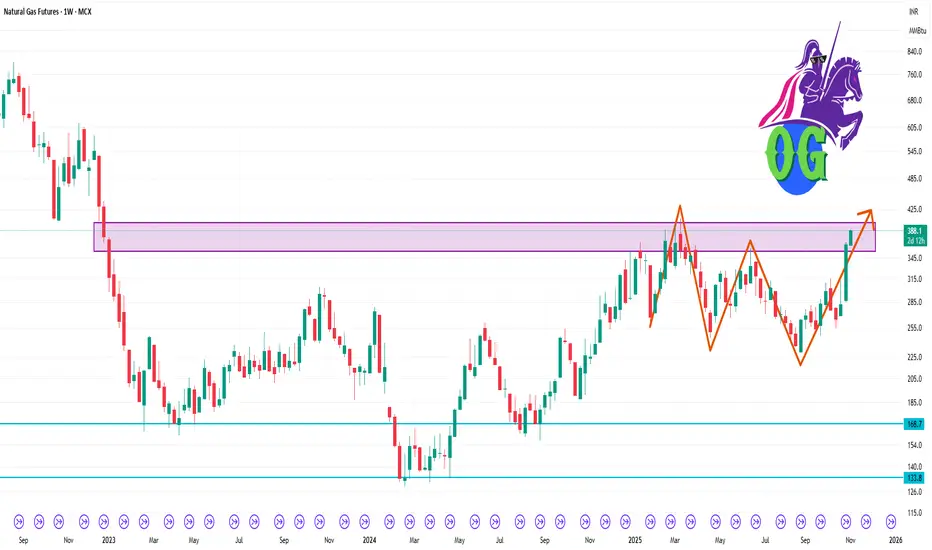
Natural Gas – Decoding the Breakout Beyond Data NoiseNatural Gas Futures – Absorbing the Bearish Data, Anticipating Winter Demand
By Chart Pathik | 31 October 2025
Market Overview
Natural Gas prices on MCX have sustained a strong upward trajectory this week, breaking out from a prolonged symmetrical triangle pattern. This price action came in despi

Geopolitical Energy TradingThe Intersection of Power, Politics, and Global Markets
Energy is the lifeblood of the global economy. Every modern industry—from manufacturing and transportation to technology and agriculture—relies on steady energy supplies. Yet, energy trading is not simply a matter of market forces like supply
Natural Gas Futures 1 Week Time Frame 🎯 Key Levels
Support zone: ~ ₹ 270-285 per mmBtu — this appears to be a hinge demand zone based on recent pullbacks.
Intermediate support / pivot: ~ ₹ 295-310 — price has been oscillating near this zone.
Resistance zone: ~ ₹ 330-350 — breaking above this on a weekly close would shift structure mo
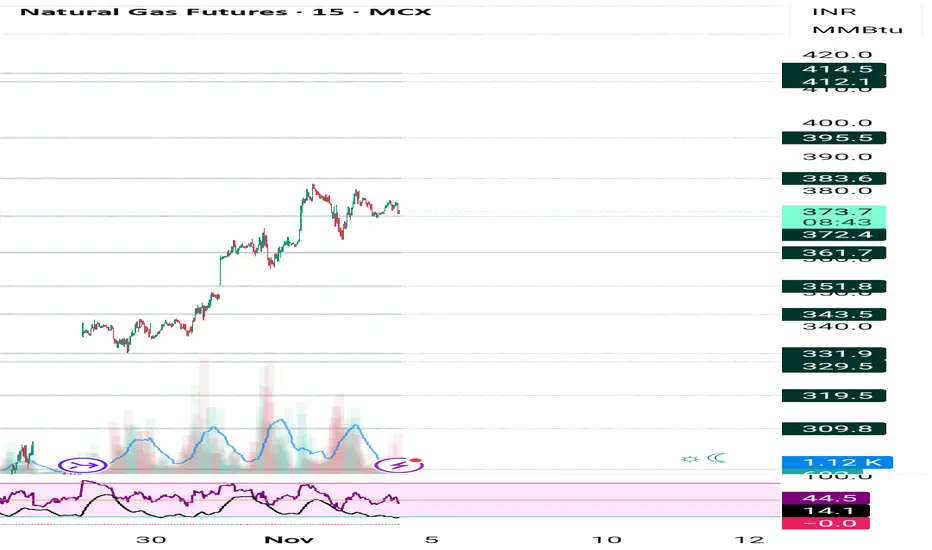
Testing Key Resistance Before Seasonal Up MovePrice is currently hovering near the top of the last resistance zone, while the rollover contract has opened slightly below it, signaling a pause after the recent rally.
If price closes below this level, a pullback toward the 3.56 support zone is likely — a healthy retest before the anticipated Nove

Prime area for reversalThere has been an explosive price surge that is not supported by corresponding volume, and the chart is currently near its seasonal highs. This move appears overextended, increasing the likelihood of a gap-filling correction in the near term. Traders should watch closely for signs of reversal, as in

Natural gas updated levels 350-345 support area avoid buy at cmpNatural gas avoid buying at current price 350-345 support area
How My Harmonic pattern projection Indicator work is explained below :
Recent High or Low :
D-0% is our recent low or high
Profit booking zone ( Early / Risky entry) : D 13.2% -D 16.1 % is
range if break them profit booking sta
LONG NATURAL GAS FOR A TARGET OF 400 RSNatural Gas futures are trading around ₹280, and I remain bullish in the short to medium term. The price action suggests a likely pullback toward ₹270, which I see as a healthy correction before the next strong upside move.
Technically, Natural Gas recently broke out of a consolidation range (₹265–

Naturalgas buy given at 265 booked at 310 ,275-270 possible Natural gas buy recommended ner 265 , we booked profit at 310 , more fall possible from cmp 275-270
How My Harmonic pattern projection Indicator work is explained below :
Recent High or Low :
D-0% is our recent low or high
Profit booking zone ( Early / Risky entry) : D 13.2% -D 16.1 % is

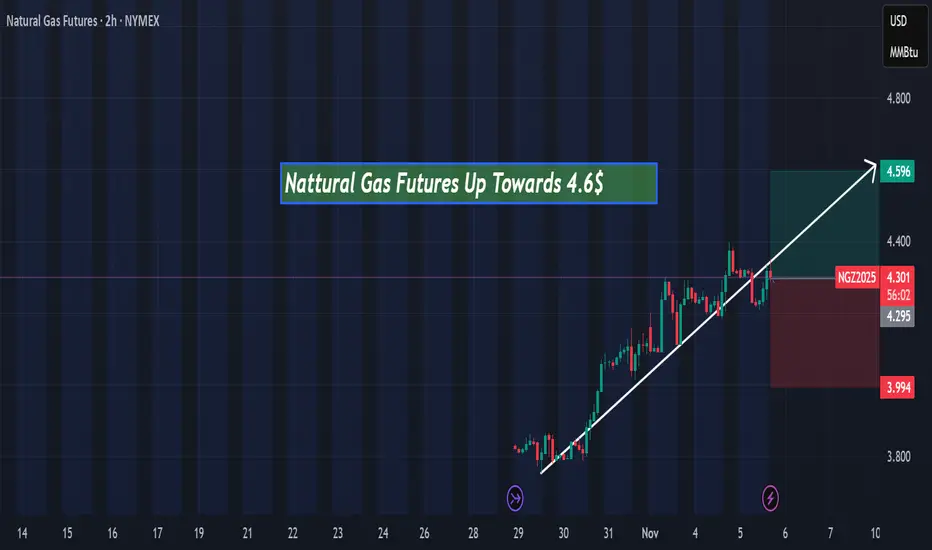
Natural Gas Futures Up towards 4.6$Hi everyone, today Natural Gas Futures is expected to rise toward $4.60 in the next few hours according to my technical analysis.
See all ideas
Summarizing what the indicators are suggesting.
Neutral
SellBuy
Strong sellStrong buy
Strong sellSellNeutralBuyStrong buy
Neutral
SellBuy
Strong sellStrong buy
Strong sellSellNeutralBuyStrong buy
Neutral
SellBuy
Strong sellStrong buy
Strong sellSellNeutralBuyStrong buy
A representation of what an asset is worth today and what the market thinks it will be worth in the future.
Displays a symbol's price movements over previous years to identify recurring trends.
Frequently Asked Questions
The current price of Austrian CEGH VTP Natural Gas Futures is 31.647 EUR / MWH — it has risen 0.36% in the past 24 hours. Watch Austrian CEGH VTP Natural Gas Futures price in more detail on the chart.
Track more important stats on the Austrian CEGH VTP Natural Gas Futures chart.
The nearest expiration date for Austrian CEGH VTP Natural Gas Futures is Feb 28, 2028.
Traders prefer to sell futures contracts when they've already made money on the investment, but still have plenty of time left before the expiration date. Thus, many consider it a good option to sell Austrian CEGH VTP Natural Gas Futures before Feb 28, 2028.
Open interest is the number of contracts held by traders in active positions — they're not closed or expired. For Austrian CEGH VTP Natural Gas Futures this number is 0.00. You can use it to track a prevailing market trend and adjust your own strategy: declining open interest for Austrian CEGH VTP Natural Gas Futures shows that traders are closing their positions, which means a weakening trend.
Buying or selling futures contracts depends on many factors: season, underlying commodity, your own trading strategy. So mostly it's up to you, but if you look for some certain calculations to take into account, you can study technical analysis for Austrian CEGH VTP Natural Gas Futures. Today its technical rating is strong sell, but remember that market conditions change all the time, so it's always crucial to do your own research. See more of Austrian CEGH VTP Natural Gas Futures technicals for a more comprehensive analysis.