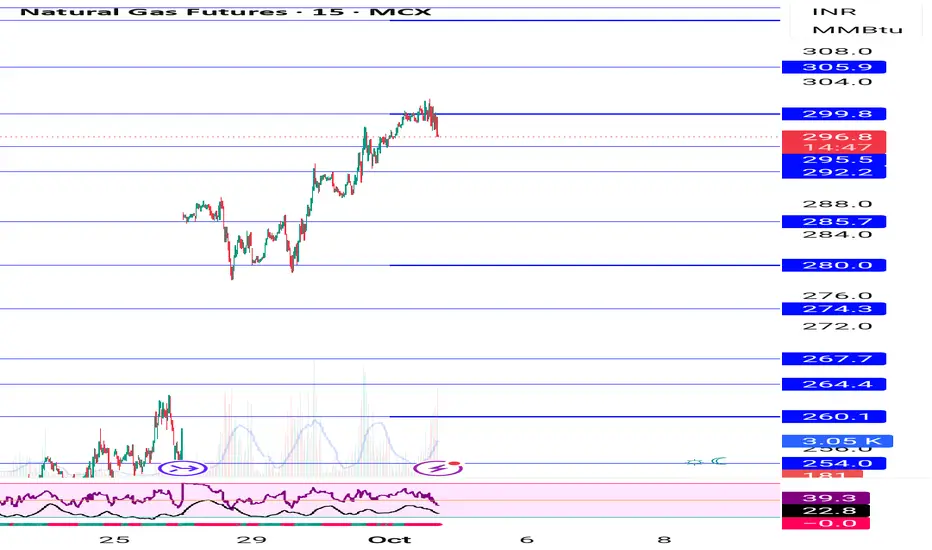
Natural gas yesterday booked at 312 now Wait for inventory dataNatural gas wait for inventory data then take fresh buy avoid sell
How My Harmonic pattern projection Indicator work is explained below :
Recent High or Low :
D-0% is our recent low or high
Profit booking zone ( Early / Risky entry) : D 13.2% -D 16.1 % is
range if break them profit booking start on uptrend or downtrend but only profit booking, trend not changed
SL reversal zone (Safe entry ) : SL 23.1% and SL 25.5% is reversal zone if break then trend reverse and we can take reverse trade
Target : T1, T2, T3, T4 and .
Are our Target zone
Any Upside or downside level will activate only if break 1st level then 2nd will be active if break 2nd then 3rd will be active.
Total we have 7 important level which are support and resistance area
Until , 16% not break uptrend will continue if break then profit booking will start.
If break 25% then fresh downtrend will start then T1, T2,T3 will activate
1,3,5,10,15,20 minutes are short term levels.
30 minutes 60 minutes , 2 hours,3 hours, ... 1 day and 1 week chart positional and long term levels
Austrian CEGH VTP Natural Gas Futures
No trades
Market insights
Natural Gas Levels For October 2025Important support and Resistance Levels For Natural Gas.
When Market touches the level, the price action plays important roles.
For More Learning Reach out to us.
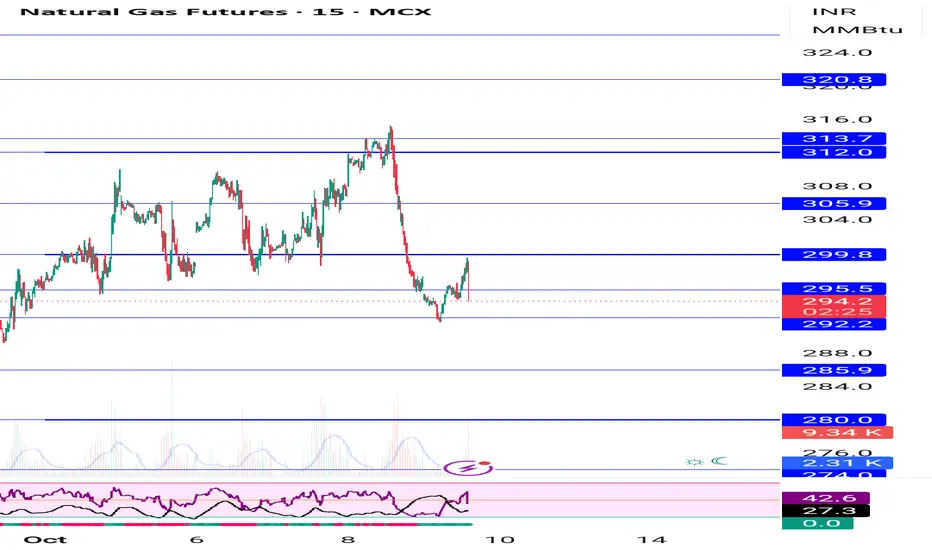
Natural gas continuesly buying recommended from 245 -242 levelsNatural gas continuesly buying recommended from 245-242 levels upside level given on chart until 295 not break upmove will continue
How My Harmonic pattern projection Indicator work is explained below :
Recent High or Low :
D-0% is our recent low or high
Profit booking zone ( Early / Risky entry) : D 13.2% -D 16.1 % is
range if break them profit booking start on uptrend or downtrend but only profit booking, trend not changed
SL reversal zone (Safe entry ) : SL 23.1% and SL 25.5% is reversal zone if break then trend reverse and we can take reverse trade
Target : T1, T2, T3, T4 and .
Are our Target zone
Any Upside or downside level will activate only if break 1st level then 2nd will be active if break 2nd then 3rd will be active.
Total we have 7 important level which are support and resistance area
Until , 16% not break uptrend will continue if break then profit booking will start.
If break 25% then fresh downtrend will start then T1, T2,T3 will activate
1,3,5,10,15,20 minutes are short term levels.
30 minutes 60 minutes , 2 hours,3 hours, ... 1 day and 1 week chart positional and long term levels

natural gas natural gas moving toward forward not ideal place to buy buy option near 295-298 . trg upto 352
sl 272 .
NaturalGas looks bullishNaguralGas completed its second wave correction and expecting that it will show 3.680 (nearly).

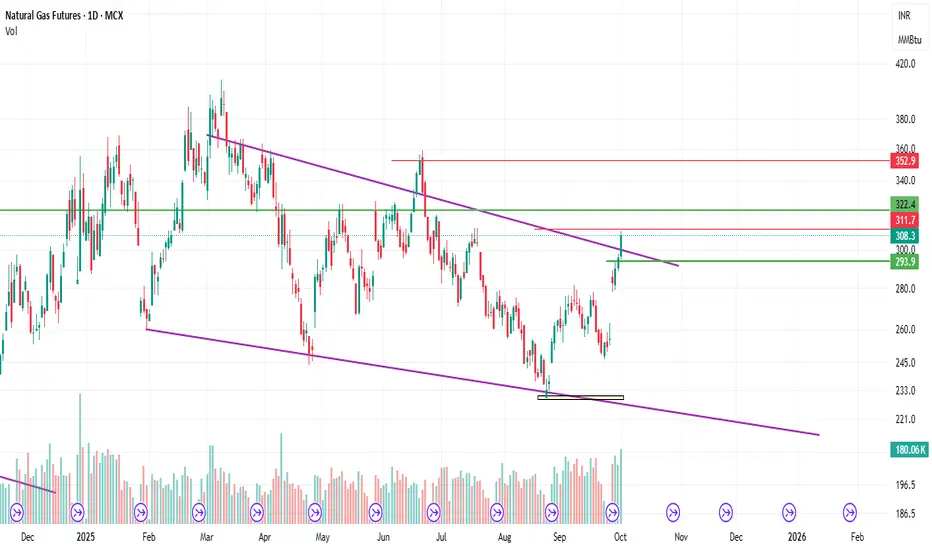
Natural gas 302 target hit then some dip , again buy on dip 290Natural gas 302 target hit buy recommended near 280 , again buy near 290
How My Harmonic pattern projection Indicator work is explained below :
Recent High or Low :
D-0% is our recent low or high
Profit booking zone ( Early / Risky entry) : D 12.3% -D 16.1 % is
range if break them profit booking start on uptrend or downtrend but only profit booking, trend not changed
SL reversal zone (Safe entry ) : SL 23.1% and SL 25.5% is reversal zone if break then trend reverse and we can take reverse trade
Target : T1, T2, T3, T4 and .
Are our Target zone
Any Upside or downside level will activate only if break 1st level then 2nd will be active if break 2nd then 3rd will be active.
Total we have 7 important level which are support and resistance area
Until , 16% not break uptrend will continue if break then profit booking will start.
If break 25% then fresh downtrend will start then T1, T2,T3 will activate
1,3,5,10,15,20 minutes are short term levels.
30 minutes 60 minutes , 2 hours,3 hours, ... 1 day and 1 week chart positional and long term levels
Natural gas 268-260 dip possible then buy upside 295-302 target Natural gas updated levels given on chart initially 268-260 fall possible then buy upside 295-302 upside short term target for next 2 -3 weeks
How My Harmonic pattern projection Indicator work is explained below :
Recent High or Low :
D-0% is our recent low or high
Profit booking zone ( Early / Risky entry) : D 12.3% -D 16.1 % is
range if break them profit booking start on uptrend or downtrend but only profit booking, trend not changed
SL reversal zone (Safe entry ) : SL 23.1% and SL 25.5% is reversal zone if break then trend reverse and we can take reverse trade
Target : T1, T2, T3, T4 and .
Are our Target zone
Any Upside or downside level will activate only if break 1st level then 2nd will be active if break 2nd then 3rd will be active.
Total we have 7 important level which are support and resistance area
Until , 16% not break uptrend will continue if break then profit booking will start.
If break 25% then fresh downtrend will start then T1, T2,T3 will activate
1,3,5,10,15,20 minutes are short term levels.
30 minutes 60 minutes , 2 hours,3 hours, ... 1 day and 1 week chart positional and long term levels
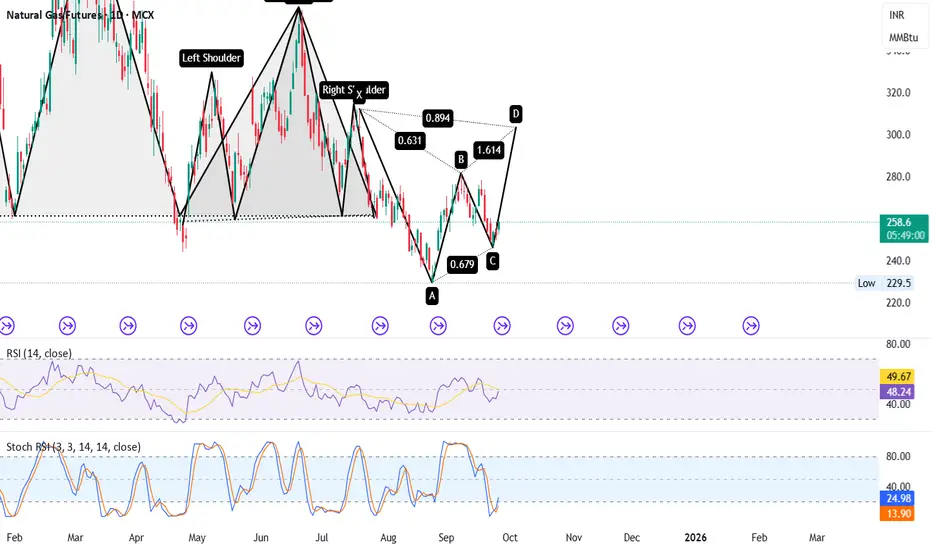
Natural Gas – Potential Bullish Reversal-304🔍 Key Highlights:
✅ XABCD Pattern Completion Zone:
XA to AB = 0.631 retracement
BC = 0.679 retracement
CD = 1.614 extension (projected move towards Point D)
✅ Bullish Structure in Progress:
Hidden Inverse Head & Shoulder supports bullish reversal
Confluence near Point C, increasing probability of trend reversal
✅ Momentum Confirmation:
RSI bouncing from neutral zone (47–49)
Stoch RSI reversing from oversold zone (13–23) – signaling early long buildup
🎯 Key Levels to Watch:
📈 Upside Target Zone (D): 1.614 extension zone
🛑 Invalidation: Break below recent Point C Low (229.5)
💡 Trading Insight:
This setup aligns with harmonic precision. If price holds the recent low and reverses with volume, Natural Gas may witness a strong upside bounce into the D leg completion.
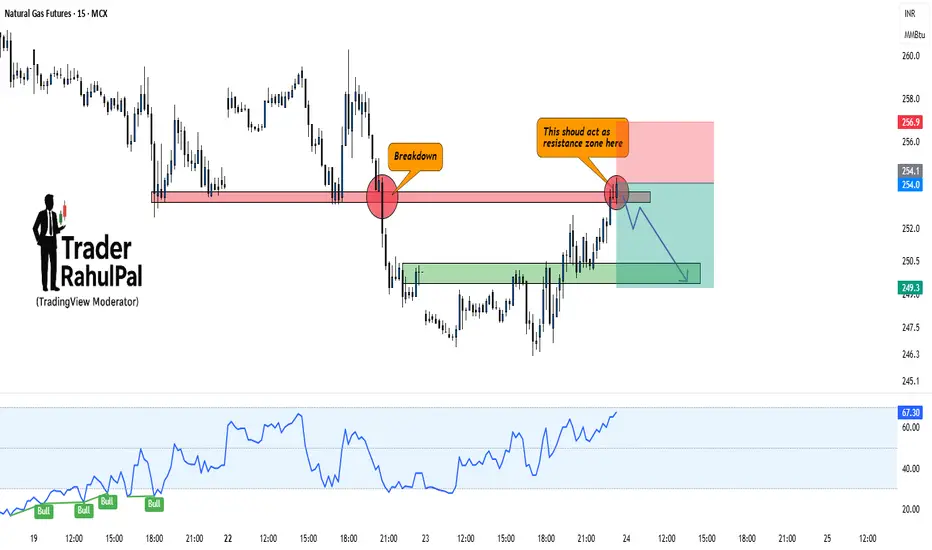
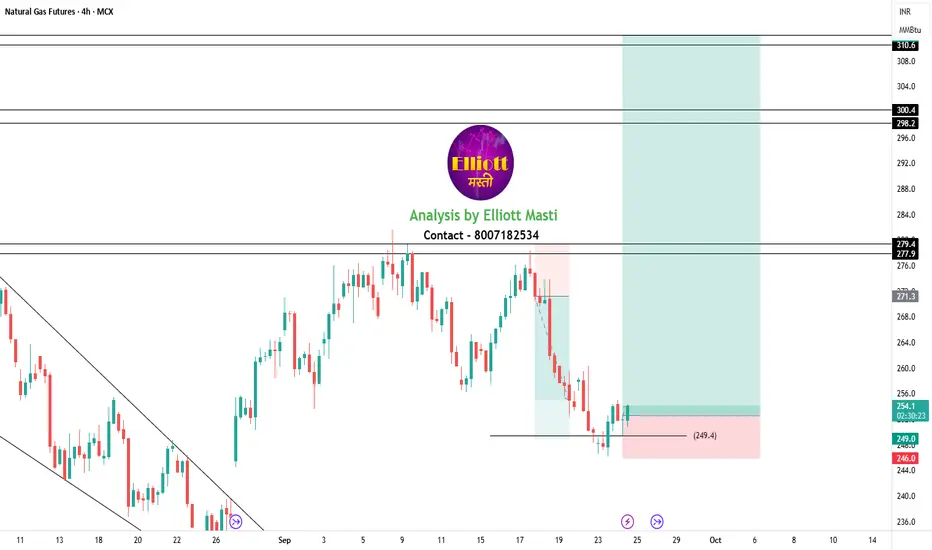
Natural Gas – Breakdown Retest Could Trigger Fresh FallHello everyone, Let's analyse Natural Gas and it has recently broken down from a key support level, turning it into resistance. The price is now retesting that zone, and unless bulls manage to reclaim it strongly, the downside remains the higher probability.
Current Setup:
Previous support around 254–256 has turned into a resistance zone.
Breakdown already confirmed with strong bearish candles.
RSI is still holding higher, but momentum may fade if resistance rejects.
Fresh downside targets can open toward 249–247 zone if rejection plays out.
Only a strong close above 257 will negate this bearish view.
Disclaimer: This analysis is for educational purposes only and should not be taken as financial advice. Please do your own research or consult your financial advisor before investing.
Analysis By @TraderRahulPal (TradingView Moderator) | More analysis & educational content on my profile
👉 If you found this helpful, don’t forget to like and follow for regular updates.
Natural Gas My last analysis about natural Gas was failed now it is in no trade zone , update you soon as I will see a trade opportunity.
Natural Gas longWe can plan natural Gas long position for a short term with very small Stoploss and small target
But risk reward ratio is high
Disclaimer; for education purpose only

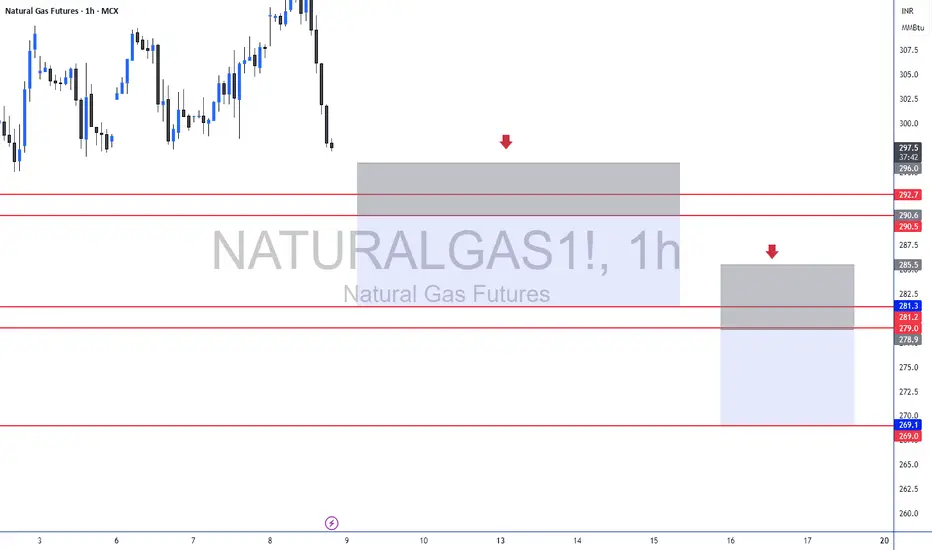
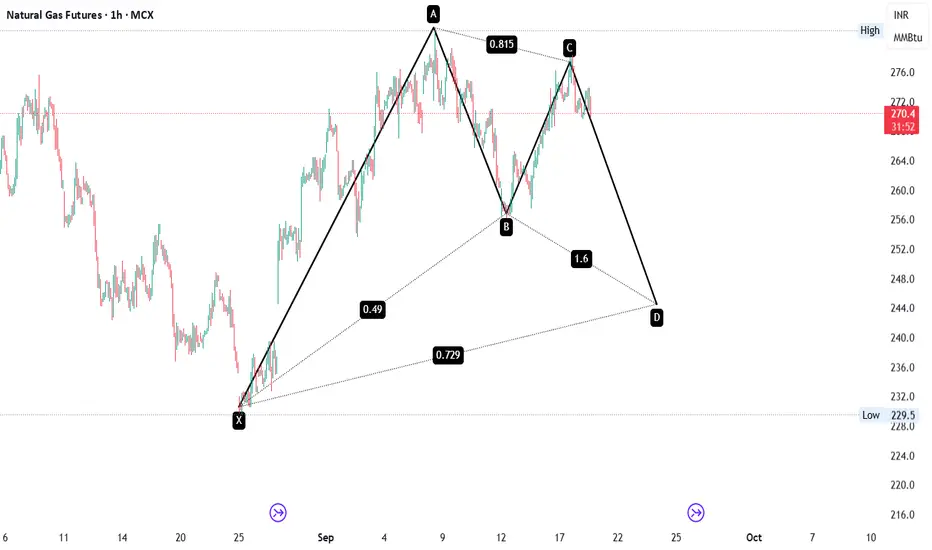
NATURAL GAS HARMONIC PATTERN
📈 Chart Pattern: Bearish Harmonic (Possibly Bearish Bat or Gartley Variant)
⚠️ Price Structure Breakdown:
A clean XABCD Harmonic Pattern is visible on the 1H timeframe:
🔹 XA Leg: Sharp impulsive rally from ₹229 → ₹281
🔹 AB Leg: Pullback retraced 49% of XA
🔹 BC Leg: Strong recovery to 81.5% of AB
🔹 CD Projection: 1.6x extension of BC, projecting a potential D point near ₹244–248 zone
📌 Key Technical Highlights:
✅ Pattern in play: Bearish harmonic indicating upcoming correction phase
🧲 D target zone aligns with previous demand cluster from late August
🔄 Ideal reversal zone between ₹244–248 (Watch for price-action confirmation near D)
🎯 Possible Trade Setup (Anticipated Post Completion at Point D):
📉 Sell NG Futures near ₹244–248 (on reversal confirmation)
🎯 Targets: ₹234 → ₹229
🛑 SL: Above ₹251 (on closing basis)
🧠 Why This Matters:
Harmonic patterns like this, especially with clean Fibonacci alignment, often mark high-probability reversal zones. Combined with volume + divergence filters, this zone could provide a lucrative swing trade setup.
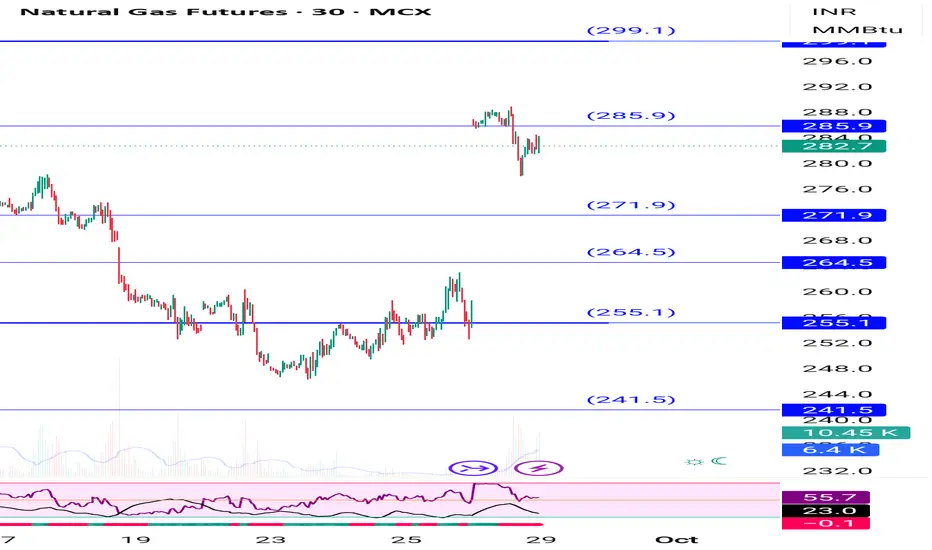
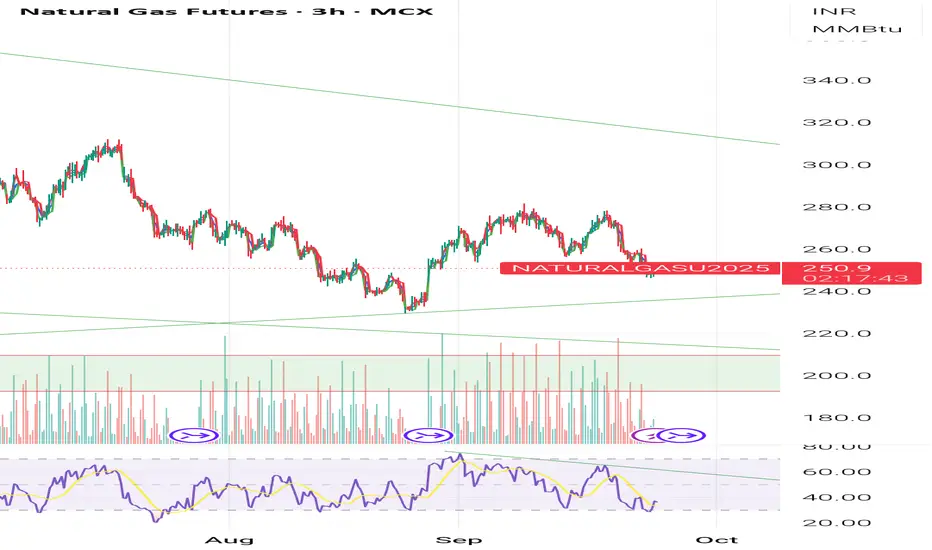
NATURALGAS1! 1D Time frame📍 Current Price
₹261
🔑 Key Levels
Immediate Resistance: ₹268 → ₹272
Immediate Support: ₹257 → ₹253
52-Week High: ₹366
52-Week Low: ₹188
Short-Term Outlook
Bullish Scenario: Sustained above ₹272 → possible move toward ₹280–₹285
Bearish Scenario: Falls below ₹257 → may test ₹253–₹250

NaturalGas BearishNaturalGas is taking resistance from Fibb 0.618 zone.
The RSI is also showing a hidden divergence with the price signalling further downside.
Close below 267.50 will take prices lower.
View neglected if prices moves above 285

Volume Profile & Market Structure AnalysisIntroduction
In modern financial markets, traders and investors rely on both price and volume to make informed decisions. While traditional technical analysis focuses heavily on price charts, patterns, and indicators, volume profile analysis introduces a powerful dimension: it shows not just where price has moved, but also where the most significant trading activity has occurred.
Markets are not simply a story of price fluctuations — they are a narrative of participation, commitment, and liquidity. By studying how much volume has traded at each price level, traders gain insights into which levels matter most to participants. This is where the volume profile becomes a key tool.
Coupled with market structure analysis — which identifies trends, ranges, supply-demand zones, and institutional footprints — traders can develop a deeper understanding of the underlying mechanics that drive market movement.
This guide explores the concepts of volume profile and market structure in detail, blending theory with practical application.
1. Understanding Volume in Trading
Volume represents the number of contracts, shares, or lots traded during a specific period.
High volume = Strong participation, more conviction.
Low volume = Weak participation, possible indecision.
Price movement alone can be deceptive. A rally with low volume may simply be speculative or driven by a few participants. Conversely, a rally with high volume suggests genuine market consensus and institutional interest.
Thus, when price is studied together with volume, we see where money is flowing in and out of the market.
2. What is Volume Profile?
Volume Profile is a charting tool that displays trading activity over a chosen time period at specified price levels. Unlike the typical volume indicator shown below price bars (which measures activity over time), volume profile shows how much volume was transacted at each price level.
It usually appears on the side of the chart as a histogram.
Key elements:
Point of Control (POC):
The price level with the highest traded volume. It’s often seen as the market’s “fair value.”
Value Area (VA):
The range where around 70% of trading activity occurred.
Value Area High (VAH): Top of the value range.
Value Area Low (VAL): Bottom of the value range.
High Volume Nodes (HVN):
Price zones where large amounts of trading took place — representing strong support/resistance.
Low Volume Nodes (LVN):
Price levels with little trading — often act as rejection zones where price moves quickly through.
In essence, volume profile reveals where participants are most interested in trading.
3. Why Volume Profile Matters
Identifies strong support/resistance: Prices with high volume tend to act as magnets.
Reveals institutional activity: Large players accumulate or distribute around high-volume zones.
Helps detect breakouts/fakeouts: If price moves away from a value area with volume, it’s often more sustainable.
Guides risk management: Stop-loss and target levels can be aligned with volume nodes.
For example, if the POC is at 15,000 in Nifty futures, traders know this is a strong pivot point. If price is above POC, bias is bullish; if below, bearish.
4. Building Blocks of Market Structure
While volume profile explains where participants are most active, market structure explains how the market moves.
Market structure refers to the repetitive patterns of price behavior, shaped by supply and demand imbalances.
a) Phases of Market Structure
Accumulation: Institutions build positions after a downtrend. Volume increases slowly.
Markup: Price trends upward, breaking resistance levels.
Distribution: Institutions unload holdings to late buyers at higher prices.
Markdown: Market declines as selling pressure outweighs demand.
b) Market Structure Basics
Higher Highs (HH) & Higher Lows (HL): Uptrend.
Lower Highs (LH) & Lower Lows (LL): Downtrend.
Equal Highs/Lows: Range or consolidation.
Traders map these swings to understand whether the market is bullish, bearish, or neutral.
5. Integrating Volume Profile with Market Structure
When combined, these two frameworks become powerful:
Trend confirmation: In an uptrend, high-volume nodes forming higher also confirm strong institutional support.
Range identification: A wide value area often signals consolidation.
Breakout validation: If price breaks above value area with high volume, chances of continuation are strong.
Liquidity hunts: Price may dip into low-volume nodes to trap traders before reversing.
Example: If Bank Nifty is making higher highs but each move is supported by rising POC levels, it confirms strength in the trend.
6. Practical Applications for Traders
a) Day Trading with Volume Profile
Identify intraday POC and VAH/VAL.
Trade rejections from value extremes (fade strategy).
Trade breakouts above VAH or below VAL with volume confirmation.
b) Swing Trading
Use weekly/monthly volume profiles.
Enter near HVNs (support zones) and exit near opposing HVNs.
Align swing trades with broader market structure (trend direction).
c) Position Trading
Focus on long-term volume profiles (quarterly/yearly).
Look for accumulation/distribution footprints of institutions.
Hold positions around POC shifts (where market’s fair value is migrating).
7. Volume Profile Strategies
Strategy 1: Value Area Rejection
If price moves above VAH but volume doesn’t confirm, expect a return back inside the value area.
Works best in range-bound markets.
Strategy 2: Value Area Breakout
If price breaks VAH/VAL with strong volume, trade in the breakout direction.
Works best in trending markets.
Strategy 3: POC Reversal
When price revisits the POC after a strong move, watch for reversal or continuation signals.
Strategy 4: Low-Volume Node Play
Price tends to move quickly across LVNs since there’s little resistance there.
8. Market Structure Strategies
Strategy 1: BOS (Break of Structure)
When price breaks a previous swing high in an uptrend → confirms continuation.
Strategy 2: CHoCH (Change of Character)
When price shifts from making HH/HL to LH/LL → signals reversal.
Strategy 3: Liquidity Grab
Market often sweeps previous highs/lows to trigger stop-losses before moving in the real direction.
Strategy 4: Supply/Demand Zones
Identify areas of sharp moves with high volume → strong institutional orders likely exist there.
9. Case Study Example (Nifty Futures)
Imagine Nifty is trading around 19,800.
Daily volume profile shows POC at 19,750.
VAH = 19,820, VAL = 19,700.
Scenario:
Price breaks above VAH with strong volume → continuation likely.
If it rejects above 19,820 and comes back inside → fade trade down to POC.
Market structure shows HH/HL → aligns with breakout trades.
Thus, both tools together offer context + execution clarity.
10. Psychological Edge of Volume Profile & Market Structure
Traders feel more confident when trades are backed by objective volume data rather than just subjective chart patterns.
Understanding market structure helps avoid emotional decisions by providing a map of price behavior.
Together, they reduce overtrading and improve patience by waiting for high-probability zones.
Conclusion
Volume Profile and Market Structure are two complementary tools that transform how traders view the market.
Volume Profile shows the hidden story of participation, liquidity, and fair value.
Market Structure provides the roadmap of how price evolves over time.
Together, they:
Identify high-probability trading zones.
Reveal institutional footprints.
Help traders avoid emotional decisions.
However, success lies not in the tools alone but in how consistently and patiently traders apply them with risk management. Over time, these methods can provide a decisive edge in understanding and navigating financial markets.
short natural gasNATURAL gas looks weak if breaks 230 then 160 possible .until u can play short upto 240 with sl of 275.

Natural gas - Matches the exact moves, posted on 24th AugNatural gas - Matches the exact moves, posted on 24th. August
Points gained- 229.5 to 264.8 = 35.3 points
1 Point = ₹1000 (35.3*1000= ₹35300.0)
Holding it, next is 300 & 320 target🎯
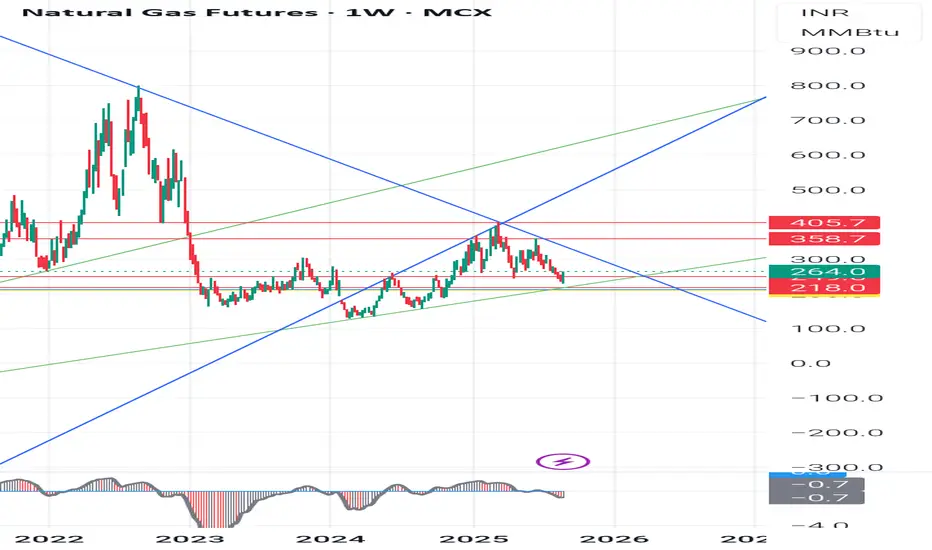
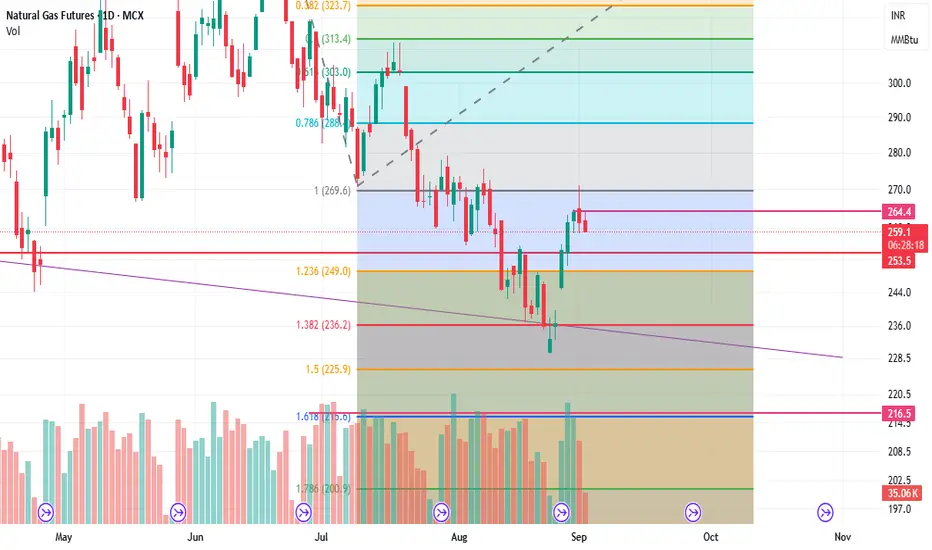
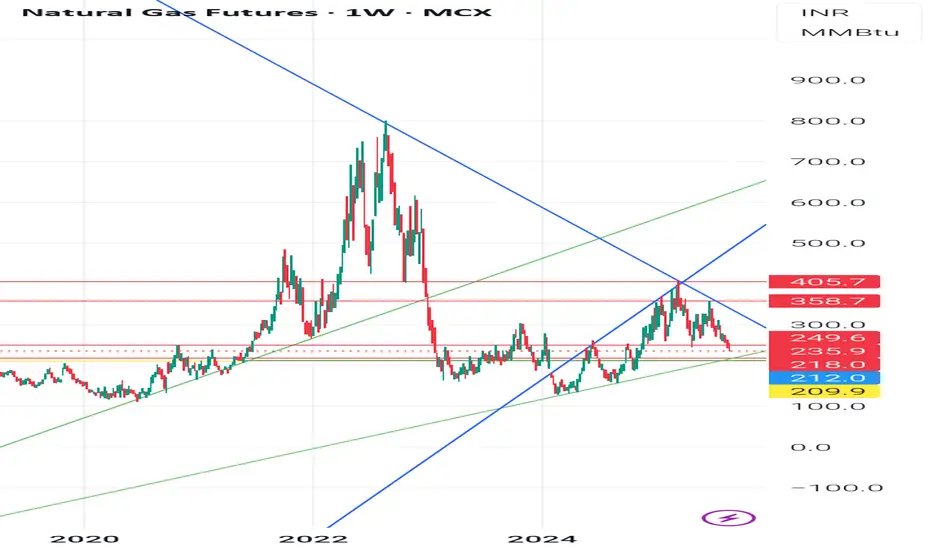
Natural Gas Futures (INR) Weekly Chart pattern analysisNatural Gas Futures (INR) Weekly Chart pattern analysis.
For the students, We will include chart structure, patterns, demand-supply zones, and precise support/resistance levels based on what is seen on the charts :
- Chart OverviewTimeframe: Weekly (1W)Current Price: 244.7 (down -5.30%)Price is near an important ascending trendline support (green line) after a strong correction from recent highs. Structure shows earlier breakout above descending trendline (blue) followed by a retest and rejection.
🧭 1. Trend Analysis- Long-Term Trend:From 2022 highs (900+), Natural Gas was in a sharp downtrend (blue descending trendline).Downtrend broke in late 2023, initiating a mid-term uptrend within an ascending channel.
Short-Term Trend:Since the 405.7 high (early 2025), prices are in a correction phase.Price now testing demand zone near 244-212.
📈 2. Chart Patterns,Ascending Channel: Price has been moving between parallel green lines since late 2023.Breakdown Risk: Price is testing the lower channel line; breakdown could trigger more downside.Head & Shoulders Possibility: The highs around 405-358 resemble a left shoulder-head-right shoulder formation, with neckline near 249-244. A confirmed break below could accelerate selling.
Supply Zone Rejection: Strong selling emerged from 358-405, marking it as a supply zone.
3. Key Technical Levels: Rejection Level: High Significance 405.7
-Major Supply 2025 high, strong rejection point 358.7
Secondary Supplying- Recent swing high before sell-off
249.6-244.7
- Current Zone - Channel support & neckline zone
218.0 - Demand Zone Past consolidation & buying interest
212.0 - Strong Support Historical demand zone floor
209.9
- Critical Support
If broken, opens path to 180-160⚖ 4. Demand & Supply ZonesDemand Zones:218-212 (weekly accumulation area)180-160 (last major base before rally)
Supply Zones:358-405 (heavy selling area)280-300 (minor supply if bounce occurs)
5. Possible ScenariosScenario
1 Support Holds:If 244-212 holds, expect a bounce towards 280 and 300.A close above 300 could re-test 358.
Scenario
2 - Breakdown:A close below 212 could lead to a quick drop towards 180-160.
👉 Disclaimer:
This is for educational purposes only, not trading advice. Futures & commodities are highly volatile; manage risk and consult a registered financial advisor.
#naturalgas #technicallevels #chartpatternabalysis #commoditytrading
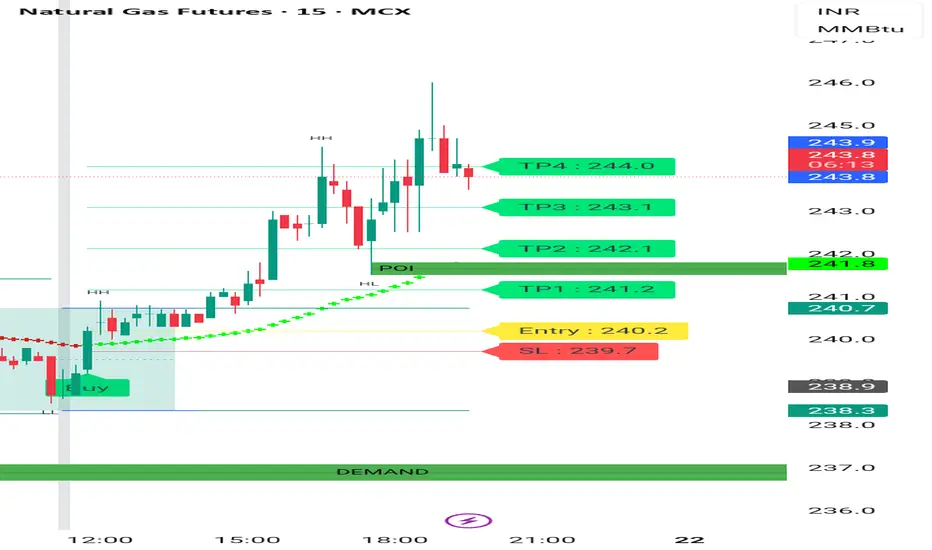
Natural gas 15 min Chart Natural gas 15 min Chart shows good strength. It's moving up with demand zone . Cmp 243. It may move further up . No buy sell Reccomendation. It's for educational purposes only. Consult your financial advisor before making any position in stock market. Stock market is risky .
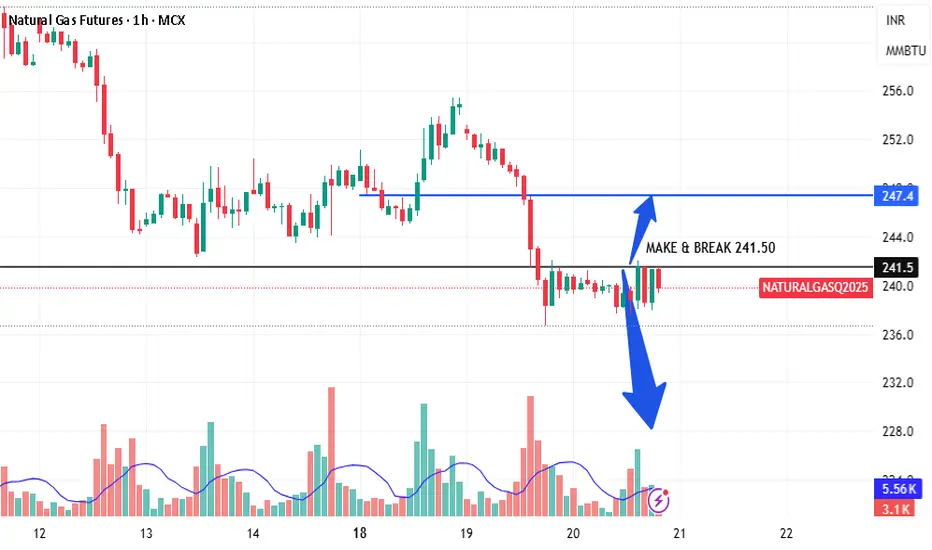
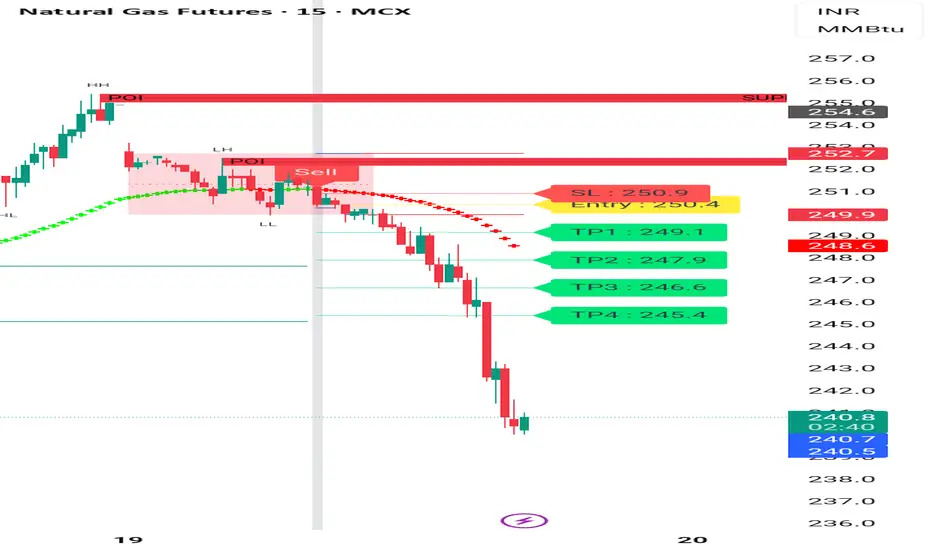
Ng shoryed with indicator at 250 . Now 240 Ng shoryed with indicator at 250 . Now 240 . natural followed our set up. And good opportunity to sell at 250 with set up .