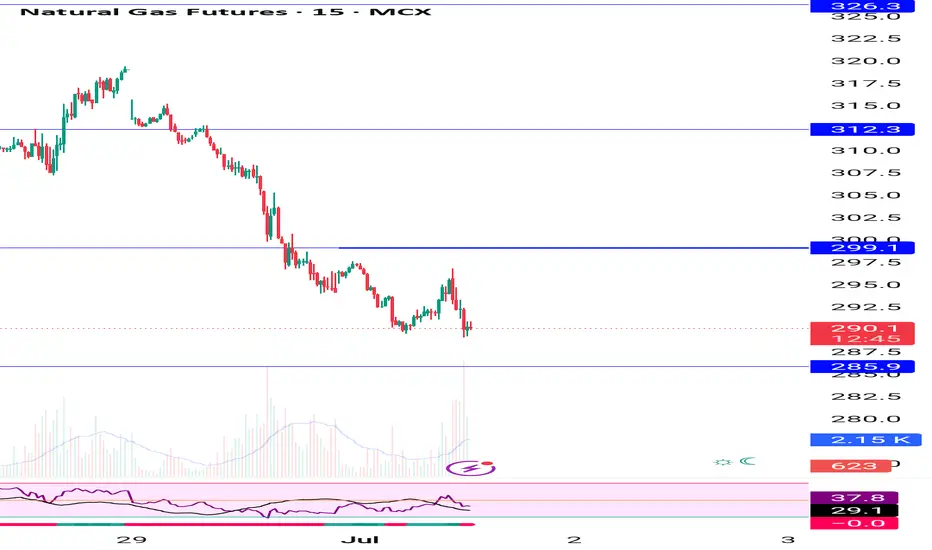
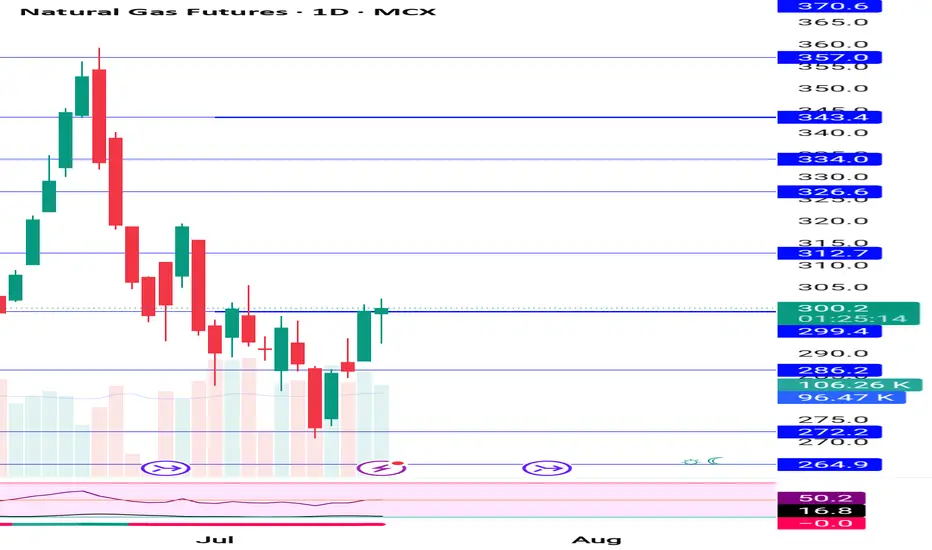
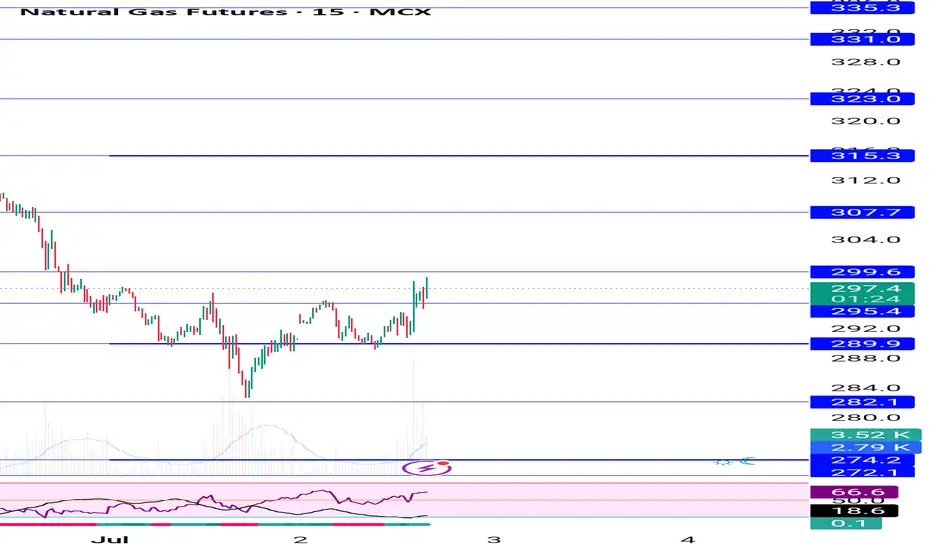
Natural gas buy given near 262-256 target 275 hit again support Natural gas buy given near 256 to 262 , upside target 275 hit , again at support area , avoid fresh buying until Trump and Putin meeting outcome not come both side big movement possible based on event.
Natural gas updated levels given on chart
Rate cuts geopolitical issues, tarrif will act both side move play safe , risk is high at current market scenario
PEH01F2026 trade ideas

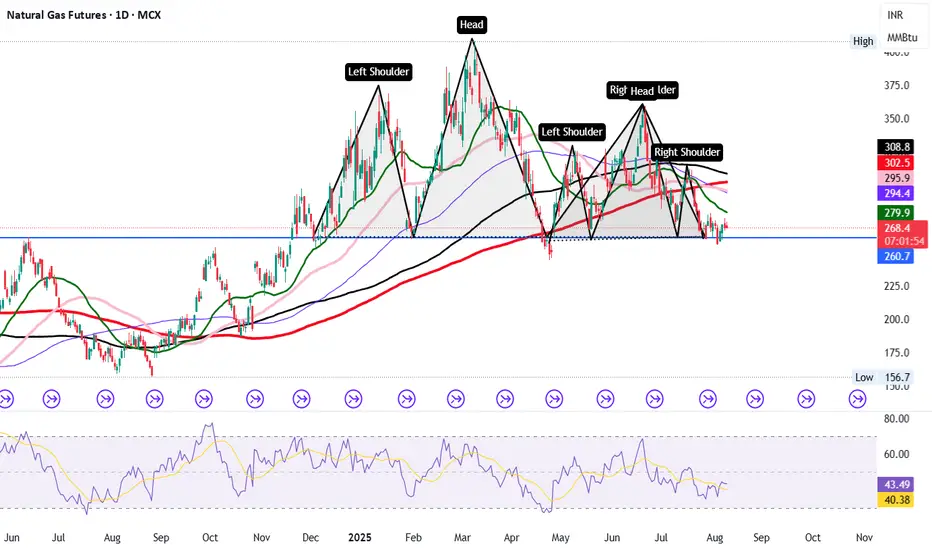
NATURAL GAS AT CRUCIAL BREAKDOWN ZONE – BE READY FOR A BIG MOVE!📉 Chart Pattern Alert: Double Head & Shoulders ✅
🧠 Technical Smart Zone: Multiple Head & Shoulder formations confirm serious structural weakness.
📌 Critical Breakdown Level:
👉 If Natural Gas breaks below ₹258, expect a sharp and extended downfall in coming sessions.
📊 Why This Matters:
Price action is struggling near neckline zone
RSI below 45 with no bullish divergence
Major SMAs are resisting from above
Long-term support zone has been tested multiple times
🚨 Below ₹258 = Panic Mode Activated
Targets: ₹250 → ₹242 → ₹230+ possible if selling pressure continues
💡 Professional Insight:
Pattern failures can lead to short-term bounces, but structure clearly favors sellers unless bulls reclaim ₹280+ quickly.
📍Stay updated with WHITEROCK levels for high-probability entries & exits.
🔔 Join us now — don’t trade blindly, trade informed.
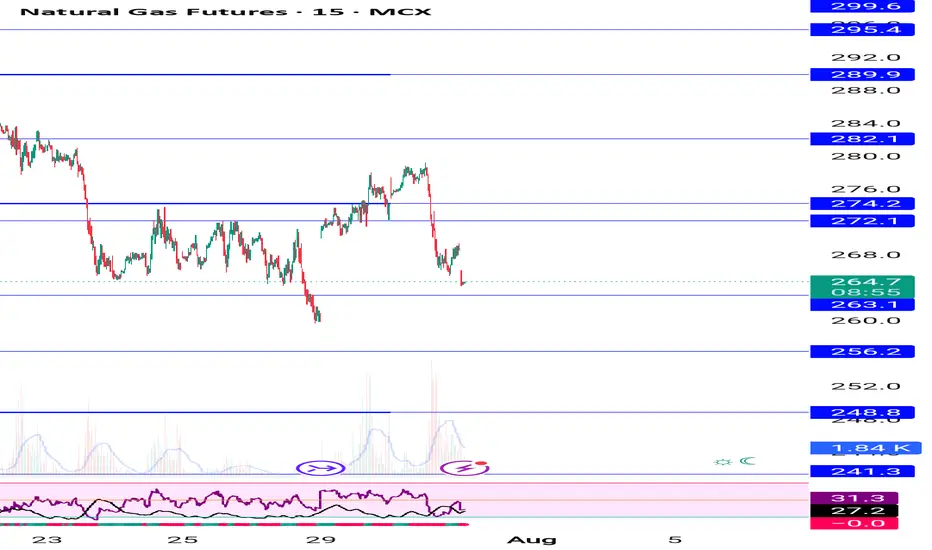
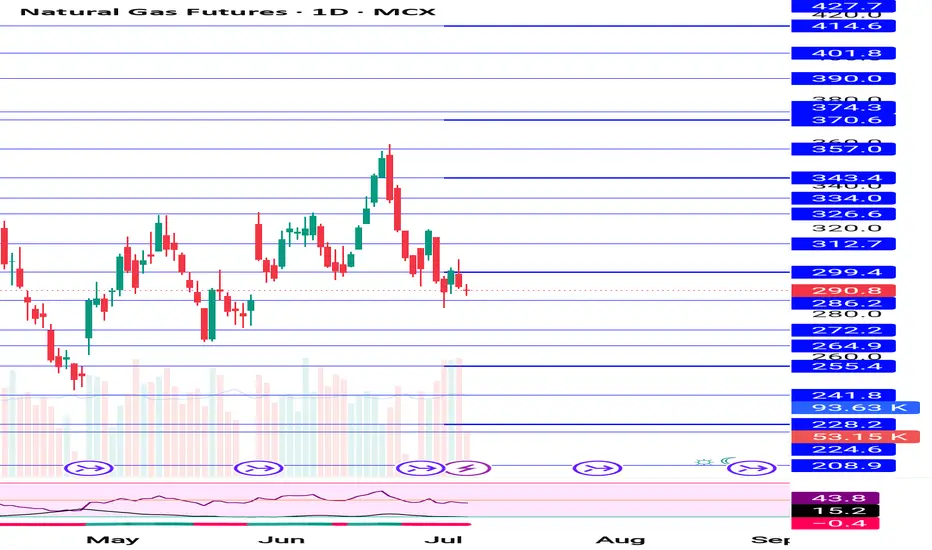
Natural gas as said earlier 262-256 support upside 268,275,281 Natural gas buy given near support 262-256 , upside target 268,275,281 .
Natural gas buy on dip from next month real economy demand will increase

Natural gas as said earlier 262-256 strong support area bounce As said earlier natural gas 262 to 256 strong support area bounce possible from that area bounce came start buying on dip
Updated levels given chart buy near support area

Natural gas 262-256 support area start buying again, positional Natural gas 262-256 strong support area again buy on dip upside target big , safe traders can sell puts at current price
Both side levels given on chart
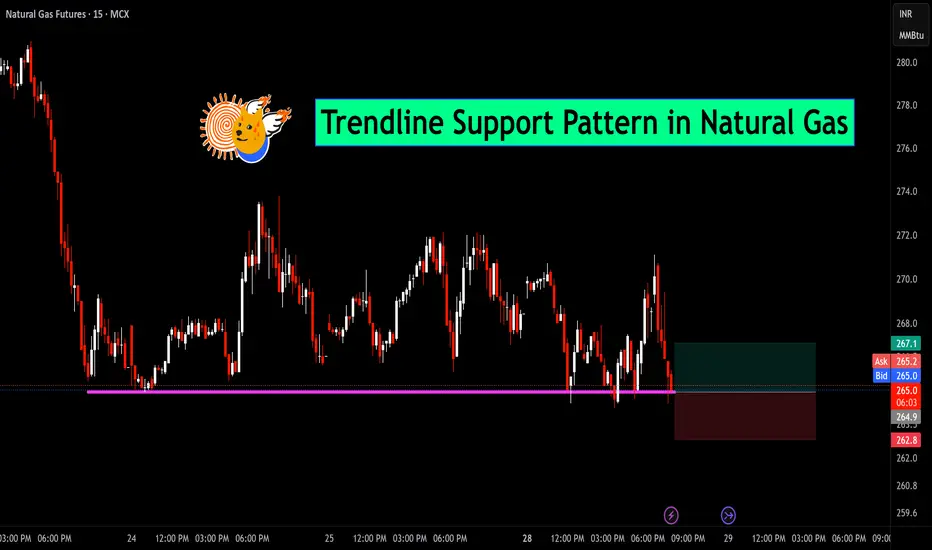
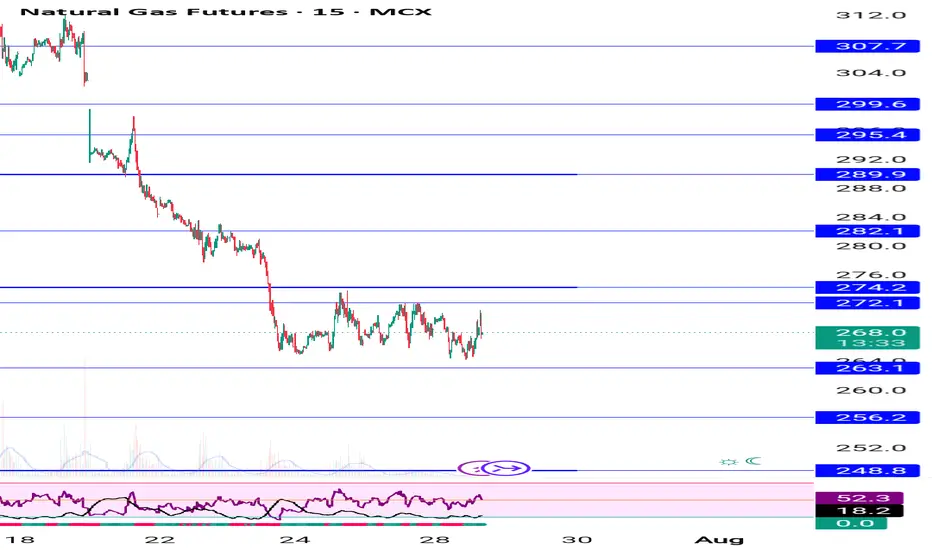
Trendline Support Pattern in Natural GasNatural Gas is currently respecting a well-established horizontal trendline support zone around the 264–265 level. As seen in the chart, price has tested this area multiple times, indicating strong demand and buyer interest at this zone.
📉 The recent candles show rejection from the support, suggesting a potential bounce. If this level continues to hold, we may see an upward move toward the 267–270 resistance area.
📌 Trade Idea:
Entry: Near 265.3
Stop-loss: Below 262.8 (structure break)
Target: 267.1 and above for short-term move
🧠 Watch for confirmation with volume or bullish candlestick formations before entering the trade.
Natural gas trying to make bottom if break 273 then upmove Natural gas buy on dip at current price, better to sell Put of August month habe 21-23 points premium if break 273 then upmove short covering will start avoid sell trade at current price
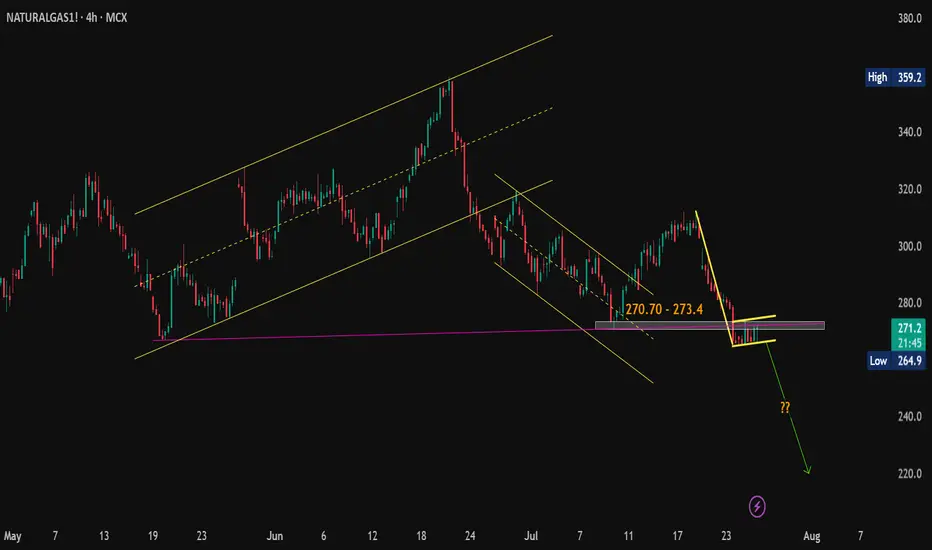
Natural Gas Technical Breakdown Ahead? Eyes on the 264.90 Mark#Commodity
#NaturalGas View:
CMP: 271.70
🔹 Resistance Levels:
• 270.70 – 273.40
• 275.00
• 284.00
🔹 Support Level:
• 264.90
Technical View:
Natural Gas seems to be forming a bearish flag pattern on the hourly & 4 hours chart. The price is currently facing resistance at the pink trendline breakdown level. While it's still early for confirmation, a decisive hourly close below 264.90 may validate the pattern and open the door for further downside. If the pattern plays out, a possible target zone around 220 could be in sight.
📌 Note: This is a technical analysis view shared for educational purposes only and not a recommendation to buy/sell. Always consult your financial advisor before making any trading decisions.
#Commodity | #NaturalGas | #MCX | #PriceAction
Breakdown and retest completedNatgas has completed the retest and not able to move past the resistance with day 3 hanging man pattern. Next leg of movement is to 260-265, the next support lvl.
Buy NAT GAS Natural gas at weak support zone. 273-275 buy once 15 min candle above the price.
Target - 280,285,290,300
Natural gas we booked profit at 311, wait for dip near 294-292How My Harmonic pattern projection Indicator work is explained below :
Recent High or Low :
D-0% is our recent low or high
Profit booking zone: D13% -D15% is
range if break them profit booking start on uptrend or downtrend but only profit booking, trend not changed
SL reversal zone : SL 23% and SL 25% is reversal zone if break then trend reverse and we can take reverse trade
Target : T1, T2, T3, T4 and .
Are our Target zone

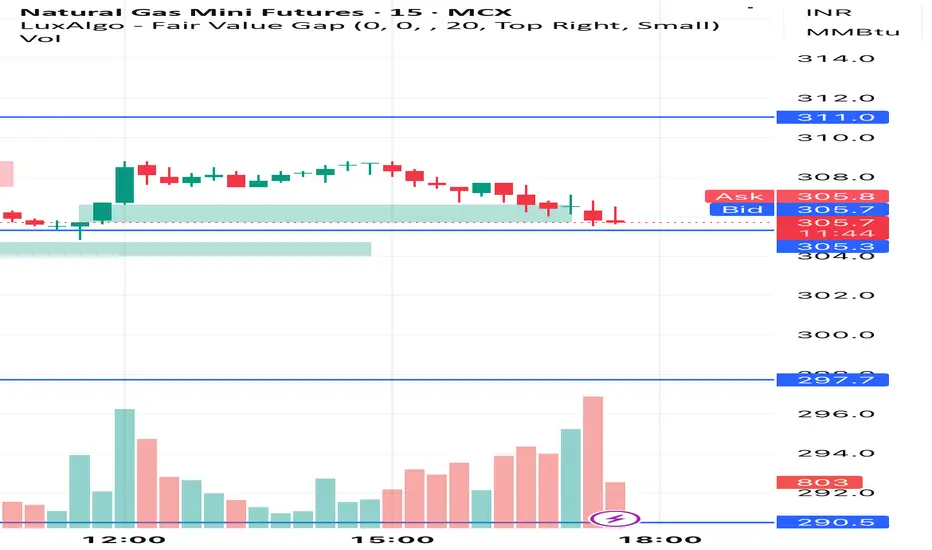
NATGAS OPTION ALERT🔥 NATGAS OPTION ALERT 🔥
✅ Buy 330CE @ ₹3.45–₹4.00
🎯 Targets: ₹7 / ₹12 / ₹15
🛑 SL: ₹2.00
📍 NG Spot: ₹308–₹310
📊 Volume pickup above ₹310 = Momentum Confirmed
🧠 Trail SL after ₹6 hit
Risk: ₹1,875 per lot
Reward: ₹7K–₹14K per lot
📅 Watch till 7PM (US open) for breakout
🚨 Book partial at ₹7 and ride the rest
Natural gas 312 target hit today holding buy from 282 buy on dipHow My Harmonic pattern projection Indicator work is explained below :
Recent High or Low :
D-0% is our recent low or high
Profit booking zone: D13% -D15% is
range if break them profit booking start on uptrend or downtrend but only profit booking, trend not changed
SL reversal zone : SL 23% and SL 25% is reversal zone if break then trend reverse and we can take reverse trade
Target : T1, T2, T3, T4 and .
Are our Target zone

Natural gas continuesly buying at 882 , 312, 320 target How My Harmonic pattern projection Indicator work is explained below :
Recent High or Low :
D-0% is our recent low or high
Profit booking zone: D13% -D15% is
range if break them profit booking start on uptrend or downtrend but only profit booking, trend not changed
SL reversal zone : SL 23% and SL 25% is reversal zone if break then trend reverse and we can take reverse trade
Target : T1, T2, T3, T4 and .
Are our Target zone
Natural gas buy on dip near recent low 274-272 we r holding buyHow My Harmonic pattern projection Indicator work is explained below :
Recent High or Low :
D-0% is our recent low or high
Profit booking zone: D13% -D15% is
range if break them profit booking start on uptrend or downtrend but only profit booking, trend not changed
SL reversal zone : SL 23% and SL 25% is reversal zone if break then trend reverse and we can take reverse trade
Target : T1, T2, T3, T4 and .
Are our Target zone

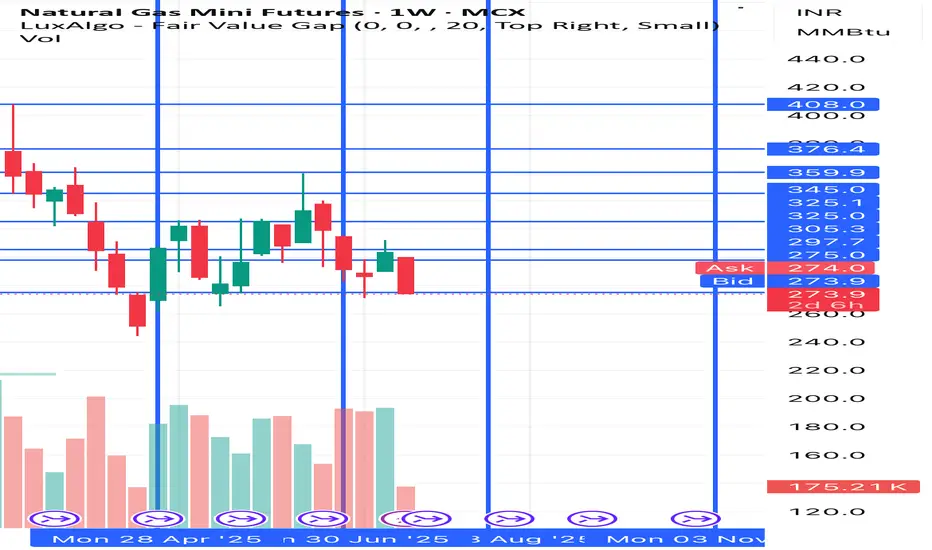
Natural Gas Mcx Good area to accumulate fresh enter is in demand area close to 260 . consolidating in symmetrical triangle formation after breakout .expect a move back towards 410-415 level then towards 600 level with weekly closing support 250 .If weekly start closing below 250 this view will fail .Expected a move towards 600 up to march -26 and 415 by September or October this year . this is my study i might be wrong to .

Natural gas holding buy from 278 avg cost, target 291,300,312How My Harmonic pattern projection Indicator work is explained below :
Recent High or Low :
D-0% is our recent low or high
Profit booking zone: D13% -D15% is
range if break them profit booking start on uptrend or downtrend but only profit booking, trend not changed
SL reversal zone : SL 23% and SL 25% is reversal zone if break then trend reverse and we can take reverse trade
Target : T1, T2, T3, T4 and .
Are our Target zone

Natural gas below 288 to 280 buying 300,312,320 target SL 273How My Harmonic pattern projection Indicator work is explained below :
Recent High or Low :
D-0% is our recent low or high
Profit booking zone: D13% -D15% is
range if break them profit booking start on uptrend or downtrend but only profit booking, trend not changed
SL reversal zone : SL 23% and SL 25% is reversal zone if break then trend reverse and we can take reverse trade
Target : T1, T2, T3, T4 and .
Are our Target zone

Natural gas updated levels buy on dip near support,How My Harmonic pattern projection Indicator work is explained below :
Recent High or Low :
D-0% is our recent low or high
Profit booking zone: D13% -D15% is
range if break them profit booking start on uptrend or downtrend but only profit booking, trend not changed
SL reversal zone : SL 23% and SL 25% is reversal zone if break then trend reverse and we can take reverse trade
Target : T1, T2, T3, T4 and .
Are our Target zone
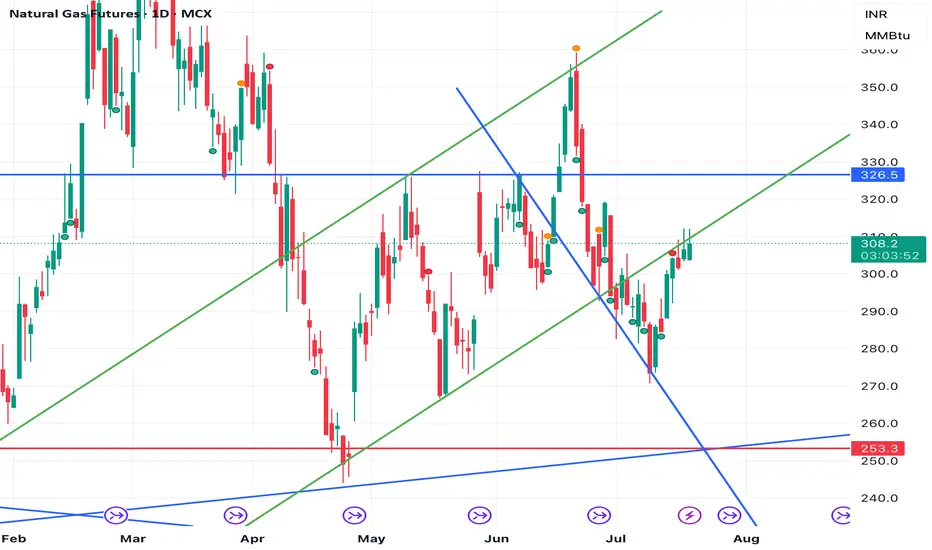
Natural GasThis chart analysis is for educational purposes only.
Natural Gas is reversing from the channel bottom, marked by a strong bullish candle, and is anticipated to continue its upward momentum with high probability.

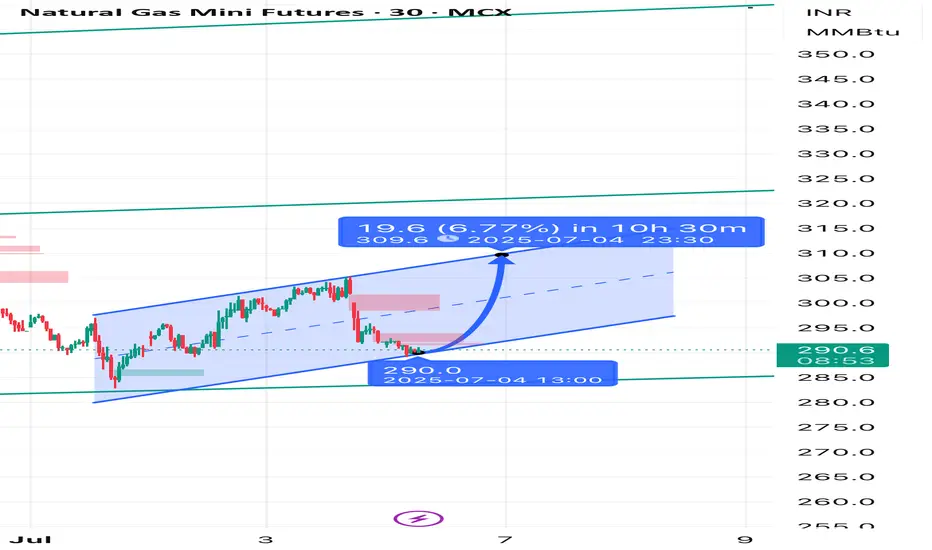
Natgas buy Your Natural Gas trade setup is:
• Buy @ 290
• Stop Loss (SL) @ 288
• Targets:
✅ Target 1: 310
✅ Target 2: 320
✅ Target 3: 330
Risk-Reward Analysis:
• Risk per unit: 290 - 288 = ₹2
• Reward (first target): 310 - 290 = ₹20
• Risk:Reward Ratio (Target 1) = 1:10 — very favorable.
⸻
Trade Management Tips:
1. Trail SL:
Once price crosses 300, trail your SL to 292 or cost price.
2. Book Partial Profits:
Book 50% at 310, 25% at 320, and let the rest ride till 330.
3. Watch News:
Keep an eye on U.S. EIA storage data or weather updates—both impact Natural Gas prices heavily.
Natural gas buy given at 288-289 enjoy good profit levels @chartHow My Harmonic pattern projection Indicator work is explained below :
Recent High or Low :
D-0% is our recent low or high
Profit booking zone: D13% -D15% is
range if break them profit booking start on uptrend or downtrend but only profit booking, trend not changed
SL reversal zone : SL 23% and SL 25% is reversal zone if break then trend reverse and we can take reverse trade
Target : T1, T2, T3, T4 and .
Are our Target zone
Natural gas now comes at buying area 288-89 , down from 319How My Harmonic pattern projection Indicator work is explained below :
Recent High or Low :
D-0% is our recent low or high
Profit booking zone: D13% -D15% is
range if break them profit booking start on uptrend or downtrend but only profit booking, trend not changed
SL reversal zone : SL 23% and SL 25% is reversal zone if break then trend reverse and we can take reverse trade
Target : T1, T2, T3, T4 and .
Are our Target zone