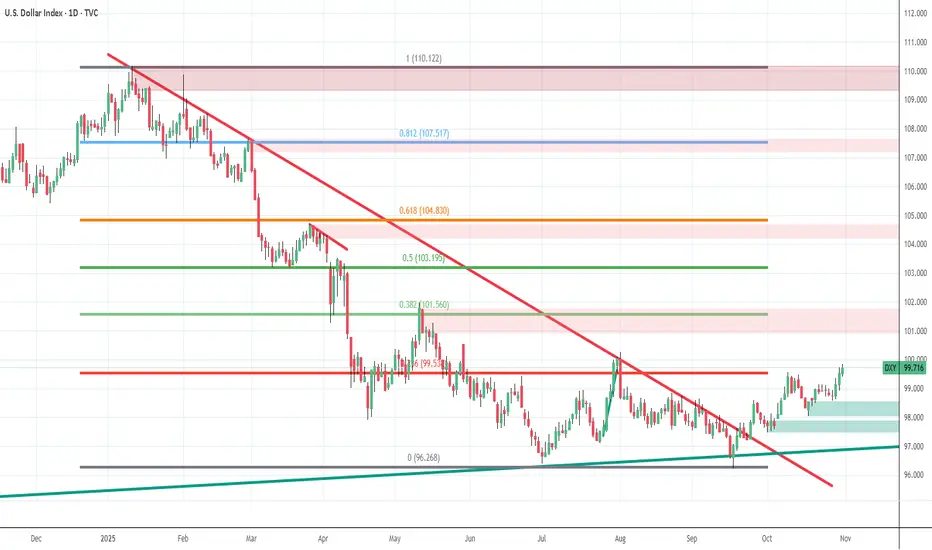
$ Index - view and analysis$ Indec has clearly taken monthly month trend line support and slowly moving up.
Its could be just technical move and i am not aware of any reason for US dollar and this index to move up. Only solution for US Govt to stop shut down is only lifting limit and print more fiat currency. After the news
Related indices

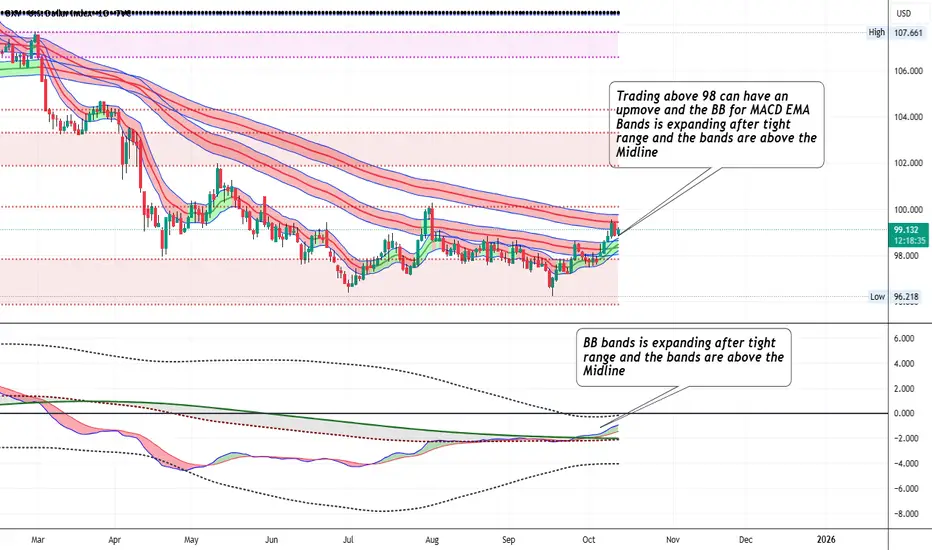
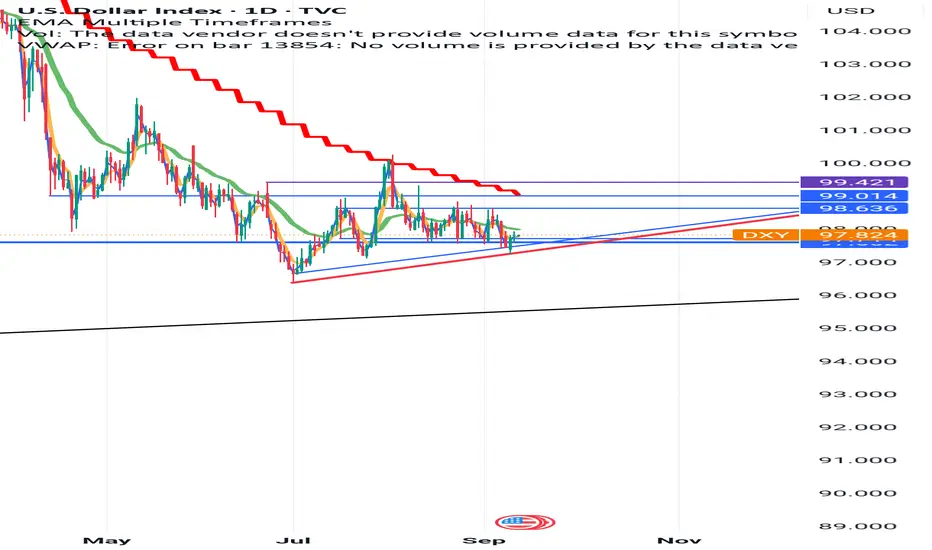
DXY - Trading above 98 can have an upmoveTrading above 98 can have an upmove and the BB for MACD EMA Bands is expanding after tight range and the bands are above the Midline
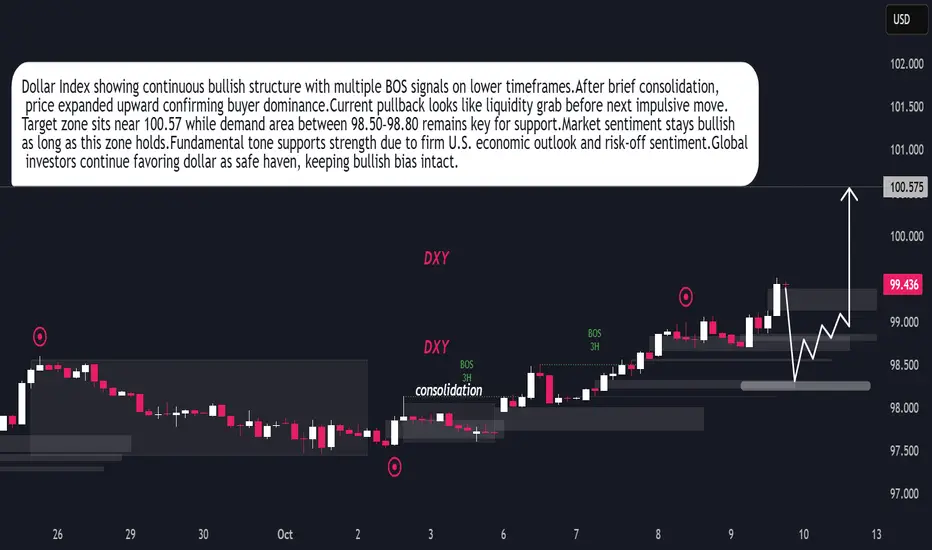
DXY Ready for Next Bullish Leg After Liquidity SweepDollar Index maintaining bullish structure after recent BOS on 3H timeframe.Market formed consolidation phase early October before expansion.Buyers showing control pushing price towards 100.57 objective.Current retracement indicates liquidity grab before next bullish impulse.Demand zone 98.50–98.80
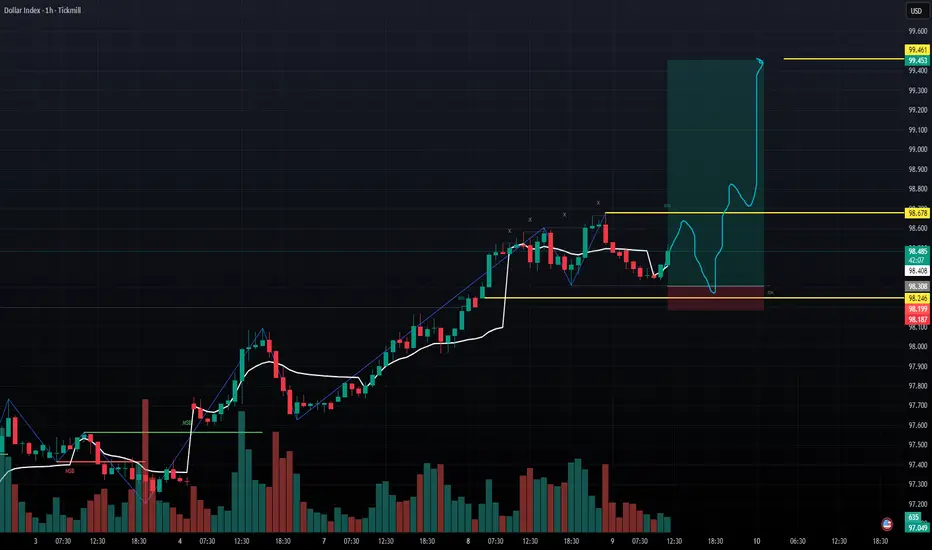
dollar index is showing strengthif go with dollar as seen in chart it is taking support from its bullish order block of the structure and liquidity sweep is pending if it takes liquidity and sweep the early buyers it has potential to hit the target with in 24 hours .
The Dollar’s Journey💵 The Dollar’s Journey – From Blastoff to Pause, and Maybe… Another Run?
Back in May 2021 , the Dollar Index (DXY) quietly started climbing. At first, nobody gave it much thought. But then 🚀 it took off—running from 89 to 114 in just over a year. That’s what traders call a parabolic move —fast,

DXY/GOLD RATIO ANALYSIS The DXY/Gold ratio has been in a persistent downtrend, now testing deep lows. Momentum shows early signs of stabilizing, with RSI near oversold and MACD flattening.
⚖️ A rebound here could mean relative strength shifting back toward the Dollar over Gold. Keep an eye on follow-through.

U.S DOLLAR INDEX ANALYSIS Today fed meeting I hope ( $ 95’28 ) break this support and gona down . Let see how to market react in all trader 🤔.

Bullish This chart is clear cut described dxy movement is ready for reversal
If this structure continue,we can see sharp fall in bullion
This chart is only for learning purpose
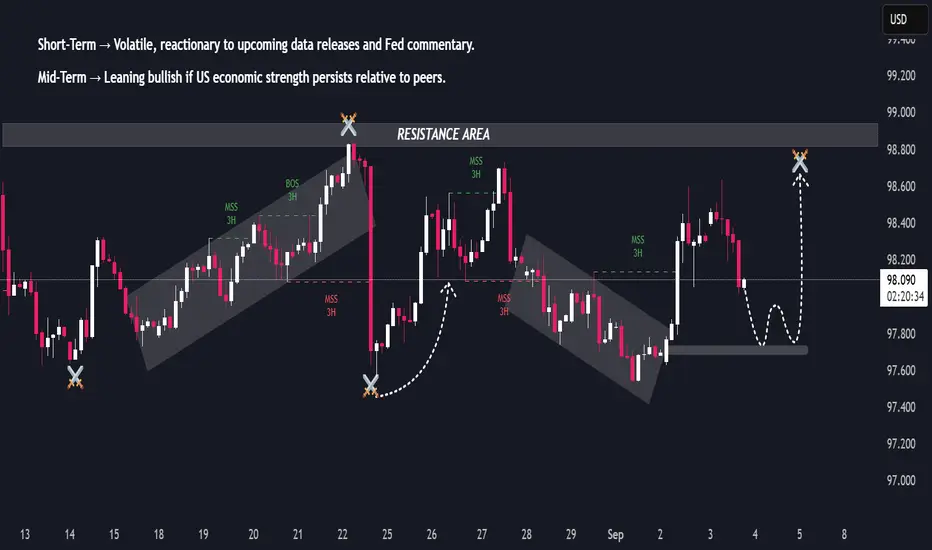
DXY Outlook: Volatility Dominates as Fed Uncertainty PersistsDXY Outlook: Volatility Dominates as Fed Uncertainty Persists
DXY (US Dollar Index) Analysis Report
🔎 Technical Outlook
The index recently moved in a clear upward cycle, followed by a sharp rejection, highlighting the market’s sensitivity to macro shifts.
Price action has transitioned into volati
See all ideas
Summarizing what the indicators are suggesting.
Oscillators
Neutral
SellBuy
Strong sellStrong buy
Strong sellSellNeutralBuyStrong buy
Oscillators
Neutral
SellBuy
Strong sellStrong buy
Strong sellSellNeutralBuyStrong buy
Summary
Neutral
SellBuy
Strong sellStrong buy
Strong sellSellNeutralBuyStrong buy
Summary
Neutral
SellBuy
Strong sellStrong buy
Strong sellSellNeutralBuyStrong buy
Summary
Neutral
SellBuy
Strong sellStrong buy
Strong sellSellNeutralBuyStrong buy
Moving Averages
Neutral
SellBuy
Strong sellStrong buy
Strong sellSellNeutralBuyStrong buy
Moving Averages
Neutral
SellBuy
Strong sellStrong buy
Strong sellSellNeutralBuyStrong buy
Displays a symbol's price movements over previous years to identify recurring trends.
Frequently Asked Questions
The current value of U.S. Dollar Currency Index is 99.807 USD — it has risen by 0.04% in the past 24 hours. Track the index more closely on the U.S. Dollar Currency Index chart.
U.S. Dollar Currency Index reached its highest quote on Nov 8, 1985 — 129.670 USD. See more data on the U.S. Dollar Currency Index chart.
The lowest ever quote of U.S. Dollar Currency Index is 70.698 USD. It was reached on Mar 17, 2008. See more data on the U.S. Dollar Currency Index chart.
U.S. Dollar Currency Index value has increased by 0.92% in the past week, since last month it has shown a 1.95% increase, and over the year it's decreased by −4.32%. Keep track of all changes on the U.S. Dollar Currency Index chart.
U.S. Dollar Currency Index is just a number that lets you track performance of the instruments comprising the index, so you can't invest in it directly. But you can buy U.S. Dollar Currency Index futures or funds or invest in its components.