$INJ Is Repeating the 2021 Fractal: The Next 4,000% Move?CRYPTOCAP:INJ Is Repeating the 2021 Fractal: The Next 4,000% Move?
2021 Cycle Pattern:
🔹 Impulse: $0.65 → $25
🔹 Corrective Phase: -95% → $1.12
🔹 Expansion: +4,500% → $53 ATH
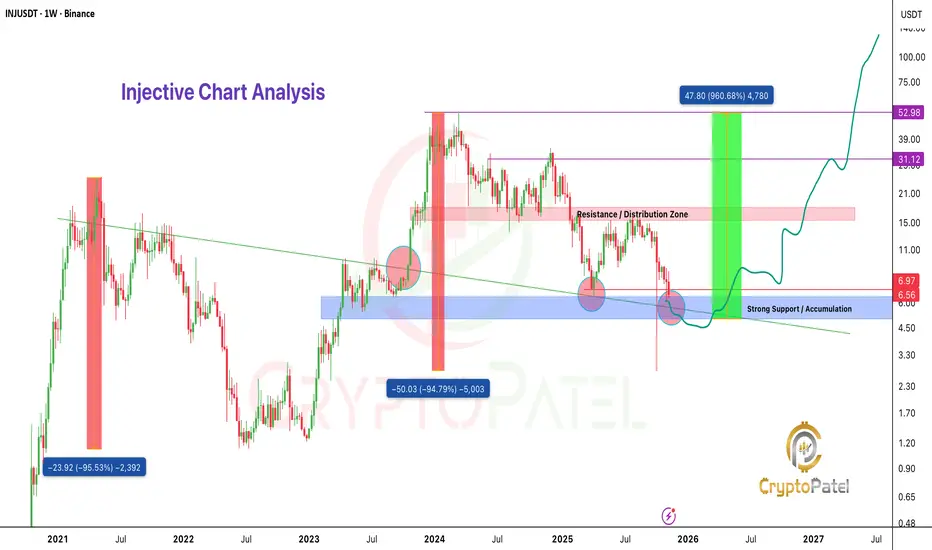
2024 Structure Mirrors 2021:
🔹 Impulse: $7 → $53
🔹 Corrective Phase: -94% → $2.74
🔹 Price now sitting inside historical Post-Cycle Reaccumulation Zone.
Accumulation Zone: $6–$4
Upside Targets: $15 / $30 / $50 / $70 (HTF liquidity clusters)
Invalidation: Break of structural low based on individual risk.
If 2021 fractal continues to play out, CRYPTOCAP:INJ is entering its highest-probability expansion window.
NFA & DYOR
Market insights
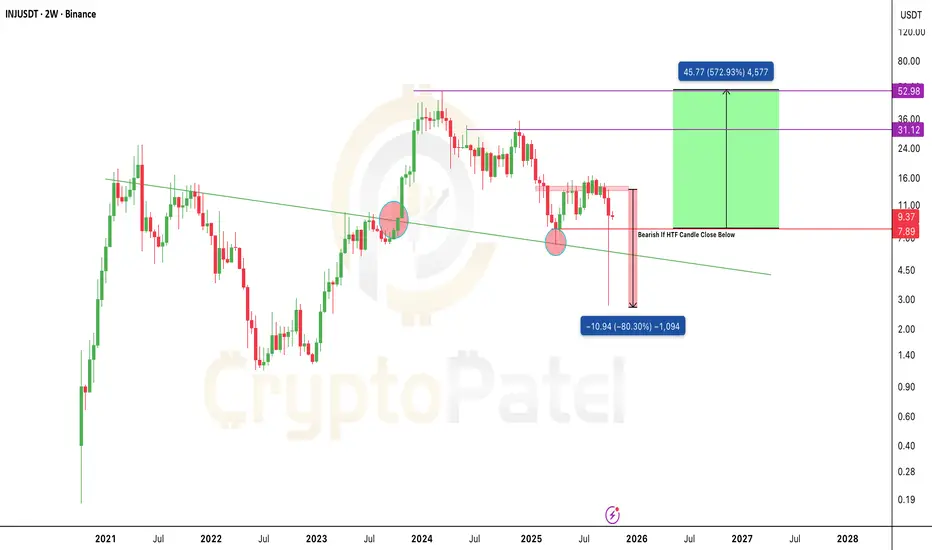
INJ/USDT Bullish Chart analysis and Potential $50 in future?CRYPTOCAP:INJ crashed nearly 80% after Trump’s 100% tariff announcement on China, few caught that insane dip below $3.
But here’s the thing, price is still holding strong above $7.8 support on HTF, meaning bulls aren’t done yet.
Accumulation Zone: $9–$7
Targets: $20 / $35 / $50
If CRYPTOCAP:INJ breaks out again, this could be one of the most explosive comebacks of the cycle.
NFA & DYOR
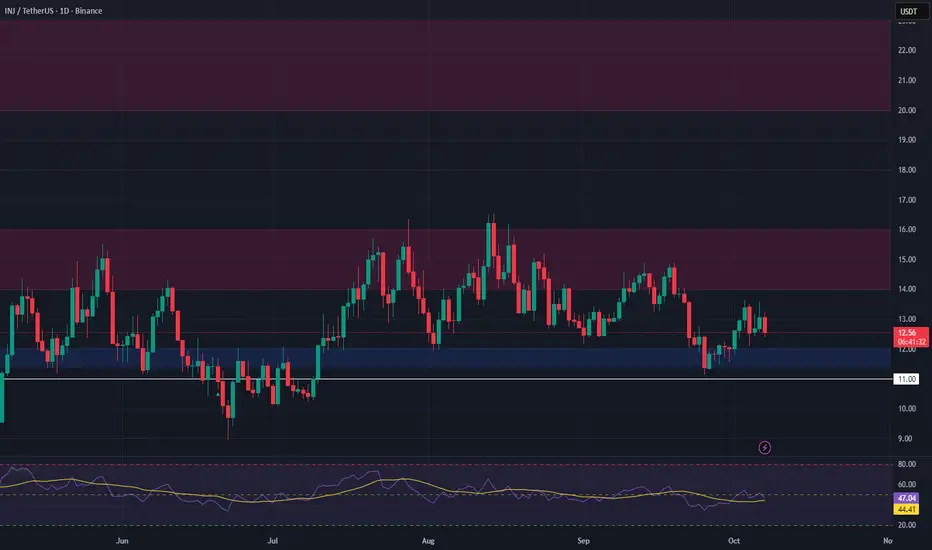
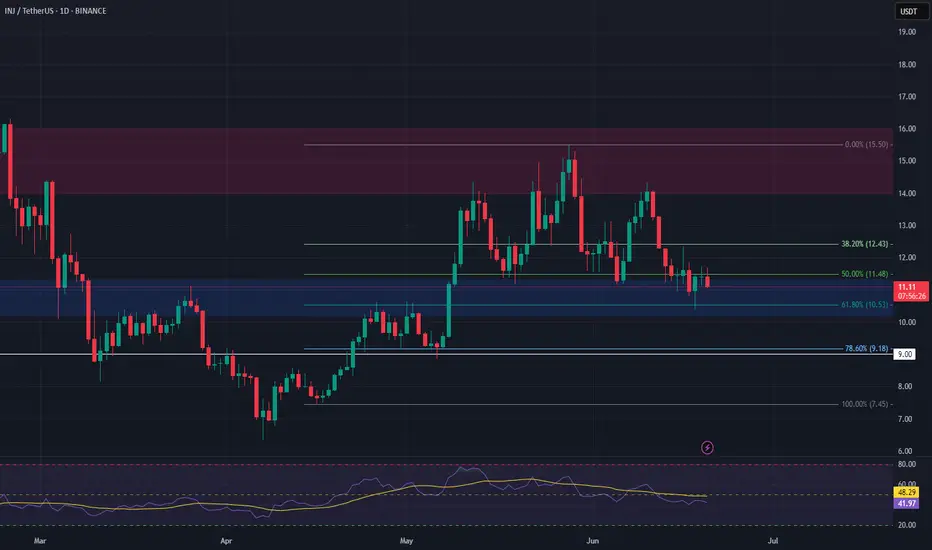
INJ Spot Trade Setup – Waiting for PullbackINJ has been rejected at resistance, and we are now watching for a pullback into the $11.40 – $12.00 support zone. This level has acted as a strong support area in the past and may offer a good entry point for a long spot position.
🔹 Entry Zone: $11.40 – $12.00
🔹 Take Profit Targets:
• TP1: $14.00 – $16.00
• TP2: $20.00 – $23.00
🔹 Stop Loss: Below $11.00 (conservative SL placement)

#INJ Possible Short Setup With Potential Reversal Area#INJ Is Also Bearish And Can Crash Till Our Reversal Area, We Can See A Massive Red Candle Towards Our Marked Reversal Area And Then A Big Green Candle On From Our Reversal Area.
Disclaimer -: This Is Not A Trade And Not A Financial Advise, We Are Not Responsible For Any Loss And Profit You Made, This Is Just An Idea
INJ Long Swing Setup – Approaching Fibonacci & Major SupportInjective (INJ) is nearing a key support zone that aligns with the 61.8% Fibonacci retracement level. This confluence area around $10.20–$11.30 offers a strong setup for a potential long swing trade.
📌 Trade Setup:
• Entry Zone: $10.20 – $11.30
• Take Profit Targets:
o 🥇 $14.00 – $16.00
o 🥈 $20.00 – $23.00
• Stop Loss: Daily close below $9.00
Forecast for Long Term for INJUSDT -- Current Market Overview --
Price (as of May 28, 2025): INJ/USDT is trading at approximately $15.01, with a 24-hour increase of 4.93–10.79% and a weekly gain of 23.1–24.94%.
# Market Sentiment: Recent Wave indicate bullish sentiment, with analysts noting a breakout from a monthly demand zone and support at a weekly fair value gap (iFVG). The price has broken a higher-time-frame (HTF) downtrend, suggesting potential for further upside.
Market Cap and Volume: INJ has a market cap of $1.5B and a 24-hour trading volume of $218.9M, reflecting strong liquidity and interest.
-- Technical Analysis --
Price Action and Key Levels
# Support: The price recently found support at the $9.32–$10.00 demand zone, with a low of $6.5 in the past six months. The weekly iFVG and monthly demand zone around $10–$11 have held, acting as strong support.
Resistance: Key resistance levels are at $16.13 (short-term), $20–$25 (weekly target), and $33 (top of a multi-year descending wedge). A break above $16.13 could signal a mid-term swing toward $48.
Price Structure: INJ is in a bullish phase, having broken out from a descending wedge on the weekly chart and reclaiming the 21-day EMA. The price is trading above the 50-day SMA ($10.02) and 200-day SMA ($14.03 projected for June), indicating bullish momentum.
-- Disclaimer --
This analysis is based on recent technical data and market sentiment from web sources. It is for informational purposes only and not financial advice. Trading involves high risks, and past performance does not guarantee future results. Always conduct your own research or consult a SEBI-registered advisor before trading.
Boost and comment will be highly appreciated

INJ 5th wave weekly chartINJ seems to move in the 5th wave of its weekly chart, it has good momemtum against all altcoins in the list comparing to Bitcoin also

Major Move Coming for INJUSD: Will You Be Ready?Yello, traders! Are you ready for what could be a significant shift in INJUSDT's trajectory? Let’s dive into the details:
💎INJUSDT has shown an Internal Change of Character (I-CHoCH), taken inducement, and then formed a W pattern from the support zone, which increases the likelihood of this pattern playing out.
💎If INJ breaks above the resistance zone, it will validate the W pattern, and we can anticipate a strong bullish move.
💎In the event of a pullback, we might see a bounce from the support zone. However, it's wise to wait for an I-CHoCH confirmation on a lower time frame to be sure.
💎If the price breaks down and closes below the support zone, it will invalidate our entire setup. In this case, it's better to ignore the current action and wait for a more reliable price formation.
Trade smart, stay disciplined, and keep your eyes on the charts! The market is full of opportunities, but only those who stay focused and patient will succeed. 🎖
MyCryptoParadise
iFeel the success🌴

Will The INJ Token Burning Push The Price Beyond $50?Injective protocol has a market cap of $2.7 Billion and is ranked 47th in the cryptoverse. The volume of the asset price has seen a surge of 116% while the VM ratio of asset remains near 0.02. INJ is currently trading near $29 with a gain of 12% in the intraday session.
INJ token price is currently forming strong bullish candles on the daily chart. It is currently trading above the 50 and 100 EMA. The upside trend of INJ can see a halt near $40. Meanwhile, the support of the asset price can be seen near $20. The correlation of BTC and INJ has also surged and reached 0.72.
The RSI of the INJ is currently near 64 with a positive slope in it. The overall sentiment of the indicator is bearish in nature.

INJ: Bullish OB and Fibonacci Levels Signal Potential Upsurge 🚀💎 Paradisers, #INJUSDT has broken out of the resistive trendline with a Fair Value Gap (FVG), and subsequently, the price showed a Change of Character (CHoCH) towards the bullish market structure, enhancing the probability of a bullish move.
💎 My idea for #INJ is to look for bullish signs at the bullish Order Block (OB) combined with the Fibonacci 0.5 and 0.618 zones. If we detect any bullish signs like an Internal Change of Character (I CHoCH), we can expect a bounce from here to target external liquidity (Previous Swings). These liquidity zones are also ideal for booking profits.
💎 However, if the price doesn't show any bullish signs and instead falls below the bullish OB zone, it will invalidate our entire idea. In that case, it would be better to wait for more favorable price action to develop.

Is The Bearish Dominance Increasing Over Inj Token Price?Injective Protocol has a market cap of $2.1 Billion and is ranked 49th in the CMC. It has a supply of 100 Million in which 93% of it is circulating in the market. INJ token price is currently trading near the value of $23.35 with a drop of 1.57% in the intraday session. Meanwhile,the volume of the token has seen a surge of 114% in the past 24 hours.
INJ token price is trading below the 50 and 200 EMA with the upcoming negative crossover. The negative crossover can increase the bearish momentum on price. INJ token support level can be observed near the value of $20 while the resistance can be seen near $31.
RSI and MACD of the token price is in a neutral zone with weak bearish sentiments.

INJ SHORT Idea apparently it looks like INJ is going to take a deep correction, everything is mentioned on chart if anyone needs an explaining kindly post a comment i will explain.

$INJ Limit long here:BINANCE:INJUSDT has been consolidating for over 100 days, and now it may be a good time to consider pumping Injective again.
This could be a good opportunity to buy the dip and potentially sell above $100.

Keep Your Eyes on #INJ! 🚀 Potential Bullish Reversal Ahead!💎 Paradisers #INJ is exhibiting a bullish market structure and could potentially bounce from the bullish order block (OB) and supportive trendline.
💎If #INJUSDT forms any kind of bullish candlestick pattern at this juncture, it could be seen as confirmation of the bullish momentum.
💎However, in the event of a breakdown below the bullish OB and demand level, it may be interpreted as a bearish scenario. Nonetheless, it might be prudent to wait for better price action to develop before making any decisions.
💎If you're new to technical analysis and feeling confused, feel free to DM or comment below, and I'll be happy to assist you.

INJ-USDT LOOKING GOOD....INJ-USDT @ $37 - $ 33 should be a good bet for further UPWARD MOVE towards $80+ IMHO

Bullish On INJThe coin is making higher high and high lows which makes trend intact; so be invested and wait for Breakout above 46.30 for min 15% Target and for maximum has no limit.

$INJ Long TradeInjective Protocol is currently trading around $37.0 and is displaying strength in the daily timeframe, suggesting a potential accumulation phase before a potential upward movement.
New all time high soon. My projection for this year is a target price of $80. Let's go for it! BINANCE:INJUSDT

INJ did 500% and still $100 PotentialCRYPTOCAP:INJ ready for Another leg toward $100
- #INJ did huge performance before the Bull run.
- Our Entry was $7.5
- Currently Trading at $36
- ATH is $45
- Our Profit: 500%
- Re-Entry: $30-$35
- Stop Loss: $28
- Target: $100
INJ showing strength before major bull run.
#Injective #altcoins

INJUSDT IDEAUPDATE
Breaking Bullish Pennant Incase Of Successful Breakout Expecting Bullish Rally Towards 50$
COIN DETAILS
The live price of Injective is $ 35.33 per (INJ / USD) with a current market cap of $ 3.12B USD. 24-hour trading volume is $ 109.74M USD. INJ to USD price is updated in real-time. Injective is -0.96% in the last 24 hours with a circulating supply of 88.39M.

#INJ DISTRIBUTION ZONE!!breaking out downside.
Kinda move downwards.
Short it.
- say something. Love you all.

Multiple times price rejected at the brownline In the INJUSDT price was rejected multiple time here (orange). 4h candle not closed so not confirmed but price may reject at the brown line come back to the bottom support.
this is the price prediction not financial advice.

INJ/USDT : Trend Reversal in the Making? Don't Miss This!💎 Paradisers, let's turn our attention to INJ/USDT. On the Daily chart, it's carving out a head and shoulder pattern, signaling a potential trend reversal. Notably, the right shoulder is smaller than its left shoulder, indicating a shift towards forming lower highs.
💎 If INJ/USDT slide below the demand mark of 7.490, it would pave the way for a series of lower lows. This movement could amplify confidence in a bearish direction, potentially steering the price towards demand zones at 6.829, 6.201, and 5.681. However, if the price ascends beyond the right shoulder's peak at 8.378, this pattern might lose its validity. Trade carefully and stay sharp, ParadiseSquad!
