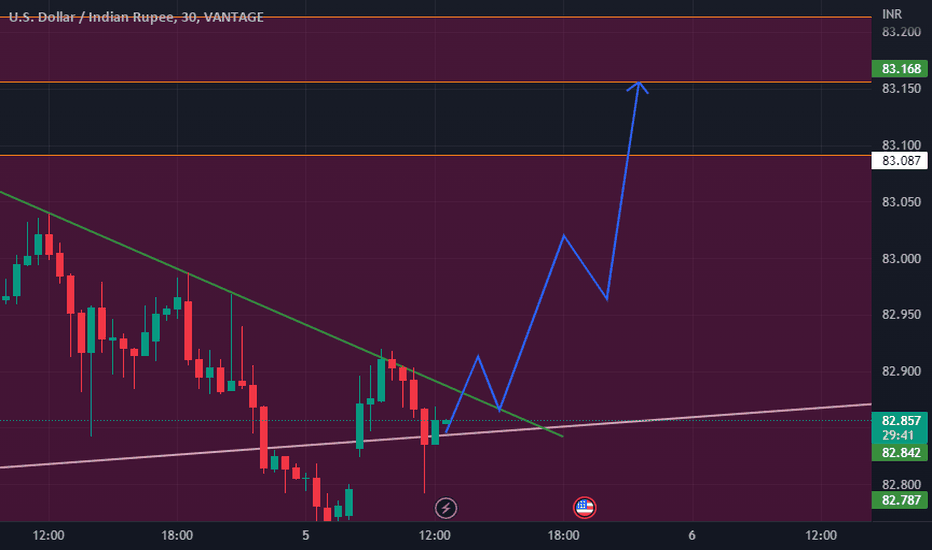
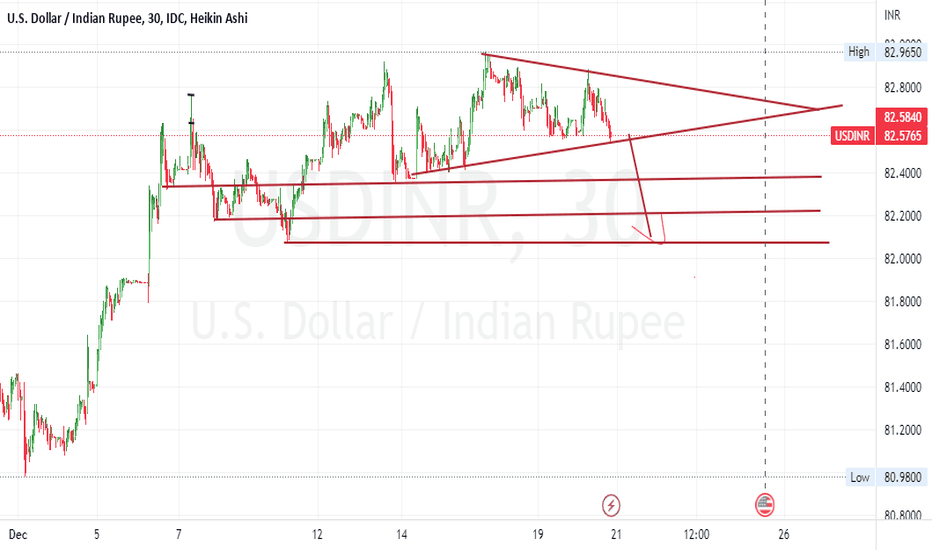
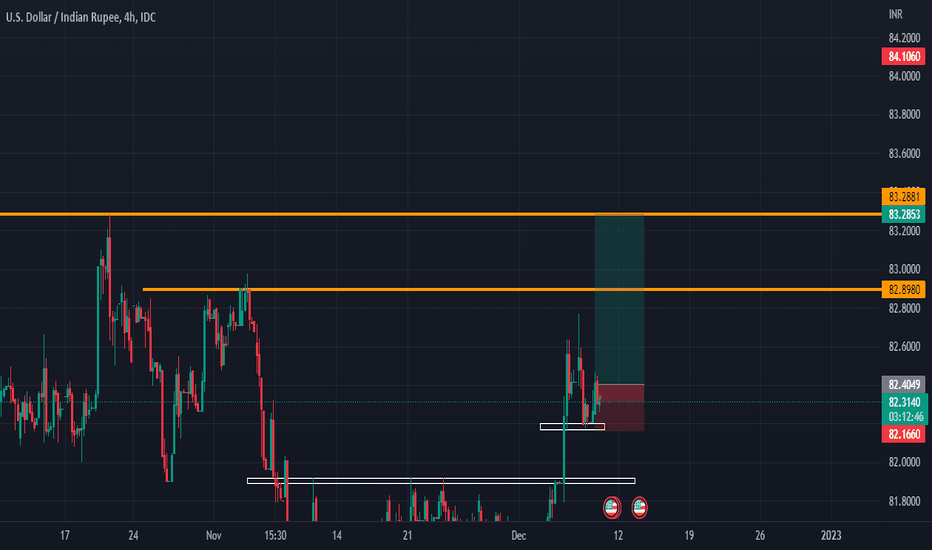
My Short trade in USD INRSimple analysis using Price Action and 21 MA. It is only for educational purposes. 01:25by DailyNiftyUpdated 118
USDINR case studyUSD INR 80.88 ELLIOT WAVE STUDY Time frame :- Daily Completion :- corrective wave 4 Unfold :- impulse wave 5 RSI :- Hidden bearish divergence with respect to price Counter is on verge to mature its corrective wave 4 ,which as per ascending parallel channel have demand zone around 80.45 to 80.00 levels once corrective wave 4 is completed , impulse wave 5 might unfold which might lead to levels of 81.9---82.9--83.9 view remains valid till counter manage to sustain above 79.6 on closing basis. Time for bulls to take charge.by RUDRA0076
INRUSD IDEABreak below the liquidity for a LTF confirmation and break below the BOS for a HTF confirmation. If broken, 79 Next... Not a financial advice. #NFAby Crypto_PSPUpdated 0
USDINR SELL ON RISEUSDINR has had a bearish break of structure. Sell on rise stance will pay off. Easy targets would be INR 80 Shortby Yassshh79
USDINR- Horn TopIndian Rupee has depreciated considerably against USD for a while Horn Top is forming on weekly. IF this formation holds Rupee will see a relief rally that could take it to 78Shortby Nifty-OptionIdeas0
usdinr still in bearish modeusdinr still in bearish mode....it may go till 80.80INR just my viewShortby kevinjohnsonkj3090
usdinrthe indicator srchannel or support resistance channel, act like supply and demand indicator , its usefull for intrady ,and ivesting more than important stoploss finding. im recommend this indicator for indacator , its trading view this indicator freeware , waste of timing draw snd., its mostly usefully helping entry snd price action for indicator , 77 to 75 usdinr stable Shortby Tradejackify1
USDINR NIFTY50Below 81.90 we may see a down move in USDINR....which may give a LONG ENTRY IN NIFTY50 FUTShortby kevinjohnsonkj3090
Bear Trap in USDINRLast day bear trap is formed in USDINR, it simply means that it will be bullish for coming few days and can go up to at least high of double top i.e.,83.10 (might break that also). Let us decode the sentiments during this candle formation, On 26th when this big bearish candle gives closing below last swing low, people would have shorted it taking double top in consideration (putting SL above that breakout candle), now after last day big bullish candle there will be some fear among people having short position as it moved close to their SL. Once it move above 26th bearish candle a small rally on upside may come as the SL of all the short position will get hit.Longby sudhanshu_raaz669
USD/INR Shooting Star Learning purposeUSD/INR daily chart formed shooting Star. 1:1 Target on daily chart is 81.765. Also it formed negative divergence with double top. Shortby sarangmv0
Rounding Bottom patternHey everyone! 👋 Today we are going to share a quick write-up about the “Rounding bottom” formation, along with a few examples that may help you solidify your understanding of this chart pattern. Please remember this is an educational post to help all of our members better understand concepts used in trading or investing. This in no way promotes a particular style of trading! The post will shed some light on the following topics: ➡ Basics and identification of the pattern ➡ Components ➡ Important aspects What is a Rounding bottom pattern? • A rounding bottom is a bullish reversal pattern that resembles the shape of the "U". • Rounding bottom pattern occur at the end of long downtrends and indicate a potential reversal. • The pattern is also referred to as a saucer bottom due to its resemblance to a saucer. • Although, the volume and price move in sync but in practice, this can vary widely. • When the price moves above the neckline, it indicates strength and suggests that the stock may begin a new uptrend. Components of a Cup and Handle pattern: A rounding bottom pattern can be divided into three main parts. • Decline • Formation of the base • Advance Important aspects: 1. Prior Trend: Since it is a bullish reversal pattern, the prior trend must be a downtrend. The low of a rounding bottom should ideally mark a new low or reaction low. The stock may trade sideways or flat for a long duration before the formation of the pattern. 2. Decline: The sell-off or decline that leads to the formation of the low, can take a variety of forms. Sometimes, the down move has many whipsaws while other times, the stock may just trade flat. 3. Low: In general, the pattern resembles a "U" shaped bottom. However, it can also resemble a "V" or a "W," but the low should not be too sharp. In addition to this, there is always a possibility of a new low due to a selling climax. 4. Advance: In general, the formation of the right half of the pattern should take about the same amount of time as the left half. This means that the up move off the lows should take about the same time as the down move. Moreover, the advance shouldn't be too sharp, or else there is a possibility of breakout failure. 5. Breakout: The pattern is confirmed once the price breaks and sustains above the neckline. The price may return to the neckline to test for the demand before continuing upwards. 6. Volume: In general, the volume levels should be ➡ High during the down move ➡ Low during the formation of the base ➡ Rising during the up move However, these are only guidelines and should not necessarily be taken at face value. 7. Target: Using the measurement objective, the target comes out to be equal to the depth of the base. It can be measured by calculating the distance between the bottom of the base and the neckline. 8. Stop-loss: Ideally, the stop loss is placed at the lowest point of the base. But if the price oscillated up and down a number of times near the neckline, the stop-loss can also be placed below the most recent swing low. Exhibit: Rounding bottom pattern with a failed breakout Thanks for reading! As we mentioned before, this isn't trading advice, but rather information about a tool that many traders use. Hope this was helpful! See you all next week. 🙂 – Team TradingView Feel free to check us out on Instagram and YouTube for more awesome content! 💘 Editors' picksEducationby TradingView99257
NIFTY : 20 OCT#NIFTY50 * NIFTY : 1DAY candle shows consolidation * USDINR : RS.83 increased from Rs.82.16 - indian rupee appreciate against the dollar (export sector will be profitable) MarketOutlook : Will be Mild Bearish, Global Markets are in consolidation mode by uzumakisensiUpdated 2
USDINR Oct ViewHey Folks ! USDINR Correction did a pennant breakout instead of the Breakdown as expected in earlier post... So, we will trade what we see in market instead of what we expect... Now for a longer term the trend has turned bullish with a Resistance Breakout and EMA Positive Cross Over (PCO) If you see in the above chart, we have seen similar pattern previously and after this pennant / flag Breakout gave two targets - 1. Flag length and 2. Pole length So, now presently, also we have same pattern breakout... Let's bet safe and trade Bull Put Spreads for next month... Plan Your Trade ! and Trade Your Plan ! Happy Learning !by NeelamNUpdated 4414
USDINR End of the rally is near. Rupee to bounce back!A steep trendline of USDINR will make it quite difficult to sustain also merging with previous resistance,. Let's take how it goes from here, i would avoid fresh longs...!! FX_IDC:USDINRShortby rahul93bhagat116
How We Did it , What are Extreems of Current Trend Friends We ware in this Currency Pair trade since 2017 December, We believed the INR will have lots movement in it based on Pattern analysis Today What we see is and Very Extreme behavior of Price rate change , if the move takes place in the same manner, we are likely to see very shortly before December 2022 around 91+ in 2019 I posted here in Trading view in order give my personal outlook on Currency paid I don't advise anyone to take position on fresh entry basis, but one who is already in the trade can trail the stop in order to Keep earnings in the Futures contract I am also attaching chart of my previous post hope you will click to see how it unfolded Good luck by ShreeKrishna_F3314
Long Continuation One can expect an side ways , Correction in this pair and then resume of trend , Current move is not Exhaustion its just an pause before resuming the trend Most people in this forum trying to post this as end of the trend , In reality its just an pause , if you really want to see how professionals work , have a look of my chart on USD INR Pair , posted in Nov 27 , 2019 and working perfectly so far , what you can find is some time there will be consolidation before resume of the trend , One can look for buying again after this small correction completes Good luck Longby ShreeKrishna_FUpdated 131316
Modi hai, toh munkin haiModi hai, toh munkin hai Bura ho covid ka jisne import ban kara diya. Nhi toh pura 100 ho jaata Thank you Modi JiShortby ravinbhutani443
USDINR SELL OPPORTUNITYDon't miss the great SELL Opportunity in USDINR. USDINR created a Ascending Channel Pattern and it's at major resistance of channel pattern and probably it'll bounce back to support zone which is at 80. The 1st target is 80.15 Entry: 81.47 SL: 82.07 TP1: 80.15 TP2: 77.15 RR Ratio: 1:8 RewardShortby Trading_SanUpdated 292915
USDINR-will reverse for short termSell @ 81.40, and carry the trade if closes below the sell price on hourly basis else retake the entry on hourly candle which close below 81.40. Stoploss and targets are mark in the chart. Note:- Only for educational purpose.Longby kdukhaUpdated 0
The Top 3 Elements found in all good trading plansHey everyone! 👋 This month, we have been theming our posts around the concept of building a solid trading plan. Our first post asked you to think about the kinds of factors that can predict long-term success. Our second post looked at why trading plans are so important. Both of these posts you can find linked at the end 👇 Having talked about the *what* and the *why*, it’s time to talk about the *how*. Today we will be taking a look at the top 3 elements found in all good trading plans! 1️⃣ Element 1: Every good trading plan knows why it wins. In trading, there are two variables that matter: Bat Rate, and Win / Loss. ► Bat Rate describes what percentage of the time a trade ends up as a win. A trader with a 90% bat rate wins 9 out of every 10 trades. ► Win / Loss describes how big the average win is, relative to the average loss. A trader with a 0.5 Win / Loss takes losses twice the size of his wins. If you multiply these numbers together, you will get an “Expected Value”. For example, a trader with a Bat Rate of 50% (wins half of the time) and a Win / Loss of 1 (Losses the same size as wins) is a perfectly “Breakeven” trader. In order to make money in the long term, all you need to do is make the multiplication of these values be a positive value. The breakeven trader above only needs to win 51% of trades to begin making money, if his W/L remains constant. ☝🏽To get these numbers into positive “expected value” territory, every good trading plan needs to devise a way to systematically find trading opportunities that it thinks have an edge. The inputs of this system are completely up to the trader, but they are typically rooted in repeating price patterns, fundamental observations, macro trends, or other patterns and cycles. Backtesting can be useful here for getting a general idea of whether or not an idea for a trading strategy has borne out to be true over time. In short, no matter what it looks like, good trading plans identify their edge before risking capital. Why start a business without a business plan? 2️⃣ Element 2: Every good trading plan takes into account the emotional character of the trader. This is the hardest element to quantify, but also arguably one of the most important pieces of a good written trading plan - the ability to work around a trader’s individual strengths and weaknesses. This is less important for banks and hedge funds, as decisions are typically made with oversight, but for retail traders, there is no-one around to temper your personal flaws. You can do whatever you want! - but it’s a double edged sword of responsibility that your trading plan needs to prepare you for. In short, you can best get an idea of where you are emotionally weakest by looking at your trading history. Nobody can do this for you, so it requires quite a bit of self-awareness. However, the rewards of removing emotional risk from a trading plan make it worth the effort. 😱 All trading is based on fear. You need to understand which fear is stronger - the fear of missing out, or the fear of losing capital. Figure out which is stronger, and plan accordingly. Just because you understand a certain strategy and other people make money trading it, doesn’t mean that you will be able to. Executing with 100% consistency at 30% efficiency is more important than finding a strategy with 100% efficiency that you can only trade with 10% consistency. Make life easy on yourself! 3️⃣ Element 3: Every good trading plan outlines risk. Whether you have one thousand dollars or one billion dollars, ignoring risk is a sure way to experience massively increased monetary and emotional volatility , which can have a huge negative impact on long term profitability. Here are a few simple-to-implement mechanisms that Banks, Hedge Funds, and Prop Firms use to reduce risk significantly - good trading plans don’t skip these. 💵 Total Account Stop Exactly what it sounds like: once you lose a certain percentage of your capital, you stop trading, liquidate your positions, and assess what went wrong. Only once you’re satisfied that you have fixed the issue are you allowed to re-enter the market. In the industry, this number is commonly 10%. 💵 Per Theme Risk This ensures that you aren’t too concentrated on a single “bet”, even if the bet is spread across multiple instruments. For example, if you own multiple companies in the same sector, their performance will likely be correlated to some degree even if they have different products or services. Adding a hard cap to this type of risk can massively reduce risky or over concentrated allocations. 💵 Per Position Risk Many successful Professional Traders and Hedge Funds use the concept of “Free Capital” in order to manage risk. “Free Capital” is the amount of money in hard dollars that makes up the buffer between an account’s current equity, and the total account stop number. For example, If a currency trader at a bank has a 10% total account stop out, and runs a $10,000,000 currency book, then he can really only “lose” $1,000,000 before his bosses pull him aside to have a talk. His “Free Capital” is $1,000,000. He will then size his positions to where he only risks 1-5% of his Free Capital per trade. This way, he has room to be wrong a minimum of 20 times in a row before any negative consequences come his way. Implementing a “free capital” risk limit per position ensures that you have a TON of room for error. Yes, this typically prevents you from doubling your account overnight, but again, that isn’t the goal. Long term profitability is. Some people call this per position risk “one R” (one risk unit). ☝🏽Whatever it looks like, including a plan for managing your risk is essential for *actually* managing your risk. If these plans aren’t written out and acted upon, they’re also a lot easier to ignore. 🙏🏽 Thanks for reading! Hope this was helpful! - TradingView Team ❤️❤️ Make sure you follow us on Instagram and YouTube for more awesome content! 💘Editors' picksEducationby TradingView88232
USD/INR - Cup n Handle breakout - 81.7 targetUSD/INR has given cup n handle breakout with gap above 80 levels. Target is coming to 81.5 - 81.7 range.Longby skandha1986Updated 111110
usdinr usdinr near resistance 82 - 82.5 ...............................................by devobrataroy0