$IO Could Be the Next 100x AI Coin?SEED_ALEXDRAYM_SHORTINTEREST2:IO Could Be the Next 100x AI Coin — Don’t Miss This Supercloud Revolution
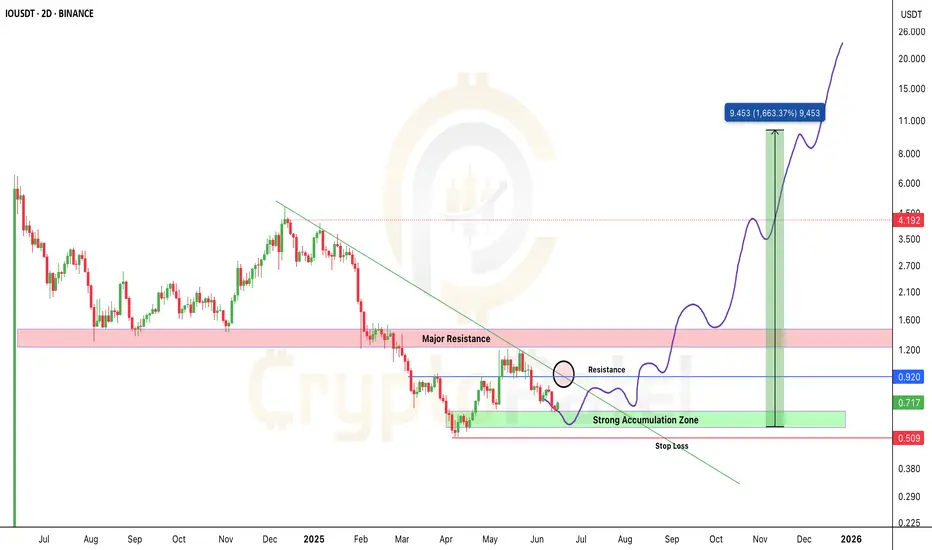
SEED_ALEXDRAYM_SHORTINTEREST2:IO is showing early signs of strength after bouncing from the key accumulation zone ($0.51–$0.73).
Structure still bullish.
A breakout above $0.92 = confirmation for next leg up.
If volume kicks in, SEED_ALEXDRAYM_SHORTINTEREST2:IO has macro breakout potential.
▶️ Entry Zone: $0.51–$0.73
▶️ Breakout Trigger: $0.92
▶️ Resistance Zone: $1.20–$1.60
▶️ Target: $5/$9/$15/$20
▶️ ROI Potential: 10x / 20x
❌ Invalidation: Break below $0.50
🔥 Long-term holders and breakout traders — don’t miss this.
io.net is turning idle GPUs into a supercloud to power AI, ML & big data — without relying on AWS or GCP.
✅ 90% cheaper than trad cloud
✅ 16,000+ GPUs live
✅ Built on Solana
✅ Backed by Multicoin, Delphi, Solana Ventures
🔰 Token Utility: Pay for compute | Staking rewards | Governance rights
This is DePIN + AI — a powerful combo. If adoption scales, SEED_ALEXDRAYM_SHORTINTEREST2:IO could be massive.
📢 If this analysis helped you, please RT & drop your thoughts in comments 👇
Let’s spread the alpha.
NFa & DYOR
Trade ideas
#IO Buy Trade **Technical Analysis Chart Description:**
Welcome to my Technical Analysis charts on TradingView! Before we dive into the analysis, it's essential to understand some important warnings:
1. **Subjectivity Alert:** Technical analysis involves interpreting market data and chart patterns, which can be subjective. Different analysts may interpret the same data differently, leading to varied conclusions.
2. **Historical Performance Doesn't Guarantee Future Results:** Past price movements do not guarantee future price movements. While historical data can provide insights, it's crucial to consider other factors that could influence price action.
3. **Risk of False Signals:** Technical indicators and chart patterns can produce false signals, leading to potential losses if relied upon blindly. Always cross-verify signals with other indicators or fundamental analysis.
4. **Market Volatility:** Crypto markets are highly volatile and can experience rapid price fluctuations. Be prepared for sudden and unexpected price movements, which may invalidate previously identified patterns.
5. **Risk Management:** Proper risk management is essential. Never invest more than you can afford to lose, and consider using stop-loss orders to mitigate potential losses.
6. **Emotional Bias:** Avoid emotional decision-making based on short-term price movements. Stick to your trading plan and strategy, and don't let fear or greed influence your decisions.
**Disclaimer for Crypto Trading:**
Trading cryptocurrencies carries inherent risks, and it's important to understand the following:
Cryptocurrency markets are highly speculative and can be subject to extreme volatility. Prices can fluctuate significantly within short periods, leading to substantial gains or losses.
Investing in cryptocurrencies involves the risk of total loss of capital. Unlike traditional assets, cryptocurrencies are not backed by any tangible assets or central authority, making them inherently risky.
Regulatory uncertainty and market manipulation are additional risks associated with cryptocurrency trading. Regulatory changes or negative news can have a significant impact on prices.
This analysis is for informational purposes only and should not be construed as financial advice. It's crucial to conduct thorough research and consult with a qualified financial advisor before making any investment decisions in the cryptocurrency markets.
By using this analysis, you acknowledge and accept the risks associated with cryptocurrency trading and agree to trade at your own discretion. The author of this analysis shall not be held responsible for any losses incurred as a result of using the information provided.

Is The Launch Of IO Not As Successful As Their Whales Imagined?IO has a market cap of $496 Million and is currently ranked 132nd in the cryptoverse. The volume of the asset price has observed a decline of over 52% in the intraday session. The VM ratio of the 1.8 suggests bearish momentum in the price. IO price is currently trading near the value of $5.25 with a drop of 13% in the past 24 hours.
As per the hourly chart of the IO it is forming strong bullish candles. It is trading above the 50 EMA on the 4 hour chart. The upside trend of the IO token price can see a halt near the value of $6.5. Meanwhile the support of the token price can be seen near $4.8
