$PI on the 15-minute chart is unfolding a classic Elliott Wave 5NASDAQ:PI on the 15-minute chart is unfolding a classic Elliott Wave 5-leg structure, showing bullish strength in short-term momentum.
🌀 Wave Structure So Far:
(1) & (2): Clean initiation phase with higher lows
(3): Strong impulsive move peaking near $0.436
(4): Healthy retracement with consol
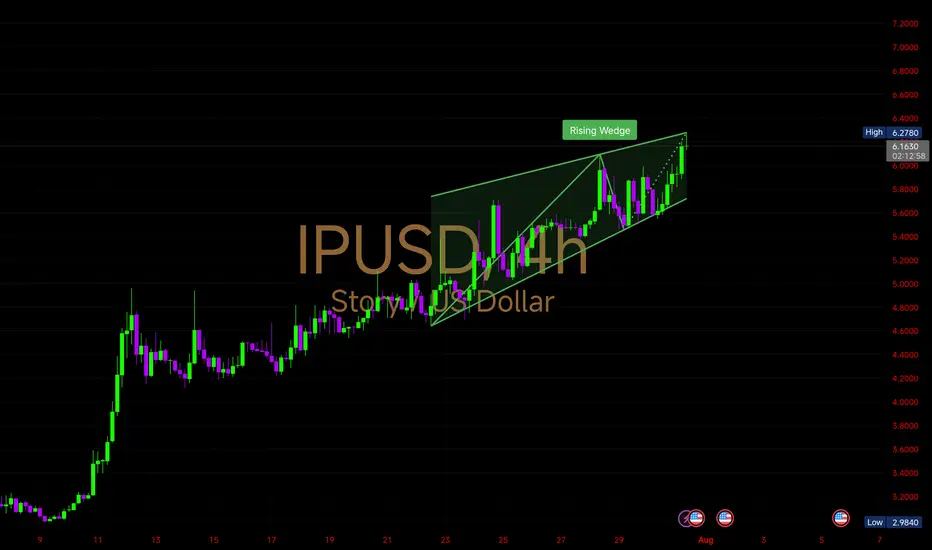
$IP – Rising Wedge Breakout Zone
COINBASE:IPUSD
NYSE:IP – Rising Wedge Breakout Zone
Price is moving within a rising wedge pattern on the 2-hour chart – a structure often associated with trend exhaustion or a near-term correction once the upper resistance is tested.
• Price has touched the upper boundary of the wedge n

See all ideas
Summarizing what the indicators are suggesting.
Oscillators
Neutral
SellBuy
Strong sellStrong buy
Strong sellSellNeutralBuyStrong buy
Oscillators
Neutral
SellBuy
Strong sellStrong buy
Strong sellSellNeutralBuyStrong buy
Summary
Neutral
SellBuy
Strong sellStrong buy
Strong sellSellNeutralBuyStrong buy
Summary
Neutral
SellBuy
Strong sellStrong buy
Strong sellSellNeutralBuyStrong buy
Summary
Neutral
SellBuy
Strong sellStrong buy
Strong sellSellNeutralBuyStrong buy
Moving Averages
Neutral
SellBuy
Strong sellStrong buy
Strong sellSellNeutralBuyStrong buy
Moving Averages
Neutral
SellBuy
Strong sellStrong buy
Strong sellSellNeutralBuyStrong buy