KAVA Ready for Breakout? Watch 0.45 Key Level
📊 Cycle Analysis
🔁 HWC: Ranging
🔁 MWC: Ranging
🔁 LWC: Ranging
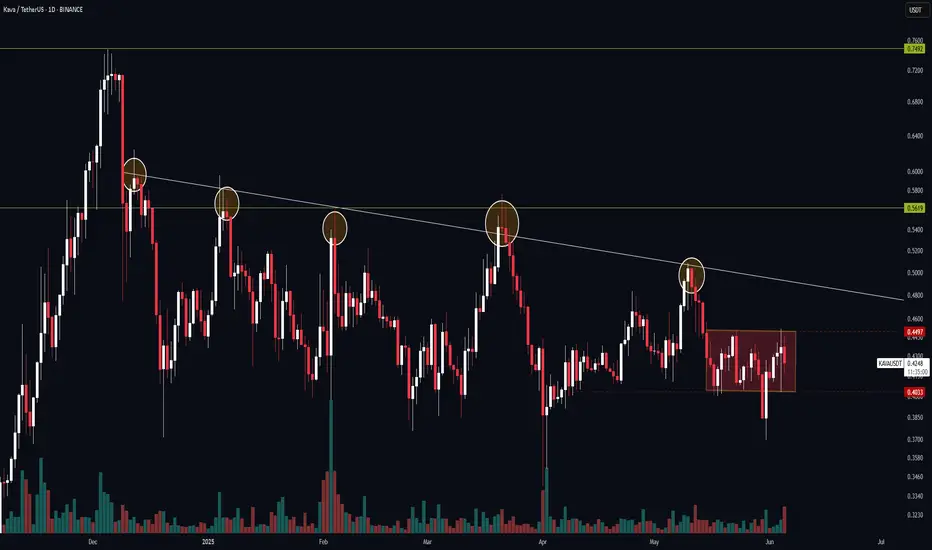
The price is currently moving inside a 4H range box. Personally, I avoid trading inside ranges like this due to the high probability of fakeouts and choppy movement.
🧭 My Strategy:
✅ A break above 0.45 (range resistance) could be a solid long trigger, signaling a potential breakout from this consolidation zone.
📈 After entering, I’ll let the price move toward the upper descending trendline, which has seen multiple touches. This increases the odds of a breakout, or at least a strong reaction.
⚠️ If the reaction to the trendline is weak (e.g., no strong rejection candle, low volume), I’ll keep my position open, as the market may break out and offer better R multiples.
🚫 About Short Positions:
Technically, you could short a breakdown from the range, but I won’t be taking any short setups here. I’m focused purely on the long side for now.
📝 Summary:
❌ No trades inside the range box
✅ Long entry on 0.45 resistance break
🎯 Targeting the upper trendline
🧠 If the trendline gives a weak rejection → keep the trade open
🚫 Ignoring short opportunities
📌 Got a coin in mind? Drop it in the comments and I’ll analyze it for you.
⚠️ Without proper risk management, you're just a ticking time bomb.
Trade ideas
BUY KAVA - Hold for 3-4 Weeks🚀 BUY KAVA - Hold for 3-4 Weeks
📢 Previously, I shared a strategy to BUY KAVA at $0.49 and hold for about 5 weeks.
📌 Market Update & Trade Plan
✔ KAVA has completed its W-cycle correction and is now set for an upward move.
✔ Within this week or early next week, KAVA is expected to resume its growth.
✔ Short-term target: $1+
✔ Long-term potential: $2.2 for those willing to hold longer.
📌 For a full breakdown, revisit my previous KAVA analysis – The strategy remains valid!
🔥 Stay tuned for updates and trade wisely! 🚀
KAVAUSDT Technical Analysis in Weekly TimeframeHello everyone, I’m Cryptorphic.
For the past seven years, I’ve been sharing insightful charts and analysis.
Follow me for:
~ Unbiased analyses on trending altcoins.
~ Identifying altcoins with 10x-50x potential.
~ Futures trade setups.
~ Daily updates on Bitcoin and Ethereum.
~ High time frame (HTF) market bottom and top calls.
~ Short-term market movements.
~ Charts supported by critical fundamentals.
Now, let’s dive into this chart analysis:
KAVA has broken down below an important support trendline and has reached the lower support level at $0.38, which is the all-time low closing back in March 2020.
In this weekly timeframe, if KAVA fails to rebound from the current market price (CMP), we will likely see a further decline toward the all-time low at $0.24. Conversely, a rebound will likely test the resistance (previously supported) of $0.64.
Key Observations:
~ Current Support: $0.38
~ All-time low Support: $0.24
~ Primary Resistance: $0.64
DYOR, NFA
Please hit the like button to support my content and share your thoughts in the comment section. Feel free to request any chart analysis you’d like to see!
Thank you!
#PEACE

KAVAUSDT ON LAST SUPPORT STOPKAVA/USDT is currently trading on the last known order block. If the price bounces from here, we could see a huge upside potential. Given that the risk-to-reward ratio is at least 1:10, this seems to be a perfect opportunity to go long.

🚀 Potential Bullish Move for KAVA💎 KAVA has displayed signs of CHoCH and is approaching a breakout of the W pattern, which increases the likelihood of a bullish move.
💎 If KAVAUSDT successfully breaks above the resistance area, confirming the W pattern and bullish market structure, we can anticipate targets until the next resistant levels.
💎 In the event of a pullback, it would be prudent to anticipate a bounce from the demand area.
💎 However, if the price breaks down below the demand level, it would be advisable to refrain from trading KAVA and wait for better price action to form before considering any new positions.

kavausdt Ideaprice has broken structure on 1d and there is a fvg on 1d above. and price has respected 4h ob. Currently i am bullish. this is not financial Advice . this is for educational Purpose only

KAVAUSDT LONG IDEA IN ACCUMULATION PHASEKAVA USDT Long /Short Entry And Exit Points MENTIONED ,Follow The Chart Support /Resistance For Swing Trades For Maximum Gain ,Scalp (3-4 Days) Tp /Entry Are Mentioned In Chart
Important: Always Use Low Lev Never Gamble N Greed .

📈 Kava/USDT Bullish Trading View 🚀#KavaUSDT #Bullish #CryptoTrading
🔍 Technical Analysis:
Kava's chart suggests strong upward potential.
Bullish patterns and ascending trends in sight.
📊 Key Levels:
Solid support at $0.580.
Resistance at $0.630, likely to be tested soon.
📈 Indicators:
RSI signals overbought conditions.
MACD displays a bullish crossover.
📰 Fundamental Analysis:
Positive news surrounding Kava ecosystem.
DeFi projects gaining prominence.
💼 Trade Strategy:
Consider long positions, manage risks wisely.
Set stop-loss orders for capital protection.
Stay vigilant for market sentiment and news.
📆 Upcoming Events:
Keep an eye on project milestones and announcements.
Monitor broader crypto market trends.
🚫 Caution:
Be prepared for potential market volatility.
Avoid impulsive decisions, maintain discipline.
🧐 Research Matters:
Always conduct thorough research.
Seek professional advice as needed.
🚨 Disclaimer: Not financial advice. Trade responsibly, considering your risk tolerance.
#CryptoAnalysis #TradingSignals #BullishMarket 🌟💰📊

KAVA in a great channel pattern..!!👀 KAVA Today analysis💎"Attention, Paradisers! KAVA/USDT (Kava) is currently showcasing a channel pattern, with the price touching the lower support boundaries of the channel. This pattern indicates a phase of consolidation and a potential window for an upward momentum.
💎The channel pattern is distinguished by two parallel trendlines that encapsulate price movements within a specific range. In the context of KAVA, the lower support level of the channel has been met, suggesting a potential area of heightened buying interest and support.
💎Significantly, the volumes accompanying the price shifts in KAVA have been relatively high. Elevated trading volumes can denote increased market participation and a stronger indication of potential price direction.

KAVA USDT LONG 🔥KAVA USDT PAIRS standing on support level if the price touch again support line the we can take a trade on it. Keep eyes on.

KAVA USDT : Possibilities of Price Breakouts and Consolidation!Scenario 1:-
There is a possibility of price taking the resistance at 1.060-1.075 and then re-test the same area before continuing its downward trend.
Therefore there is a chance of corrective behavior in the chart where the price could break down below to the levels of 0.849 - 0.834. This would lead to a consolidation phase in the market thus area of 0.849 - 0.834 becomes a good opportunity to go for long scalps.
Scenario 2 :-
However if the price keeps correcting and reach a strong buying area at 0.775 - 0.755 levels, then this area becomes a good area to accumulate KAVA in the bag .
#plan your trade , trade your plan.

Too much bullish. $0.95 coming soon.RSI is strong. MACD in the positive crossover. Three White Soldiers chart pattern in Daily Charts. Crossed a resistance.

KAVA USDT NEW SETUPHere is KAVA Trade Idea...
Looks Good On Chart..
Our First TP is Blue Line, And Secound One is Horizontal Resistance...
SPOT Recomended..

Kava potential reversal BINANCE:KAVAUSDTPERP currently testing a HTF trendline and is holding strong.

KAVAUSDT Long$KAVA has been performing well even when $BTC is not trending in the opposite direction.
Had a good trade with long on KAVA from 0.802-0.818 range to 0.858 which was the 14 day moving average.
It broke that and went to the next resistance around 0.88.
MACD, RSI and Force Index seems aligned on the 4H and also the daily chart.
A retest between the 0.835 and 0.846 area would be mean the trend going further till the next strong resistance around 0.93.
Entry : 0.835-0.846
Stoploss : 0.822
TP: 0.93

Kava (KAVA) Price Prediction 2022Kava (KAVA) Price Prediction 2022
Kava (KAVA) holds the 106th position on CoinGecko right now. KAVA price prediction 2022 is explained below with a daily time frame.
The above chart of Kava (KAVA) laid out a descending triangle pattern. This pattern is often regarded as a characteristic of a bearish trend . It is formed by the upper trend line that connects the highs and a horizontal trend line connecting lows converges to form a triangle. If the price action breaches the lower support level , the bearish trend would be sustained.
Generally, a descending triangle pattern indicates the reversal of an uptrend or the continuation of the downtrend. Traders keenly look out for a significant breakout point.
Currently, Kava (KAVA) is at $0.878. If the pattern continues, the price of KAVA might reach the resistance level of $1.076 . If the trend reverses, then the price of KAVA may fall to $0.797
Happy Trading

KAVA/USDT SHORT .Technical analysis:
. KAVA/USDT is in downtrend.
. It has Formed a Descending Triangle pattern which indicates the price to come down.
Take Profits:
TP1= @ 0.810
TP2= @ 0.750
TP3= @ 0.675
TP4= @ 0.600
SL= 0.970
HAPPY TRADING

Long entry in Kava but dont buy in FOMO before touching support KAVA is very close to touch important, You can take a long btst trade but wait for support and dont buy in FOMO.
OTHERWISE YOU WILL MISS 200-300 POINTS.

💡Don't miss the great buy opportunity in KAVAUSD @Kava_SwapTrading suggestion:
". There is a possibility of temporary retracement to the suggested support line (2.111).
. if so, traders can set orders based on Price Action and expect to reach short-term targets."
Technical analysis:
. KAVAUSDT is in a range bound, and the beginning of an uptrend is expected.
. The price is above the 21-Day WEMA, which acts as a dynamic support.
. The RSI is at 60.
Take Profits:
TP1= @ 2.388
TP2= @ 2.725
TP3= @ 3.059
TP4= @ 3.333
TP5= @ 3.648
SL= Break below S2
❤️ If you find this helpful and want more FREE forecasts in TradingView
. . . . . Please show your support back,
. . . . . . . . Hit the 👍 LIKE button,
. . . . . . . . . . Drop some feedback below in the comment!
❤️ Your support is very much 🙏 appreciated!❤️
💎 Want us to help you become a better Forex / Crypto trader?
Now, It's your turn!
Be sure to leave a comment; let us know how you see this opportunity and forecast.
Trade well, ❤️
ForecastCity English Support Team ❤️


KAVA On The Verge OF NEXT BREAKOUTHey guys welcome for a fresh update on KAVA
--------------------------------------------------------
KAVA getting ready for a breakout from upward channel...
--------------------------------------------------------
KAVA has been accumulated well and wait for the confirmation to play this trade.
--------------------------------------------------------
We can soon see a huge breakout to upside
Hold it for a while
KAVA is too Strong..
For other details you can refer to chart...
Don't Miss Out on it....
Give a thought to it and manage your risk carefully...
Let me know whats your target and suggestion In Comment Section
Will Be back with another Analysis in the mean time..
--------------------------------------------------------
Thanks for reading... Give us a THUMBS UP if you like it...
--------------------------------------------------------
this is Husain Zabir, signing out
Thankyou...


💡Don't miss the great buy opportunity in KAVAUSD @Kava_SwapTrading suggestion:
". There is a possibility of temporary retracement to the suggested support line (4.445).
. if so, traders can set orders based on Price Action and expect to reach short-term targets."
Technical analysis:
. KAVAUSDT is in an uptrend, and the continuation of the uptrend is expected.
. The price is above the 21-Day WEMA, which acts as a dynamic support.
. The RSI is at 56.
Take Profits:
TP1= @ 4.936
TP2= @ 5.233
TP3= @ 5.578
TP4= @ 5.828
TP5= @ 6.286
SL= Break below S2
❤️ If you find this helpful and want more FREE forecasts in TradingView
. . . . . Please show your support back,
. . . . . . . . Hit the 👍 LIKE button,
. . . . . . . . . . Drop some feedback below in the comment!
❤️ Your support is very much 🙏 appreciated!❤️
💎 Want us to help you become a better Forex / Crypto trader?
Now, It's your turn!
Be sure to leave a comment; let us know how you see this opportunity and forecast.
Trade well, ❤️
ForecastCity English Support Team ❤️
