Longs be cautious in M&MTF: Daily
CMP: 3645
The upmove from 2020 lows is at the maturing zone (as we are now trading in the 5th wave)
The upmove from April 2025 lows is also at the final leg and this impulse could end soon.
In simple price action terms, price has broken down from the sideways range (3660-3780) and the b
Mahindra & Mahindra Ltd. Sponsored GDR RegS
No trades
Next report date
—
Report period
—
EPS estimate
—
Revenue estimate
—
1.5 USD
1.53 B USD
18.59 B USD
About Mahindra & Mahindra Ltd.
Sector
Industry
CEO
Anish Dilip Shah
Website
Headquarters
Mumbai
Founded
1945
Identifiers
3
ISIN:USY541641194
Mahindra & Mahindra Ltd. is a holding company, which engages in the manufacturing of automotive vehicles. It operates through the following segments: Automotive, Farm Equipment, Auto Investment, Farm Investments, and Industrial Businesses and Consumer Services’ segment. The Automotive segment comprises of the sale of automobiles, spare parts, and related services. The Farm Equipment segment involves in the sale of tractors and spare parts. The Auto Investment segment pertains with investments in automotive related subsidiaries, associates and joint ventures. The Farm Investments segment refers to the investments in farm equipment related subsidiaries, associates and joint ventures. The Industrial Businesses and Consumer Services’ segment deals with investments in other than automotive & farm related subsidiaries, associates and joint ventures. The Others segment includes agri, construction equipment, powerol, and spares business unit. The company was founded by Jagdish Chandra Mahindra, Kailash Chandra Mahindra, and Ghulam Mohammed on October 2, 1945, and is headquartered in Mumbai, India.
Related stocks

Candle Pattern Practical Tips for Using Candlestick Patterns
Combine with Trend Analysis:
Always consider the prevailing trend. A reversal pattern is more meaningful if it aligns with trend exhaustion signals.
Confirm with Volume:
Higher volume strengthens the validity of candlestick signals.
Use with Technical

Mahindra & Mahindra: Reversing Gears—Short Drive Toward 3400”Mahindra & Mahindra is showing clear signs of Smart Money distribution on the higher timeframe. Price has tapped into a major HTF supply zone around 3600–3650, where institutional selling previously originated. The recent sweep of the highs looks like a classic liquidity grab, engineered to trap lat

M&M - Bullish Momentum Near Resistance💹 Mahindra & Mahindra Ltd (NSE: M&M)
Sector: Automobiles | CMP: 3757.30 | View: Bullish Momentum Near Resistance
Chart Pattern: Ascending Structure with Resistance Retest
Candlestick Pattern: Strong Bullish Candle
Swing High: 3781
Swing Low: 3393
STWP Trade Analysis:
Bullish Breakout Level: 3781

Swing Trading in India1. What Is Swing Trading?
Swing trading is a strategy where traders aim to profit from price swings—upward or downward—over short to medium durations. Unlike day traders, swing traders don’t depend on rapid-fire trades. Instead, they wait for price setups, enter with a calculated plan, and exit whe
M&M Breakout Structure with Multiple Upside TargetsMahindra & Mahindra is consolidating in a tight range above its rising trendline and key EMAs, forming a continuation structure after a strong impulsive rally. A decisive breakout above the immediate resistance zone can open a move first toward the trail target near 3,820–3,850 and then extend to hi

M&M Update Price Trading Inside a Contracting WedgeMahindra and Mahindra is currently respecting both the upper and lower boundaries of a contracting wedge pattern on the one hour timeframe.
Each time price approaches the upper trendline, it is being rejected. Each touch on the lower trendline is showing signs of support and buyers stepping in.
Thi

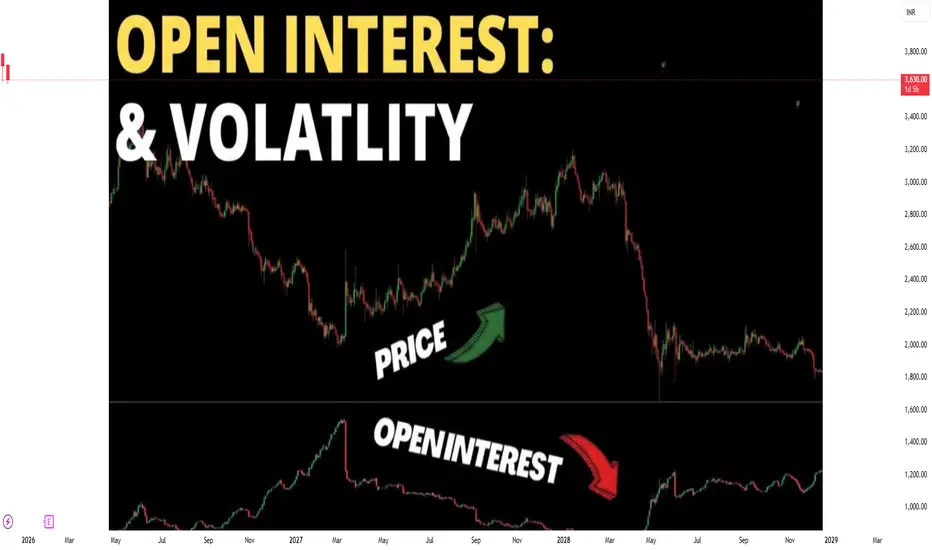
Understanding Open Interest and Volatility1. Open Interest: Definition and Significance
Open interest (OI) refers to the total number of outstanding derivative contracts, such as futures or options, that have not been settled or closed. Unlike trading volume, which measures the number of contracts traded during a specific period, open inte
Part 9 Trading Master Class With Experts Premium – The Cost of the Option
Premium is the price you pay to buy an option. It is influenced by many factors including:
Underlying price
Strike price
Time to expiry (Theta)
Volatility (Vega)
Interest rates
Buyers pay premium; sellers receive premium.

Mahindra & Mahindra – Steady Uptrend With Channel SuPPORTThis daily chart of Mahindra & Mahindra (M&M) showcases a well‑defined rising trendline where price has been making higher highs and higher lows, respecting channel support after each consolidation. The current structure shows a tight range near the investment zone, with downside risk capped by the

See all ideas
Summarizing what the indicators are suggesting.
Oscillators
Neutral
SellBuy
Strong sellStrong buy
Strong sellSellNeutralBuyStrong buy
Oscillators
Neutral
SellBuy
Strong sellStrong buy
Strong sellSellNeutralBuyStrong buy
Summary
Neutral
SellBuy
Strong sellStrong buy
Strong sellSellNeutralBuyStrong buy
Summary
Neutral
SellBuy
Strong sellStrong buy
Strong sellSellNeutralBuyStrong buy
Summary
Neutral
SellBuy
Strong sellStrong buy
Strong sellSellNeutralBuyStrong buy
Moving Averages
Neutral
SellBuy
Strong sellStrong buy
Strong sellSellNeutralBuyStrong buy
Moving Averages
Neutral
SellBuy
Strong sellStrong buy
Strong sellSellNeutralBuyStrong buy
Displays a symbol's price movements over previous years to identify recurring trends.
955MML2063
Mahindra & Mahindra Limited 9.55% 04-JUL-2063Yield to maturity
—
Maturity date
Jul 4, 2063
757MML26
Mahindra & Mahindra Limited 7.57% 25-SEP-2026Yield to maturity
—
Maturity date
Sep 25, 2026
See all MHID bonds