Part 4 Technical Analysis VS. Institutional Option TradingOption Trading in Trending vs. Range-Bound Markets
1. Trending Market
Buyers → High reward
Sellers → Increased risk
Look for:
Market structure break
Volume surge
Imbalance zones
Clearing of option OI levels
2. Range-Bound Market
Sellers → Consistent profits
Buyers → Theta decay damage
Indicators:
High HVN
OI build-up on both sides
Low IV environment
Reliance Industries Ltd Sponsored GDR 144A
No trades
What traders are saying

Part 5 Advance Option Trading Strategies Risks in Option Trading
Options offer high rewards, but also involve risks if not used carefully.
1. For Option Buyers
High time decay (theta loss daily)
Need strong, fast movement
2. For Option Sellers
Unlimited risk (if naked selling)
High margin requirement
Volatility spikes kill profits
3. Liquidity Risk
Wide bid-ask spreads reduce profit potential.
4. Event Risk
News announcements can cause unpredictable moves.

Part 1 Institutional vs. Technical Key Option Terminologies
1. Strike Price
The agreed price at which the asset can be bought or sold.
2. Expiry Date
The last date on which the option contract is valid.
3. Premium
The price paid by the option buyer to the seller.
4. Lot Size
The fixed quantity of underlying assets per option contract.
5. Open Interest (OI)
Total number of outstanding option contracts.

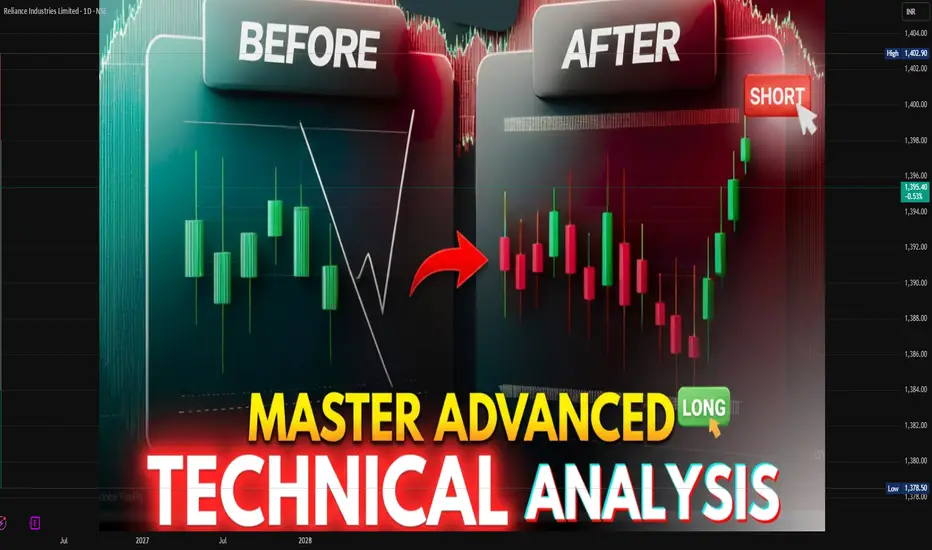
Advanced Technical Analysis: A Comprehensive Guide1. Principles of Advanced Technical Analysis
At its core, technical analysis is based on three main principles:
Price Discounts Everything: All information — news, fundamentals, market sentiment — is reflected in the price. Advanced TA accepts this as a foundation, emphasizing price action over external factors.
Price Moves in Trends: Markets trend in three ways — uptrend, downtrend, and sideways. Advanced analysis focuses on identifying the start and end of these trends with precision using sophisticated tools.
History Repeats Itself: Patterns, behaviors, and psychology tend to repeat due to human nature. Advanced TA uses pattern recognition and statistical methods to capitalize on these repetitive behaviors.
Advanced TA combines these principles with quantitative methods and behavioral insights to increase accuracy.
2. Advanced Chart Patterns
While basic patterns include head and shoulders, double tops, and triangles, advanced patterns are more nuanced:
Harmonic Patterns: These patterns, like the Gartley, Butterfly, Bat, and Crab, use Fibonacci ratios to identify precise reversal zones. Unlike basic patterns, harmonic patterns offer a mathematically-defined framework for entry and exit.
Elliott Wave Theory: Developed by Ralph Nelson Elliott, this theory identifies recurring waves in price movement — impulsive (trend-following) and corrective (counter-trend) waves. Advanced traders use Elliott Wave to forecast multi-timeframe trends and market cycles.
Market Profile: This tool analyzes the distribution of traded volume at different price levels to identify value areas, points of control, and price acceptance zones. Market Profile is highly useful for intraday and institutional trading strategies.
3. Advanced Technical Indicators
Beyond moving averages and RSI, advanced traders rely on more sophisticated indicators:
Ichimoku Kinko Hyo: Often called the “one-glance indicator,” it provides support, resistance, trend direction, and momentum in one chart. The Kumo (cloud) identifies trend strength and potential reversals.
Fibonacci Extensions & Retracements: Advanced traders use Fibonacci levels not just for retracements, but for projecting price targets and stop-loss levels. Confluences with other indicators improve accuracy.
MACD with Histogram Divergence: While the basic MACD identifies trend and momentum, analyzing divergences between MACD and price uncovers early reversal signals.
Volume-based Indicators: Tools like On-Balance Volume (OBV), Chaikin Money Flow (CMF), and Volume Price Trend (VPT) help identify accumulation or distribution phases, indicating potential breakouts or breakdowns.
Adaptive Indicators: Indicators like Adaptive Moving Average (AMA) and Kaufman’s Efficiency Ratio adjust to market volatility, providing a more responsive approach than static indicators.
4. Multi-Timeframe Analysis
Advanced traders rarely rely on a single timeframe. Multi-timeframe analysis involves examining multiple chart intervals — from monthly to intraday — to identify trends and align trades with higher-probability setups. Key principles include:
Top-Down Approach: Start with a higher timeframe to identify the major trend, then use lower timeframes to refine entries and exits.
Timeframe Confluence: Trades are stronger when multiple timeframes agree on trend direction, support/resistance, and momentum.
Fractal Patterns: Price movements repeat across timeframes, allowing traders to anticipate behavior in smaller or larger scales using fractal analysis.
5. Advanced Price Action Techniques
Price action analysis is the study of raw price behavior without relying heavily on indicators. Advanced techniques include:
Order Flow Analysis: Examining the flow of buy and sell orders in real-time markets to understand institutional activity and anticipate price moves.
Candlestick Confluence: Combining multiple candlestick patterns across higher and lower timeframes to validate reversals or continuation signals.
Support/Resistance with Precision: Using historical highs/lows, pivot points, Fibonacci levels, and volume clusters to identify high-probability zones for entries and exits.
Trend Exhaustion Signals: Recognizing signs of overextension, like long wicks, shrinking volume, or divergence in oscillators, to anticipate reversals.
6. Quantitative and Statistical Methods
Professional technical analysis increasingly incorporates quantitative methods:
Statistical Indicators: Bollinger Bands, Standard Deviation Channels, and Keltner Channels help identify volatility, mean reversion, and breakout points.
Correlation Analysis: Examining how assets or indices move in relation to each other to hedge or amplify trades.
Backtesting and Algorithmic Validation: Advanced traders validate strategies using historical data, Monte Carlo simulations, and statistical models to measure risk and probability of success.
7. Risk Management and Trade Psychology
Advanced technical analysis is incomplete without rigorous risk management:
Position Sizing: Using volatility, ATR, or percentage-based methods to determine trade size.
Stop-Loss Placement: Placing stops beyond key support/resistance, volatility levels, or pattern invalidation points.
Reward-to-Risk Optimization: Targeting trades with at least a 2:1 or 3:1 reward-to-risk ratio ensures long-term profitability.
Psychological Discipline: Advanced traders maintain emotional control, avoid overtrading, and adhere strictly to plan-based trading.
8. Integration with Fundamental and Sentiment Analysis
Though TA focuses on price, advanced practitioners often combine it with fundamental and sentiment insights:
Macro Events: Interest rates, earnings, or geopolitical developments can amplify technical setups.
Market Sentiment Indicators: Commitment of Traders (COT) reports, VIX index, and news sentiment can provide context to technical signals.
Confluence Approach: Trades with alignment between technical setups, fundamental catalysts, and market sentiment tend to have the highest probability.
9. Algorithmic and Machine Learning Approaches
Modern advanced technical analysis increasingly incorporates algorithmic trading and AI:
Pattern Recognition AI: Machine learning models can detect complex chart patterns faster and more accurately than humans.
Predictive Analytics: Using historical price, volume, and alternative data to predict probabilities of trend continuation or reversal.
Automated Execution: Advanced traders often use bots and automated scripts to execute trades when conditions are met, reducing emotional bias and ensuring precision.
10. Key Takeaways
Advanced technical analysis is more than chart reading; it is an integrated science of price, volume, momentum, and psychology. Key principles for mastery include:
Understanding multi-timeframe trends.
Combining advanced indicators, harmonic patterns, and Elliott Wave.
Using quantitative validation and backtesting for strategy reliability.
Integrating price action with institutional order flow and sentiment data.
Implementing strict risk management and psychological discipline.
By combining these tools, techniques, and analytical frameworks, traders can increase the probability of success, adapt to changing market conditions, and make informed decisions beyond simple guesswork. Advanced technical analysis is not about finding “guaranteed” trades but about stacking probabilities in your favor.
Part 4 Technical Vs. Institutional Option TradingAdvanced Option Trading Strategies Explained1. Straddle/Strangle- Straddle: Buy call and put at same strike, profit from big price moves (volatility).
- Strangle: Buy call and put at different strikes, profit from big moves with lower cost.
2. Iron Condor- Sell OTM call and put spreads, profit from low volatility (price staying within range).
3. Butterfly Spread- Buy and sell options at multiple strikes, profit if price stays near middle strike.
4. Calendar Spread- Buy and sell options with same strike but different expiries, profit from time decay differences.
5. Ratio Spreads- Buy and sell options in different ratios, profit from volatility changes or direction.

Part 3 Institutional Option Trading Vs. Techncal AnalysisOption Buyer vs Option Seller
Buyer pays premium, limited risk, unlimited profit.
Seller collects premium, limited profit, unlimited risk.
In real market volume, 80–90% of time sellers (institutions) dominate.
Expiry
Every option has a deadline (weekly, monthly).
On expiry day, option either:
ITM: Has value.
OTM: Becomes zero.

Oil Supply and Demand Balances1. Understanding Oil Supply
Oil supply refers to the total quantity of crude oil and petroleum products available for consumption at a given time. It can be categorized into several sources:
a) Crude Oil Production:
Crude oil production is the primary component of oil supply and is influenced by geological availability, technological capabilities, investment in exploration, and political factors. Major oil-producing countries such as Saudi Arabia, the United States, Russia, and members of the Organization of Petroleum Exporting Countries (OPEC) play a pivotal role in global production levels.
b) Inventories and Stockpiles:
Strategic and commercial oil reserves contribute to supply. Strategic reserves are maintained by governments to stabilize domestic markets in times of disruption, while commercial stockpiles are held by oil companies to meet demand fluctuations. Changes in inventory levels can signal either oversupply or shortages, impacting market prices.
c) Refinery Output:
Oil supply also depends on the capacity of refineries to process crude oil into usable products such as gasoline, diesel, jet fuel, and heating oil. Refinery utilization rates, maintenance schedules, and technological improvements can affect the amount of refined products available in the market.
d) Geopolitical Factors:
Supply is highly sensitive to geopolitical events. Conflicts in oil-producing regions, sanctions, or trade restrictions can constrain supply, while agreements among producers to cut or increase output (such as OPEC+ decisions) directly influence global supply levels.
e) Technological Advances and Unconventional Sources:
The development of unconventional sources, such as shale oil and oil sands, has significantly expanded supply options. Advances in hydraulic fracturing and horizontal drilling, particularly in the U.S., have shifted the global supply landscape by increasing production flexibility.
2. Understanding Oil Demand
Oil demand represents the quantity of crude oil and petroleum products that consumers are willing and able to purchase at prevailing prices. It is shaped by multiple factors:
a) Economic Activity:
Oil is a critical input for industrial production, transportation, and power generation. Economic growth drives higher energy consumption, especially in emerging economies such as China and India, which have rapidly growing industrial sectors and expanding transportation networks.
b) Transportation Sector:
The transportation sector accounts for the largest portion of oil demand. Demand for gasoline, diesel, and jet fuel is highly correlated with vehicle ownership, freight movement, and air travel. Shifts toward electric vehicles and public transportation can gradually reduce oil demand growth.
c) Seasonal Variations:
Oil demand fluctuates seasonally. For example, gasoline consumption typically rises during the summer driving season, while heating oil demand peaks in winter in colder regions. These seasonal patterns create temporary imbalances in supply and demand.
d) Energy Policy and Substitutes:
Government policies, such as fuel efficiency standards, carbon taxes, and subsidies for renewable energy, can affect oil demand. Increased adoption of alternative energy sources, biofuels, and electric mobility reduces reliance on oil and shifts the demand curve downward.
e) Population Growth and Urbanization:
Long-term oil demand trends are influenced by population growth and urbanization. Growing populations increase energy consumption, while urbanization often leads to higher transportation fuel usage, expanding the overall demand for oil.
3. Balancing Supply and Demand
The balance between oil supply and demand is crucial for maintaining price stability. When supply exceeds demand, inventories build up, leading to falling prices. Conversely, when demand outstrips supply, inventories decline, creating upward pressure on prices. This balance can be analyzed in several ways:
a) Global Oil Market Equilibrium:
Oil markets aim to reach an equilibrium where the quantity supplied matches the quantity demanded at a certain price. This equilibrium is rarely static due to continuous changes in production, consumption patterns, and external shocks.
b) Short-term vs Long-term Balances:
Short-term balances are influenced by seasonal fluctuations, weather events, refinery outages, and geopolitical crises. For instance, hurricanes in the Gulf of Mexico can temporarily disrupt U.S. production, tightening supply and pushing prices higher.
Long-term balances are determined by structural factors such as new oil field developments, technological innovation, energy transitions, and long-term economic growth trends.
c) Market Signals:
Oil prices serve as a signal for both producers and consumers. High prices incentivize increased production and energy efficiency, while low prices can reduce exploration investment and promote consumption. Futures markets also reflect expectations about future supply-demand balances.
4. Factors Disrupting the Balance
Oil supply-demand balances are highly sensitive and prone to disruption. Key disruptive factors include:
Geopolitical Tensions: Wars, sanctions, and political instability in oil-producing regions can reduce supply unpredictably.
Natural Disasters: Hurricanes, earthquakes, and other natural events can damage infrastructure, affecting both production and transportation.
Technological Changes: Breakthroughs in extraction or renewable energy can shift the balance. For example, the shale revolution dramatically increased U.S. oil production.
Economic Shocks: Global recessions reduce industrial activity and transportation, causing oil demand to fall sharply.
Policy Shifts: Regulatory changes, carbon pricing, and subsidies for alternative energy can either suppress or stimulate oil consumption.
5. Measurement of Supply-Demand Balances
Organizations such as the International Energy Agency (IEA), U.S. Energy Information Administration (EIA), and OPEC regularly monitor oil supply-demand balances. Key metrics include:
Supply Figures: Crude oil production, refinery output, and stock changes.
Demand Estimates: Consumption data across sectors and regions, including transportation, industrial, residential, and power generation.
Inventory Levels: Changes in crude and product stocks, signaling tightness or oversupply in the market.
Market Indicators: Futures prices, backwardation/contango structures, and spreads between crude grades.
These metrics allow analysts to forecast potential shortages or surpluses and anticipate price trends.
6. Implications for the Oil Market
The supply-demand balance has profound implications:
Price Volatility: Imbalances lead to sharp fluctuations in oil prices, affecting energy costs globally.
Investment Decisions: Producers rely on supply-demand forecasts to plan new exploration, production, and refining capacity.
Policy Formulation: Governments monitor the balance to ensure energy security, manage strategic reserves, and design energy policies.
Global Economic Impact: Oil prices influence inflation, trade balances, and economic growth worldwide. Surplus supply tends to lower prices, benefiting consumers, while shortages raise prices and strain economies.
7. Future Trends in Supply-Demand Balances
Several emerging trends are reshaping oil supply-demand dynamics:
Energy Transition: Shift toward renewables, electric vehicles, and energy efficiency may reduce long-term oil demand growth.
Peak Oil Demand: Some analysts project a peak in global oil demand in the next few decades, driven by technological innovation and policy shifts.
Geopolitical Realignments: Changes in OPEC+ strategies and new producers entering the market will influence future supply levels.
Climate Policies: Decarbonization commitments and emission reduction targets are likely to constrain fossil fuel consumption.
Conclusion
Oil supply and demand balances form the foundation of global energy markets. Supply is shaped by production levels, inventories, refinery capacity, technology, and geopolitics, while demand is influenced by economic activity, transportation, policies, population growth, and energy alternatives. Maintaining equilibrium is critical for price stability and economic planning. Disruptions in either supply or demand can lead to volatility, affecting markets worldwide. As the world moves toward cleaner energy sources, the dynamics of oil supply-demand balances will continue to evolve, making careful monitoring and analysis increasingly vital for stakeholders across the energy sector.

Reliance - Multi time frame analysisThe price is trending inside a descending channel in the lower time frame and is now testing the important zone at 1400. As per the daily chart, the price has taken support from 1370. Another support is also there at 1340. If the price does not gain bullish strength, there is a chance to test 1340.
Buy above 1404 with the stop loss of 1392 for the targets 1416, 1428, 1440 and 1454.
Sell below 1380 with the stop loss if 1392 for the targets 1368, 1354, 1340 and 1322.
Always do your analysis before taking any trade.

INTRADAY INSTITUTIONAL TRADING Moneyness
In-the-Money (ITM)
Call: Spot > Strike
Put: Spot < Strike
At-the-Money (ATM)
Spot ≈ Strike
Out-of-the-Money (OTM)
Call: Spot < Strike
Put: Spot > Strike

Reliance Industries: Still in a B-Wave Trap Below 1,420Price appears to have completed a short-term 5-wave advance, following which the structure has shifted into a corrective phase.
The ongoing move is best read as an (a)(b)(c) zigzag, where wave (b) is still unfolding inside a clear supply zone. The overlapping and choppy price action supports the view that this is not a trend reversal.
As long as price stays below 1,419.5, the expectation remains for a 5-wave decline in wave (c), targeting the 0.618–0.786 retracement zone (around 1,390–1,383).
Only after this corrective leg completes does the setup open the door for a higher-degree recovery. Until then, any rise should be treated as corrective.
Disclaimer:
This analysis is for educational purposes only and does not constitute investment advice. Please do your own research (DYOR) before making any trading decisions.

RELIANCE Level Analysis: Intraswing for 23rd JAN 2026Contd...... of 18 Jan 2026 Post.
RELIANCE Level Analysis: Intraswing for 23rd JAN 2026 _____________^^^^^^^^^^_____________
💥Level Interpretation / description:
L#1: If the candle crossed & stays above the “Buy Gen”, it is treated / considered as Bullish bias.
L#2: Possibility / Probability of REVERSAL near RLB#1 & UBTgt
L#3: If the candle stays above “Sell Gen” but below “Buy Gen”, it is treated / considered as Sidewise. Aggressive Traders can take Long position near “Sell Gen” either retesting or crossed from Below & vice-versa i.e. can take Short position near “Buy Gen” either retesting or crossed downward from Above.
L#4: If the candle crossed & stays below the “Sell Gen”, it is treated / considered a Bearish bias.
L#5: Possibility / Probability of REVERSAL near RLS#1 & USTgt
HZB (Buy side) & HZS (Sell side) => Hurdle Zone,
*** Specialty of “HZB#1, HZB#2 HZS#1 & HZS#2” is Sidewise (behaviour in Nature)
Rest Plotted and Mentioned on Chart
Color code Used:
Green =. Positive bias.
Red =. Negative bias.
RED in Between Green means Trend Finder / Momentum Change
/ CYCLE Change and Vice Versa.
Notice One thing: HOW LEVELS are Working.
Use any Momentum Indicator / Oscillator or as you "USED to" to Take entry.
━━━━━━━━━━━━━━━━━━━━━━━━━━━━━━━━━━━━━━━━━━━
⚠️ DISCLAIMER:
The information, views, and ideas shared here are purely for educational and informational purposes only. They are not intended as investment advice or a recommendation to buy, sell, or hold any financial instruments. I am not a SEBI-registered financial adviser.
Trading and investing in the stock market involves risk, and you should do your own research and analysis. You are solely responsible for any decisions made based on this research.
"As HARD EARNED MONEY IS YOUR's, So DECISION SHOULD HAVE TO BE YOUR's".
━━━━━━━━━━━━━━━━━━━━━━━━━━━━━━━━━
❇️ Follow notification about periodical View
💥 Do Comment for Stock WEEKLY Level Analysis.🚀
📊 Do you agree with this view?
✈️ HIT THE PLANE ICON if this technical observation resonates with you. It will Motivate me.
━━━━━━━━━━━━━━━━━━━━━━━━━━━━━━━━━
💡 If You LOOKING any CHART & want for Level and ANALYZE?
Share your desired stock names in the comments below! I will try to analyze the chart Levels, patterns and share my technical view (so far my Knowledge).
If Viewers think It can identify meaningful setups. Looking forward to hearing from all of you — let's keep this discussion going and help each other make better trading decisions.

Reliance IndustriesReliance has broken an important level marked in Red dashed line, which will now act as a resistance, It is sustaining below this level which could be bearish sign,
So if it rejects from the yellow dashed line at 1466 and breaks the white dashed line at 1445 level then it could test below key support at 1380 marked on the chart or to the green dashed line .
Disclaimer :
It's a personal view not a financial advice and I assume no responsibility and liability whatever outcome arises.

PART 4 TECHNNICAL VS. INSTITUTIONALTime Decay (Theta)
Theta represents how much value option will lose per day even if price doesn’t move.
Sellers LOVE Theta
Buyers FEAR Theta
Near expiry:
A ₹200 premium may fall to ₹20 even with little change in spot.
This is how sellers make money consistently.

Part 5 Advance Trading Knowledge Introduction to Option Trading
Option trading is a sophisticated financial market activity that allows traders and investors to manage risk, speculate on price movements, and generate income using derivative instruments known as options. Unlike traditional equity trading—where an investor buys or sells shares outright—options derive their value from an underlying asset such as stocks, indices, commodities, currencies, or cryptocurrencies.
An option contract gives the buyer the right, but not the obligation, to buy or sell an underlying asset at a predetermined price within a specific time period. The seller (writer) of the option, on the other hand, has the obligation to fulfill the contract if the buyer chooses to exercise it.
Option trading is widely used in global financial markets due to its flexibility, leverage, and ability to profit in rising, falling, or even sideways markets.

Part 2 Ride The Big Moves How Options Work – Strike Price, Premium, Expiry
Every option contract contains three essential components:
A. Strike Price
The strike price is the predetermined price at which the buyer can buy (CE) or sell (PE) the underlying.
Example:
Nifty Spot = 22,000
You buy Nifty 22,100 CE, meaning you can buy Nifty at 22,100.
B. Premium
Premium is the price you pay (buyer) or receive (seller) to enter the contract. Option prices change based on demand, volatility, time, and underlying movement.
C. Expiry
Options do not last forever. Every option expires:
Weekly (Most popular in Nifty/Bank Nifty)
Monthly
Quarterly (some stocks)
Yearly (LEAPS) in some markets
At expiry, the option will either:
Become In the Money (ITM) → It has intrinsic value.
Become Out of the Money (OTM) → It becomes worthless.

Reliance: Big Stock, Big Structure, Slow DecisionsReliance Industries is trading within a well-defined long-term rising channel on the higher timeframe.
The recent decline looks like a pullback within structure, not a breakdown. Price is currently in the upper-to-mid part of the channel, leaving room for mean reversion toward the major rising trendline support.
This is not a fast-moving stock, and such moves usually take time and patience. The expectation is not an immediate fall, but a gradual drift or consolidation that may eventually bring price closer to the long-term support zone.
Until price reaches that zone, the chart remains a wait-and-watch setup. The real decision-making area lies near the lower trendline, where price reaction will matter more than prediction.

Reliance - Interesting price action...Many traders/investors check reliance whenever they want to know the direction of the indexes. Today, we had a gap-up opening due to the positive news(trade talks). What are the important levels if we want to buy?
The price has support at 1390 and 1420. It should show bullish strength at any of these levels to move up.
Let us assume the price shows bullish strength around the 1410 level, then buy above 1415 with the stop loss of 1402 for the targets 1424, 1438, 1454, 1472, 1486 and 1498.
Strong resistance is seen at the 1595 to 1610 zone. The price should break it and sustain above it to move up further.
Always do your analysis before taking any trade.

Geopolitical Events & Global ConflictsUnderstanding Geopolitics
Geopolitics refers to how geographical factors such as location, natural resources, population, borders, and strategic routes influence political power and international behavior. Countries do not act in isolation; their decisions are shaped by neighboring states, access to oceans, energy resources, trade corridors, and military vulnerabilities.
For example, control over choke points like the Strait of Hormuz, the Suez Canal, or the South China Sea holds immense strategic value because a large share of global trade and energy supplies passes through these regions. Any disruption in such areas can ripple through the global economy, causing spikes in oil prices, supply chain disruptions, and market volatility.
Types of Geopolitical Events
Geopolitical events can take many forms, not all of which involve direct warfare:
Military Conflicts and Wars
These include full-scale wars, regional conflicts, border skirmishes, and civil wars with international involvement. Examples include interstate wars, proxy wars, and internal conflicts that draw global attention due to humanitarian or strategic concerns.
Diplomatic Tensions and Alliances
Diplomatic standoffs, sanctions, treaty breakdowns, or the formation of new alliances (such as military or trade blocs) are major geopolitical events. Organizations like NATO, BRICS, ASEAN, and the United Nations play central roles in shaping these dynamics.
Economic and Trade Conflicts
Trade wars, sanctions, tariffs, and restrictions on technology or capital flows are increasingly common tools of geopolitical competition. Economic power has become as important as military strength in influencing global outcomes.
Energy and Resource Disputes
Conflicts over oil, gas, water, rare earth metals, and food security are becoming more prominent as global demand rises and resources become scarcer.
Political Instability and Regime Changes
Coups, revolutions, contested elections, and sudden policy shifts can alter regional balances of power and affect global markets.
Causes of Global Conflicts
Global conflicts rarely arise from a single cause. Instead, they are the result of overlapping and reinforcing factors:
Territorial Disputes: Disagreements over borders, islands, or strategic regions are among the most common triggers of conflict.
Economic Inequality and Competition: Competition for markets, resources, and technological dominance often fuels tensions between major powers.
Ideological Differences: Conflicts between political systems, governance models, or belief systems have historically driven major global confrontations.
Ethnic and Religious Divisions: Internal conflicts rooted in identity can escalate into regional or global crises when external powers intervene.
Power Transitions: When a rising power challenges an established global leader, instability often follows as both sides seek to protect their interests.
Role of Major Global Powers
Major powers such as the United States, China, Russia, and the European Union play outsized roles in global geopolitics. Their military capabilities, economic influence, technological leadership, and diplomatic reach shape global outcomes.
The United States has long acted as a global security provider, with military bases and alliances around the world.
China focuses on expanding economic and strategic influence through trade, infrastructure investment, and regional dominance.
Russia leverages energy resources, military power, and regional influence to maintain its geopolitical standing.
The European Union emphasizes diplomacy, economic integration, and regulatory power, though internal divisions sometimes limit unified action.
Smaller regional powers also play critical roles, especially in geopolitically sensitive regions such as the Middle East, South Asia, Eastern Europe, and East Asia.
Impact on the Global Economy
Geopolitical events and conflicts have immediate and long-term economic consequences:
Financial Markets: Stock markets often react sharply to geopolitical uncertainty, while safe-haven assets like gold, government bonds, and certain currencies gain demand.
Commodity Prices: Conflicts involving energy-producing regions can cause oil, gas, and food prices to surge, fueling inflation.
Supply Chains: Wars, sanctions, and political tensions disrupt global supply chains, forcing companies to rethink sourcing and production strategies.
Investment Flows: Political instability discourages foreign investment and increases risk premiums.
For investors and traders, geopolitical risk has become a key factor in decision-making, alongside traditional economic indicators.
Humanitarian and Social Consequences
Beyond economics and politics, global conflicts have profound human costs. Armed conflicts lead to loss of life, displacement of populations, refugee crises, and long-term social trauma. Infrastructure destruction, food shortages, and healthcare disruptions often persist long after fighting ends.
International organizations, humanitarian agencies, and NGOs play vital roles in conflict zones, but their efforts are frequently constrained by security risks and political barriers.
Technology and Modern Warfare
Modern geopolitical conflicts increasingly involve technology rather than traditional battlefield engagements. Cyber warfare, misinformation campaigns, satellite disruptions, and economic coercion are now standard tools of statecraft. A conflict may unfold in cyberspace, financial systems, or media narratives long before—or instead of—physical confrontation.
This shift has blurred the line between war and peace, making geopolitical risk more complex and harder to predict.
Geopolitics in a Multipolar World
The world is gradually moving from a unipolar or bipolar structure toward a multipolar one, where multiple centers of power coexist. This transition increases uncertainty, as rules and norms are contested and alliances become more fluid.
At the same time, global challenges such as climate change, pandemics, and technological disruption require cooperation, even among rival states. This creates a paradox where competition and interdependence exist simultaneously.
Conclusion
Geopolitical events and global conflicts are central forces shaping the 21st century. They influence international relations, economic stability, technological progress, and human security. While conflicts often appear sudden, they are usually the result of long-term structural tensions rooted in geography, power, and interests.
Understanding geopolitics does not mean predicting every conflict, but it helps individuals and institutions make sense of global developments and manage risk more effectively. In an increasingly interconnected world, geopolitical awareness is no longer optional—it is essential for informed decision-making, whether in policy, business, investment, or everyday life.
Market Structure & Types of MarketsWhat Is Market Structure?
Market structure refers to the overall organization and behavior of a market. It explains how prices are formed, how trades occur, who participates, and how efficiently information is reflected in prices. Market structure influences liquidity, volatility, transaction costs, and transparency.
In financial markets, market structure is shaped by:
Number of buyers and sellers
Degree of competition
Availability of information
Entry and exit barriers
Trading mechanisms and regulations
Understanding market structure is especially important for traders because price movements, trends, and reversals are directly influenced by it.
Key Elements of Market Structure
1. Price Discovery
Price discovery is the process by which market prices are determined based on supply and demand. Efficient markets quickly reflect new information such as earnings, economic data, or geopolitical events.
2. Liquidity
Liquidity refers to how easily an asset can be bought or sold without significantly affecting its price. High liquidity means tighter bid-ask spreads and smoother price movements.
3. Volatility
Volatility measures the degree of price fluctuations. Certain market structures encourage stability, while others allow sharp price swings.
4. Transparency
Transparency indicates how easily participants can access information related to prices, volumes, and orders.
Types of Market Structure (Based on Competition)
1. Perfect Competition
In a perfectly competitive market:
There are many buyers and sellers
No single participant can influence prices
Products are homogeneous
Information is freely available
Although perfect competition is rare in financial markets, highly liquid markets like major forex pairs (EUR/USD) come close to this structure.
2. Monopoly
A monopoly exists when:
There is only one seller
High entry barriers exist
The seller controls pricing
In financial markets, pure monopolies are uncommon, but some exchanges or clearing corporations may show monopolistic characteristics due to regulatory control.
3. Oligopoly
An oligopoly involves:
A few dominant participants
High entry barriers
Interdependence among players
Investment banking, credit rating agencies, and large institutional trading often reflect oligopolistic structures.
4. Monopolistic Competition
This structure has:
Many sellers
Differentiated products
Moderate competition
Mutual funds, portfolio management services, and financial advisory firms operate under monopolistic competition.
Types of Markets (Based on Function)
1. Capital Market
The capital market deals with long-term funds and securities. It is divided into:
a) Primary Market
New securities are issued
Companies raise capital through IPOs, FPOs
Investors buy directly from issuers
b) Secondary Market
Existing securities are traded
Includes stock exchanges like NSE and BSE
Provides liquidity and price discovery
2. Money Market
The money market deals with short-term funds (up to one year).
Instruments include:
Treasury bills
Commercial papers
Certificates of deposit
Call money
Money markets are used by banks, financial institutions, and governments to manage short-term liquidity.
3. Derivatives Market
The derivatives market trades instruments whose value is derived from an underlying asset such as stocks, indices, commodities, or currencies.
Common derivatives include:
Futures
Options
Swaps
This market is widely used for hedging, speculation, and arbitrage.
4. Commodity Market
Commodity markets facilitate trading in physical goods like:
Gold, silver
Crude oil, natural gas
Agricultural products
They help producers and consumers manage price risk and ensure efficient allocation of resources.
5. Forex (Currency) Market
The forex market enables trading of currencies.
Key features:
Largest financial market in the world
Operates 24 hours
Highly liquid and decentralized
It plays a vital role in international trade and capital flows.
Types of Markets (Based on Market Conditions)
1. Bull Market
A bull market is characterized by:
Rising prices
Strong investor confidence
Economic growth
Investors focus on buying opportunities, trend-following strategies, and long-term investments.
2. Bear Market
A bear market shows:
Falling prices
Pessimism and fear
Weak economic indicators
Traders prefer short selling, defensive stocks, and capital preservation strategies.
3. Sideways or Range-Bound Market
In this market:
Prices move within a fixed range
No clear trend
Low volatility
Range trading, options strategies, and mean-reversion approaches work best here.
4. Volatile Market
A volatile market experiences:
Sharp price swings
High uncertainty
News-driven movements
Risk management becomes crucial, and position sizing plays a major role.
Types of Markets (Based on Trading Mechanism)
1. Exchange-Traded Market
Trades occur on regulated exchanges
Transparent pricing
Standardized contracts
Examples: NSE, BSE, CME
2. Over-the-Counter (OTC) Market
Trades occur directly between parties
Customized contracts
Less transparency
Forex forwards and interest rate swaps are common OTC instruments.
Importance of Understanding Market Structure
Understanding market structure helps:
Traders choose appropriate strategies
Investors manage risk effectively
Policymakers regulate markets efficiently
Institutions ensure fair and orderly trading
Market structure also determines how quickly information is reflected in prices, which directly affects profitability.
Conclusion
Market structure and types of markets form the foundation of financial systems. From capital markets and money markets to derivatives and forex, each market serves a unique purpose. Market structure defines how participants interact, how prices are discovered, and how efficiently markets function.
For traders and investors, understanding market structure is not optional—it is essential. It helps in selecting the right instruments, timing entries and exits, managing risk, and adapting strategies to different market conditions. A strong grasp of these concepts leads to better decision-making and long-term success in financial markets.

Reliance is leading the Fall in NiftyA possible Head & Shoulders formation will likely give confirmation.
Right Shoulder may form either near 1420 or 1530 with Neckline around 1335-1340.
Likely to terminate between 1110 to 1000.
View negates with a close above 1551.

Part 1 Intraday Institutional Trading Hedging with Options
Options are widely used for risk management.
Examples:
Buying put options to protect long equity portfolios
Using collars to limit upside and downside
Index puts for market crash protection
Hedging reduces returns slightly but protects capital, which is crucial for long-term survival.

Intermarket Analysis: A Complete GuideIntroduction
Intermarket Analysis is the study of relationships between different financial markets—such as equities, bonds, commodities, currencies, and interest rates—to understand the overall direction of the global economy and financial markets. Instead of analyzing a market in isolation, intermarket analysis assumes that all markets are interconnected and that price movements in one market often influence or predict movements in another.
For traders and investors, this approach provides context, confirmation, and often early warning signals. It is especially useful in identifying trends, risk-on/risk-off environments, sector rotation, and major market turning points.
Core Philosophy of Intermarket Analysis
The foundation of intermarket analysis rests on three key ideas:
Markets are globally connected
No market operates independently. Economic growth, inflation, monetary policy, and capital flows affect all asset classes.
Money flows between asset classes
Capital constantly shifts between stocks, bonds, commodities, and currencies based on risk appetite, interest rates, and economic expectations.
Leading and lagging relationships exist
Some markets move ahead of others. For example, bond yields often lead equity trends, and commodities often signal inflation before it appears in economic data.
The Four Major Asset Classes
1. Bonds (Interest Rates)
The bond market is often considered the smart money because it reacts quickly to changes in inflation, growth, and central bank policy.
Rising bond prices → Falling yields → Economic slowdown or risk aversion
Falling bond prices → Rising yields → Economic expansion or inflation expectations
Key Insight:
Bond yields often lead stock market trends. A sharp rise in yields can pressure equity valuations, while falling yields can support stocks—especially growth stocks.
2. Equities (Stocks)
Equities reflect expectations about corporate earnings, economic growth, and liquidity.
Strong stock markets → Economic expansion, risk-on sentiment
Weak stock markets → Economic contraction, risk-off sentiment
Intermarket analysis helps identify which sectors will outperform:
Rising yields → Banks, financials outperform
Falling yields → IT, FMCG, defensive sectors outperform
3. Commodities
Commodities are closely tied to inflation and economic demand.
Rising commodities → Inflationary environment, strong demand
Falling commodities → Deflationary pressures, weak demand
Important relationships:
Crude oil ↔ Inflation & transportation costs
Industrial metals (copper) ↔ Global growth
Gold ↔ Inflation, currency weakness, uncertainty
Copper is often called “Dr. Copper” because it acts as a barometer for global economic health.
4. Currencies (Forex)
Currencies reflect capital flows, interest rate differentials, and economic strength.
Strong currency → Capital inflows, higher interest rates
Weak currency → Capital outflows, inflation risk
Key relationships:
Strong USD → Pressure on commodities and emerging markets
Weak USD → Commodities and emerging markets outperform
In India’s context, USD/INR movements directly impact:
IT stocks (benefit from weaker INR)
Oil marketing companies (affected by stronger USD)
Classic Intermarket Relationships
Bonds vs Stocks
Falling yields usually support equities
Rising yields can hurt equity valuations
Sharp yield spikes often precede equity corrections
Commodities vs Bonds
Rising commodities → Inflation → Rising yields
Falling commodities → Disinflation → Falling yields
Gold vs Real Yields
Gold rises when real yields fall
Gold struggles when real yields rise
USD vs Commodities
Strong USD → Commodities fall
Weak USD → Commodities rise
Economic Cycle and Intermarket Behavior
Intermarket analysis aligns closely with the economic cycle:
1. Early Expansion
Bonds bottom, yields start rising
Stocks begin rallying
Commodities start stabilizing
2. Mid Expansion
Stocks strong
Commodities rising
Yields rising steadily
3. Late Expansion
Commodities peak
Inflation rises
Central banks tighten policy
4. Recession
Stocks fall
Bonds rally
Commodities decline
Gold often outperforms
Understanding where the economy stands helps traders position correctly across markets.
Sector Rotation Using Intermarket Analysis
Capital rotates between sectors depending on intermarket signals:
Rising yields → Banks, capital goods, PSU stocks
Falling yields → IT, FMCG, pharma
Rising oil → Energy stocks outperform
Rising metals → Metal and mining stocks outperform
This approach is widely used by institutional investors to allocate capital efficiently.
Intermarket Analysis for Traders
For Swing & Positional Traders
Use bond yields to confirm equity trends
Watch USD index before trading commodities
Use gold as a hedge during volatility
For Intraday Traders
Pre-market global cues (US bonds, crude oil, Asian markets)
Currency movement impact on index futures
Risk sentiment from US markets
Advantages of Intermarket Analysis
Provides big-picture context
Helps avoid false breakouts
Improves trade confirmation
Identifies early trend reversals
Enhances risk management
Limitations of Intermarket Analysis
Relationships are not fixed forever
Short-term noise can distort signals
Requires understanding of macroeconomics
Not ideal as a standalone trading system
Best Practice:
Use intermarket analysis alongside technical analysis, volume analysis, and price action.
Conclusion
Intermarket Analysis is a powerful framework that helps traders and investors understand why markets move, not just how they move. By studying the interaction between bonds, equities, commodities, and currencies, one can gain deeper insight into economic conditions, capital flows, and market psychology.
In modern markets—where global events, central bank decisions, and capital mobility dominate—intermarket analysis is no longer optional. It is an essential skill for anyone aiming to trade or invest with confidence, discipline, and a long-term edge.

The Global IPO Market1. What Is an IPO & Why It Matters
An Initial Public Offering (IPO) is when a private company offers its shares to the public for the first time by listing on a stock exchange. It allows companies to raise capital from a broad investor base, provides liquidity to early investors and employees, and increases visibility and credibility. In return, public markets demand transparency, regulatory compliance, and ongoing disclosure.
IPOs serve as a crucial mechanism in global finance for capital formation, enabling companies to fund expansion, repay debt, invest in research and development, and pursue acquisitions. For investors, IPOs can offer growth opportunities—especially if the company scales rapidly post‑listing.
2. How the Global IPO Market Works
Key Participants
Issuing Company (Issuer): Seeks capital through a public listing.
Underwriters/Investment Banks: Advise on pricing, structure the deal, and sell shares to institutional and retail investors.
Stock Exchanges: Provide the platform for listing (e.g., NYSE, Nasdaq, HKEX).
Regulators: Oversee disclosure and compliance (e.g., SEC in the U.S.).
Investors: Institutional (mutual funds, hedge funds) and retail investors who buy shares.
Process Overview
Preparation: Financial audits, governance structures, and prospectus creation.
Due Diligence: Underwriters evaluate company financials and market potential.
Marketing (Roadshow): Presenting the investment case to potential investors.
Pricing: Shares are priced based on demand and valuation metrics.
Listing: Shares begin trading publicly, often with first‑day “pop” or volatility.
The success of an IPO depends on market conditions, investor appetite, sector momentum, and broader economic trends.
3. Current Trends in the Global IPO Market (2025)
Overall Market Health
After years of caution driven by geopolitical tensions, interest rate uncertainty, and volatility, 2025 saw a stabilizing and resilient global IPO market. According to data from EY’s Global IPO Trends, there were approximately 1,293 IPOs raising US$171.8 billion globally in 2025, signaling renewed confidence and a shift toward higher‑quality offerings.
This continues a trend of recovery following slow periods in 2022–24. While not yet at the frothy peaks of the 2021 boom, IPO markets are showing strength characterized by larger deal sizes and selective investor interest in standout companies.
Volume vs. Proceeds
Data indicates that while the number of IPOs hasn’t surged dramatically, total capital raised is increasing—reflecting a shift toward larger, more established issuers deciding to go public rather than many small firms. This is a key metric of market maturity and investor selectivity.
Cross‑Border Listings
Companies increasingly choose to list on foreign exchanges—a trend especially evident in the U.S. This can enhance liquidity and broaden the investor base. Cross‑border IPOs reached multi‑decade highs in 2025, highlighting globalization within equity capital markets.
Sector Focus
Major IPO activity is concentrated in sectors that attract investor interest, such as:
Technology & AI: Companies tied to digital transformation.
Fintech: Financial technology firms tapping broader capital markets.
Healthcare & Life Sciences: Biotech and life science companies.
Industrials & Consumer Goods: Established firms with strong growth plans.
4. Regional Dynamics
Asia‑Pacific
Asia continues to be a powerhouse in IPO activity.
Greater China (including Hong Kong and mainland China) has emerged as a dominant source of IPO proceeds, capturing around one‑third of global capital raised in the first half of 2025.
Hong Kong Exchange (HKEX) has enjoyed strong listings in 2025, with companies raising significant capital — reflecting confidence in Asia’s public markets.
India has also shown strong IPO volume and improvement in fundraising, trending toward record years and ranking among the top global IPO markets.
This reflects broader economic growth in the region, deepening equity markets, and policy frameworks aimed at attracting listings.
United States
The U.S. traditionally leads global IPO markets in capital raised thanks to large tech and growth company listings:
The U.S. recorded strong IPO volumes in early to mid‑2025—the highest since 2021 in some quarters.
Some of the most anticipated potential IPOs (e.g., SpaceX) could redefine market scale if they materialize.
However, intermittent challenges like regulatory slowdowns (e.g., government shutdowns affecting the SEC) have occasionally slowed the pace of launches.
Europe
Europe’s IPO market remains smaller relative to Asia and the U.S. but showed record momentum at the start of 2026 with major industrial and defense listings.
Emerging Markets
Latin America, the Middle East, and other emerging regions see sporadic but noteworthy IPOs, with firms choosing international listings to access deeper capital pools.
5. Major Recent IPOs & Signals
2026 Activity Indicators
Even in early 2026, new signs of life include:
PicPay’s Nasdaq IPO marking a return of Brazilian companies to public markets after a multi‑year break.
Agibank’s planned U.S. IPO underlining fintech interest from Latin America.
Busy Ming’s successful Hong Kong IPO showing continued appeal of Asian listings.
These signals reflect a nuanced landscape where IPOs are widely spread across sectors and geographies.
6. Challenges Facing the IPO Market
Despite improvements, the global IPO market faces several persistent challenges:
Market Volatility & Economic Uncertainty
Global macroeconomic uncertainty—driven by tariffs, interest rate shifts, and geopolitical tensions—has made companies more cautious about listing timing.
Regulatory & Compliance Pressures
Companies face rising compliance costs and investor demands for transparency and ESG (environmental, social, governance) disclosures—both prerequisites for modern listings.
Investor Selectivity
Investors increasingly focus on firm quality, profitability pathways, and sustainability of growth. Firms with weak fundamentals or unclear growth prospects often delay or cancel IPO plans.
Valuation Concerns
High valuation expectations by private companies sometimes misalign with market realities, leading to postponed listings or sub‑par performances post‑IPO.
7. The Future Outlook
The outlook for the global IPO market remains cautiously optimistic, with several key forces shaping its trajectory:
Strong Pipelines
Many large private companies (especially in tech, fintech, and biotech) remain IPO candidates. As markets stabilize, these firms may enter public markets—potentially providing a meaningful uplift to aggregate proceeds.
Innovation & New Sectors
New sectors like AI, green tech, and biotech are attracting investors and may lead to new high‑value IPOs.
Geographic Shifts
Asia’s increasing share and cross‑border listings suggest a more balanced global IPO market, reducing reliance on single regions.
Economic Policies
If monetary easing continues and geopolitical tensions reduce, IPO markets are likely to see further expansion in both number and value of offerings.
8. Conclusion
The global IPO market in the mid‑2020s has shifted from the uncertainty of the early 2020s to a phase of resilience and cautious expansion. While market volatility and external economic pressures remain challenges, structural improvements, stronger investor sentiment, and megadeals in promising sectors suggest a maturing market with significant future capital formation potential.
Whether for young innovators or established industrial firms, the IPO remains a central pillar of global capital markets—connecting companies with investors and driving growth across regions and industries.
