Global Market Impact on Indian EquitiesIntroduction
Global financial markets are a tightly interconnected web of economies, financial institutions, businesses, and individual traders. In this interconnected environment, events occurring in one part of the world can rapidly ripple through others — impacting prices, influencing trader sentiment, and shaping investment decisions. This phenomenon is referred to as global market impact in trading.
For traders, understanding global market impact is critical. Whether you are a retail intraday trader, a swing trader, or a fund manager dealing with derivatives or equities, global events, policies, and economic conditions shape the outcomes of your trades more than ever before.
This article breaks down the various dimensions of global market impact in trading, its causes, mechanisms, and the tools traders use to monitor and manage it.
1. What Is Global Market Impact in Trading?
Global market impact refers to the influence of international events, policies, macroeconomic data, or market sentiment on financial markets across the globe. In today’s trading world, markets no longer operate in isolation. A U.S. Federal Reserve rate hike, a geopolitical crisis in the Middle East, or a slowdown in Chinese manufacturing can impact the price of Indian equities, European bonds, or Japanese yen.
Key aspects include:
Cross-border capital flows
Currency fluctuations
Commodity price changes
Global monetary policy alignment
Political and economic stability
2. Key Global Factors That Impact Trading
a) Central Bank Policies
Major central banks like the U.S. Federal Reserve, European Central Bank (ECB), Bank of Japan, and People’s Bank of China drive interest rates and liquidity across the globe.
Example:
If the Federal Reserve hikes interest rates, it strengthens the U.S. dollar. Emerging markets like India or Brazil may see capital outflows as investors pull money out in favor of U.S. assets.
A dovish stance, on the other hand, promotes risk-taking, benefiting equity markets globally.
b) Macroeconomic Indicators
Economic indicators such as:
U.S. Jobs Report (NFP)
China's GDP growth
EU Inflation Rates
India’s Trade Deficit
...are closely watched.
These data points shape market sentiment about growth, inflation, and monetary tightening or easing.
Example:
A better-than-expected U.S. jobs report often boosts the U.S. dollar and Treasury yields while negatively affecting risk-sensitive assets like tech stocks or emerging market equities.
c) Geopolitical Events
Political tensions, wars, trade conflicts, and sanctions are major disruptors in financial markets.
Examples:
Russia-Ukraine conflict affected global energy prices.
Israel-Palestine tensions spike oil prices.
U.S.-China trade war caused volatility in tech and commodity sectors.
Geopolitical risks lead to risk-off sentiment where investors flock to safe-haven assets like gold, USD, or U.S. Treasuries.
d) Commodity Prices
Global commodity prices affect trade balances, inflation, and corporate profitability.
Crude Oil: Impacts inflation, logistics, airline costs, and government subsidies.
Gold: A safe haven in uncertain times.
Copper & Industrial Metals: Indicators of industrial growth.
Agricultural Commodities: Affect food inflation and FMCG stocks.
e) Global Stock Market Movements
Global indices like Dow Jones, Nasdaq, S&P 500, FTSE, DAX, Nikkei, and Shanghai Composite influence local indices.
Example:
If the U.S. market falls sharply due to inflation data, expect Asian and European markets to open lower the next day.
3. Market Interlinkages and Transmission Mechanism
a) Time Zone Transmission
Asian markets react first to U.S. events overnight.
European markets adjust mid-day.
U.S. markets close the global trading loop.
b) Sectoral Interconnections
Global tech sell-offs affect Indian IT stocks (Infosys, TCS).
Crude oil spikes benefit ONGC but hurt aviation stocks like Indigo.
Weak Chinese industrial demand hits metals and mining stocks globally.
c) Currency Impact
Foreign investors convert capital into local currencies to invest. Currency fluctuations due to global sentiment affect:
Import/export cost structures
Inflation levels
FII/DII inflows and outflows
4. Case Studies: Real-World Global Market Impacts
Case 1: COVID-19 Pandemic (2020)
Global lockdowns crashed demand.
Equity markets worldwide fell 30-40%.
Central banks slashed interest rates, started QE.
Commodity prices, especially oil, collapsed.
Gold hit record highs due to risk aversion.
Case 2: Russia-Ukraine War (2022)
Crude oil and natural gas prices spiked.
European energy crisis erupted.
Indian markets saw massive FII outflows.
Defense, energy, and fertilizer stocks surged globally.
Case 3: Silicon Valley Bank Collapse (2023)
Triggered fears of a banking crisis.
Tech-heavy indices like Nasdaq corrected.
Central banks slowed rate hikes.
Bank stocks fell across Europe and Asia.
5. Tools to Track Global Market Impact
a) Economic Calendars
Track global macroeconomic events:
Fed decisions
ECB policy meetings
GDP releases
CPI, PPI, PMI data
Popular tools: TradingEconomics, Forex Factory, Investing.com
b) Global Market Indices
Track global indices pre-market:
Dow Futures
Nasdaq Futures
GIFT Nifty (India)
FTSE, DAX (Europe)
c) Currency Pairs
Watch major FX pairs:
USD/INR
USD/JPY
EUR/USD
USD/CNH
Currency trends show global capital movement and risk appetite.
d) Commodities Prices
Crude Oil (WTI, Brent), Gold, Silver, Copper, Natural Gas
These commodities impact inflation expectations and sector-specific moves.
e) VIX – Volatility Index
The "Fear Gauge" of global markets.
U.S. VIX rising = risk aversion = global sell-off.
India VIX = local market fear indicator.
6. Impact on Indian Markets
a) FII/DII Flows
Foreign Institutional Investors (FIIs) react to global yields, risk, and currency strength.
When U.S. bond yields rise, FIIs often withdraw from Indian markets.
DII flows often stabilize markets in FII-driven volatility.
b) Currency & Bond Market
USD/INR volatility is affected by global trade deficits, oil prices, and dollar strength.
RBI intervenes to prevent sharp rupee depreciation.
c) Sector-Specific Impact
IT Sector: Linked to U.S. tech spending.
Pharma: Impacted by U.S. FDA approvals and global demand.
Oil & Gas: Affected by Brent Crude prices.
Metals: Linked to Chinese industrial demand.
Conclusion
In today’s trading ecosystem, no market is an island. Global market impact is real, dynamic, and powerful. Traders and investors who ignore international developments risk being blindsided by overnight crashes, unexpected rallies, or economic shocks.
Being globally aware doesn’t mean you have to trade every event — it means integrating global understanding into your risk management, trade planning, and market expectations.
From the Fed's interest rate policy to geopolitical tensions in the Middle East, from a commodity rally in China to currency devaluation in Japan — everything is interconnected. Smart trading today requires a global lens with a local execution strategy.
RIGD trade ideas

Algo-Based Options Trading & AutomationIn the modern trading landscape, technology is not just a supporting tool—it’s the central force reshaping how markets function. Nowhere is this more visible than in options trading, where algorithmic trading (or “algo trading”) is taking over traditional manual strategies. With increased speed, accuracy, and scalability, automation in options trading is transforming retail and institutional participation alike.
This guide breaks down everything you need to know about algo-based options trading: what it is, how it works, what strategies are used, its pros and cons, and how automation is practically implemented in today's markets.
1. What is Algo-Based Options Trading?
Algo-based options trading involves using computer programs to execute options trades based on pre-defined rules and mathematical models. These programs analyze market data, identify trading signals, and place orders automatically—often much faster and more accurately than humans can.
The key components include:
Predefined logic or strategy (e.g., "Buy a call option when RSI < 30 and price is above 50-DMA")
Real-time market data feed
Execution engines that place and manage orders without manual intervention
Risk management modules to monitor exposure, margin, and stop-losses
2. Why Use Algo Trading in Options Instead of Manual Trading?
Options are complex instruments. Their prices are influenced by multiple variables like time decay, implied volatility, strike price, delta, gamma, and more.
Humans can’t always process this data fast enough, especially during high-volatility events. Here’s where algos shine:
Manual Trading Algo Trading
Emotion-driven Emotionless and consistent
Slower execution Millisecond-level speed
Prone to fatigue Runs 24/7 without breaks
Hard to backtest Easily backtested and optimized
Limited scalability Can manage thousands of trades simultaneously
3. Core Components of an Options Algo Trading System
To build or understand an automated options trading system, it’s essential to know its primary components:
A. Strategy Engine
This is the brain of the system. It defines:
Entry/Exit conditions (based on indicators like RSI, MACD, IV percentile, etc.)
Type of options to trade (call, put, spreads, straddles, etc.)
Timeframe (intraday, weekly, monthly)
Underlying asset and strike price selection logic
B. Data Feed & Market Scanner
Live option chain data from exchanges like NSE or brokers like Zerodha, Upstox
IV, OI, delta, gamma, theta, vega data
Historical data for backtesting
C. Order Management System (OMS)
This handles:
Order placement
Modifications (e.g., SL changes)
Cancel/re-entry logic
Smart order routing (SOR)
D. Risk Management Module
Risk management is critical. The automation should enforce:
Maximum daily loss limits
Exposure per trade
Position sizing based on capital
Portfolio hedging logic
E. Logging and Monitoring
Every trade, price, and action is logged for audit and improvement. Some systems send alerts via Telegram, email, or SMS.
4. Common Algo Strategies Used in Options Trading
1. Delta-Neutral Strategies
Goal: Profit from volatility while maintaining a neutral directional view.
Examples: Straddle, Strangle, Iron Condor
How Algos Help: Adjust delta automatically by hedging with futures or adding more legs
2. Trend Following with Options
Algos can detect breakouts and directional momentum and buy/sell options accordingly.
Example: Buy call when price crosses above 20-DMA and volume spikes
Add-ons: Use trailing SLs, exit when RSI > 70
3. Option Scalping
Used in very short timeframes (1m, 5m candles). Algo enters/exits trades rapidly to capture small moves.
Needs: Super-fast execution and co-location
Popular in: Weekly expiry trading
4. IV-Based Mean Reversion
Buy when Implied Volatility (IV) is abnormally low or sell when it’s high.
Algos monitor: IV percentile, skew, vega exposure
5. Open Interest & Volume Based Strategies
Breakout Strategy: Detect long buildup or short covering using OI change + price movement
Algo filters trades: Where volume > 2x average and OI shows new positions being created
5. Platforms and Tools for Algo Options Trading
Even retail traders can now access automation tools without knowing how to code.
No-Code Platforms:
Tradetron
Streak by Zerodha
AlgoTest
Quantiply
These platforms offer:
Drag-and-drop strategy builders
Live market connections
Backtesting features
Broker integrations
Custom Python/C++ Based Systems
Used by advanced retail or prop firms. These offer:
Full control and flexibility
Integration with APIs like:
Zerodha Kite Connect
Upstox API
Interactive Brokers
Summary and Final Thoughts
Algo-based options trading is not just for hedge funds anymore. With accessible platforms, cloud computing, and APIs, even retail traders can build, test, and deploy automated strategies.
However, success in algo trading depends on:
Solid strategy design (math + market logic)
Risk management above all
Continuous monitoring and iteration
Avoiding over-reliance on backtests
Staying compliant with broker and SEBI norms
Day Trading vs. Swing Trading1. Understanding the Basics
Day Trading
Day trading refers to the buying and selling of financial instruments—such as stocks, options, futures, or currencies—within the same trading day. A day trader closes all positions before the market closes to avoid overnight risk.
Key Features:
No positions held overnight.
Trades last from a few seconds to several hours.
High number of trades per day.
Requires constant monitoring of charts and market movements.
Swing Trading
Swing trading is a medium-term trading strategy that involves holding positions for several days to weeks to capture price “swings” or short-term trends.
Key Features:
Positions held for a few days to a few weeks.
Fewer trades than day trading.
Less screen time required.
Relies on technical and sometimes fundamental analysis.
2. Time Commitment
Day Trading
Day trading is a full-time job. Traders must monitor markets in real-time, react instantly to price movements, and manage trades proactively. It demands:
Quick decision-making.
High focus and attention.
The ability to execute trades at optimal times, sometimes within seconds.
Because of the time sensitivity, most day traders operate during regular market hours (e.g., 9:30 AM to 4:00 PM EST for U.S. stocks).
Swing Trading
Swing trading allows for greater flexibility. Since positions are held over several days, traders do not need to watch the market constantly. Time is mainly spent:
Analyzing charts after market hours.
Setting up trades in advance using limit and stop orders.
Reviewing economic news and fundamental data.
Swing trading can be compatible with part-time or full-time work outside of trading.
3. Strategy and Technical Tools
Day Trading Strategies
Day traders rely on:
Scalping: Very short-term trades to capture small price movements.
Momentum Trading: Capitalizing on stocks moving with high volume.
News-Based Trading: Reacting quickly to economic data or company announcements.
Technical Indicators: Tools like VWAP, RSI, MACD, Bollinger Bands, and moving averages for quick decision-making.
Speed and precision are critical, and traders often use level II quotes and advanced charting tools to gain an edge.
Swing Trading Strategies
Swing traders use:
Trend Following: Riding short-term uptrends or downtrends.
Support and Resistance: Buying near support and selling near resistance.
Technical Breakouts: Entering trades after a price breaks out from a consolidation pattern.
Chart Patterns: Recognizing setups like flags, pennants, head-and-shoulders, etc.
Indicators: RSI, MACD, Fibonacci retracement, and moving averages to confirm setups.
Swing traders focus more on price patterns and market psychology than minute-by-minute movement.
4. Risk and Reward
Day Trading
Risk: High. Rapid price fluctuations can lead to quick losses. The use of leverage increases exposure.
Reward: Potentially high daily returns, but gains are often incremental per trade.
Stop-Losses: Tight stop-losses are used due to small trade windows.
Risk Management: Requires precise entry/exit rules and strict discipline.
Because of frequent trading, day traders also face:
Slippage and commissions (though less of a concern with modern brokerages offering zero commission).
Mental fatigue and the temptation to overtrade.
Swing Trading
Risk: Moderate to high, depending on market conditions.
Reward: Trades aim to capture larger price movements, so the reward per trade is generally higher.
Stop-Losses: Wider stops to account for multi-day price fluctuations.
Risk Management: Requires patience, tolerance for volatility, and a solid trading plan.
Swing traders are vulnerable to overnight gaps, where unexpected news moves the market while it’s closed.
5. Tools and Platforms
Day Traders Need:
High-speed internet.
Direct-access trading platform with low latency.
Real-time news feeds (e.g., Bloomberg, Benzinga).
Advanced charting and order types.
Broker with low commissions and fast execution.
Swing Traders Need:
Reliable charting tools (e.g., TradingView, ThinkOrSwim).
Access to both technical and fundamental data.
Broker that supports extended hours trading.
Alerts and scanners to identify setups.
Swing traders may prioritize platforms with good research tools, while day traders focus on speed and customization.
6. Psychology and Personality Fit
Day Trading Personality:
Thrives under pressure and fast decision-making.
Can handle rapid losses without panic.
Enjoys active involvement and quick feedback.
Highly disciplined with emotional control.
This style is not suitable for those prone to stress, impulsiveness, or emotional reactions.
Swing Trading Personality:
Patient and analytical.
Comfortable holding positions overnight and through small drawdowns.
Able to wait for setups and follow a plan without micromanaging.
Less prone to overtrading.
This style is ideal for people who enjoy structure and can detach from market noise.
Crypto Market Recovery & Tokenized AssetsIntroduction
The cryptocurrency industry is known for its volatility and cyclical nature. Following periods of intense speculation and growth often come downturns, leading to what the community refers to as "crypto winters." However, the resilience of blockchain technology and the consistent innovation in the space have allowed it to recover from downturns repeatedly. Currently, we are witnessing signs of another crypto market recovery, buoyed by several factors, one of the most significant being the rise of tokenized assets. This convergence of market rebound and tokenization could redefine the future of finance.
This article delves into the causes and signs of the current crypto market recovery and explores the growing phenomenon of tokenized assets, highlighting how the two trends are intricately linked.
Part 1: Understanding the Crypto Market Recovery
1.1 The Cyclical Nature of the Crypto Market
Cryptocurrency markets have gone through several cycles:
Bull Markets – Characterized by soaring prices, mainstream interest, and speculative investment.
Bear Markets (Crypto Winters) – Marked by declining prices, reduced investor confidence, and contraction of the ecosystem.
Despite these swings, each downturn has historically led to a stronger resurgence, driven by real innovation, broader adoption, and better regulatory clarity.
1.2 The Most Recent Downturn
The latest bear market (2022–2023) was triggered by a mix of global macroeconomic challenges and internal crises within the crypto industry. Key events included:
The collapse of major entities like Terra (LUNA) and FTX.
Heightened regulatory scrutiny, especially in the US.
Inflation and rising interest rates that dampened risk asset appetite.
These events shook investor confidence and led to significant capital outflows.
1.3 Early Signs of Recovery
Starting in late 2023 and continuing into 2025, there have been growing signs of a market recovery:
Bitcoin and Ethereum price rebounds: Bitcoin has crossed significant psychological thresholds again, indicating renewed investor interest.
ETF Approvals: Regulatory green lights for Bitcoin and Ethereum spot ETFs in the US and other jurisdictions have brought institutional legitimacy.
Venture Capital Returns: More VC funds are re-entering the crypto space, targeting infrastructure, AI integration, and tokenization.
Institutional Adoption: Banks and financial institutions are increasing their exposure to crypto through custodial services and tokenization pilots.
1.4 Regulatory Clarity and Market Maturity
A more defined regulatory environment is also helping the market stabilize. Jurisdictions like the European Union with MiCA (Markets in Crypto-Assets Regulation) and progressive stances from Hong Kong and the UAE are providing legal frameworks that encourage innovation while protecting investors.
Part 2: The Rise of Tokenized Assets
2.1 What Are Tokenized Assets?
Tokenized assets refer to real-world assets (RWAs) represented digitally on a blockchain. These can include:
Real estate
Commodities
Stocks and bonds
Art and collectibles
Fiat currencies (as stablecoins)
By using blockchain technology, tokenized assets become programmable, divisible, and easily tradable across global platforms.
2.2 How Tokenization Works
The process of tokenization typically involves:
Asset Identification – Determining which real-world asset will be tokenized.
Valuation – Assessing the asset’s value, either through markets or third-party appraisals.
Token Creation – Issuing digital tokens that represent ownership or rights tied to the real asset.
Smart Contracts – Embedding the rules and rights associated with the asset into the token using blockchain protocols.
Custody and Compliance – Ensuring legal enforceability and regulatory compliance.
2.3 Benefits of Tokenized Assets
Increased Liquidity – Illiquid assets like real estate become tradable.
Fractional Ownership – Investors can buy portions of an asset, lowering entry barriers.
24/7 Trading – Markets can function outside traditional business hours.
Global Accessibility – Cross-border investment becomes frictionless.
Transparency – Transactions are visible and auditable on public blockchains.
2.4 Tokenization and DeFi (Decentralized Finance)
Tokenized assets are also finding a home in the DeFi ecosystem. They can be used as collateral, traded on DEXs (Decentralized Exchanges), or integrated into lending and yield farming protocols.
Part 3: Key Players and Use Cases in Tokenization
3.1 Institutional Adoption
Major financial institutions are entering the tokenization space:
BlackRock and Fidelity have shown strong interest in tokenized bonds and ETFs.
JPMorgan uses its Onyx platform for tokenized asset settlement.
Franklin Templeton launched a tokenized US government money market fund on the Stellar blockchain.
HSBC, UBS, and Goldman Sachs are piloting tokenization in private markets and real estate.
3.2 Government and Public Sector Involvement
Singapore’s Project Guardian and Switzerland’s SIX Digital Exchange (SDX) are spearheading public-private initiatives.
Hong Kong issued tokenized green bonds in a blockchain pilot to modernize capital markets.
The European Central Bank (ECB) is exploring how tokenized assets might integrate into future digital euro ecosystems.
3.3 Real-World Applications
Real Estate: Platforms like RealT and Lofty allow fractional ownership of U.S. real estate using blockchain tokens.
Commodities: Gold-backed tokens (like Paxos Gold) offer exposure to physical gold.
Collectibles: Artworks and rare items are being tokenized and sold as NFTs with shared ownership rights.
Private Equity: Startups and SMEs can raise funds by issuing equity tokens instead of going through traditional IPOs.
This bridges traditional finance and DeFi, making financial services more inclusive and efficient.
Conclusion
The recovery of the crypto market and the emergence of tokenized assets are two of the most important trends shaping the next generation of global finance. As regulatory clarity improves and infrastructure matures, tokenization will likely become the bridge between traditional and decentralized finance.
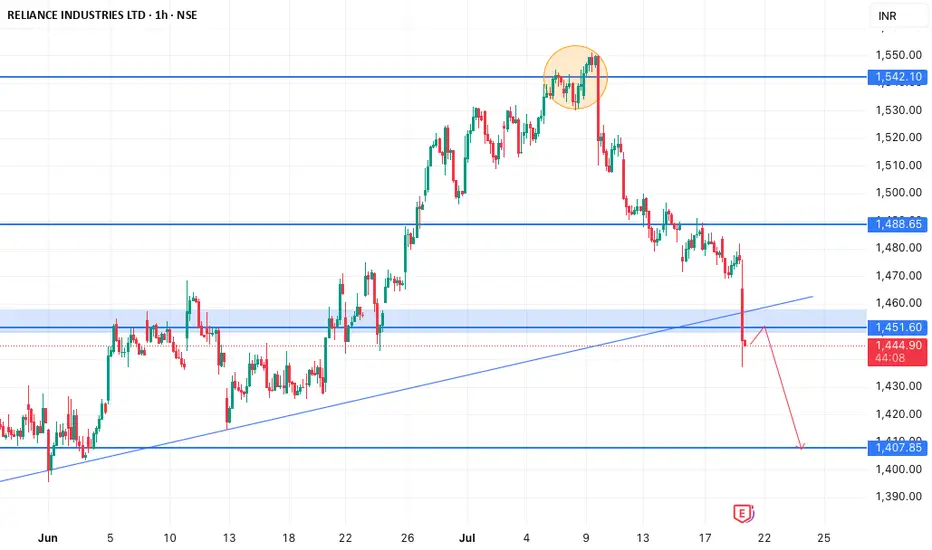
RELIANCE | LONG | INTRADAY | BTSTRELIANCE has corrected sharply this month. However, looking at the price structure, I strongly feel that this should be the end of the correction.
It has taken a support at the 200 DEMA as well.
A reversal Long trade is setting up on an Intraday or BTST basis for a Target to 1417 price level.
Option spreads can be used.
P.S. Not a recommendation. Pls do your own due diligence.

Market Types1. Stock Markets
The stock market is perhaps the most well-known type of financial market. It provides a platform for buying and selling shares of publicly traded companies.
Types of Stock Markets
Primary Market: Where new shares are issued (IPOs).
Secondary Market: Where existing shares are traded among investors.
2. Forex (Foreign Exchange) Markets
The foreign exchange market is the largest and most liquid financial market in the world, with daily trading volumes exceeding $6 trillion.
How It Works
Currencies are traded in pairs (e.g., EUR/USD), where one currency is exchanged for another. The forex market is decentralized, operating 24 hours a day across major global financial centers.
3. Commodities Markets
Commodities markets allow traders to buy and sell raw materials or primary agricultural products.
Categories
Hard commodities: Gold, silver, oil, natural gas
Soft commodities: Coffee, cocoa, wheat, cotton
4. Derivatives Markets (Futures and Options)
Derivatives are financial instruments whose value is derived from an underlying asset such as stocks, commodities, currencies, or indices.
Futures
Contracts obligating the buyer to purchase an asset (or seller to sell) at a predetermined price at a specified time.
Options
Contracts that give the right, but not the obligation, to buy/sell an asset at a set price within a specific period.
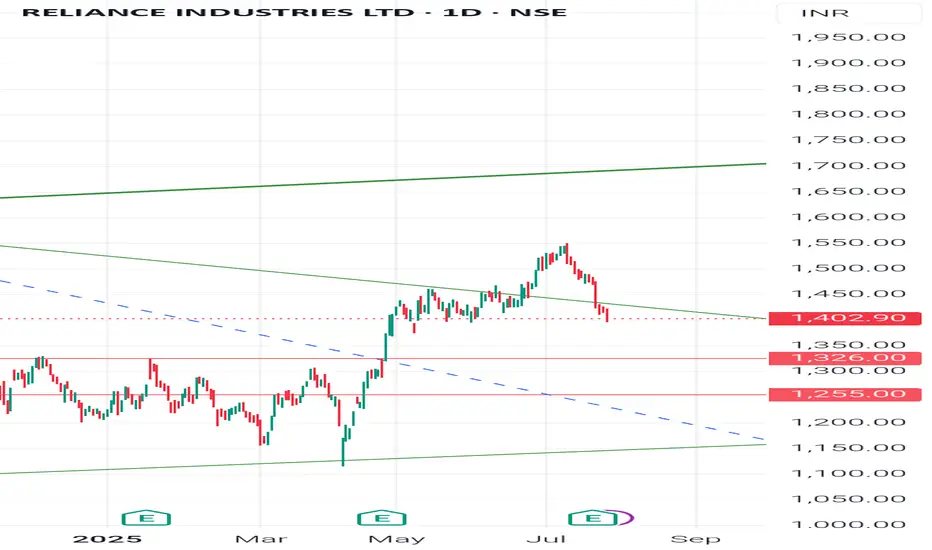
Reliance Industries: Short pattern 1409_1418 stop 1445Reliance Industries: Short pattern 1409_1418 stop 1445 near support is 1326..
It's just a learning basis the trend and technical analysis.
Keep watching out here👍

Institutional Trading Strategies🔍 What Is Institutional Trading?
Institutional trading refers to how large financial institutions, such as hedge funds, investment banks, mutual funds, insurance companies, and pension funds, buy and sell large volumes of stocks, options, futures, and other financial instruments in the market.
Unlike retail traders (individual traders), institutions trade with massive capital, often in millions or billions of dollars. Their actions can move the market, and they use advanced tools, data, and strategies to protect their capital and maximize profit.
🏦 Who Are the Institutional Players?
Here are examples of institutional traders:
BlackRock
Vanguard
JP Morgan
Goldman Sachs
Citadel
Morgan Stanley
HDFC AMC / SBI MF (India context)
These entities manage huge portfolios for clients or for themselves and use highly strategic methods to execute trades.
⚙️ Why Are Their Strategies Different?
Institutional traders have several advantages over retail traders:
Access to better data (real-time order flow, economic models)
Advanced technology (high-frequency trading algorithms)
Lower transaction costs (thanks to bulk volume deals)
Connections (direct access to liquidity providers, brokers)
Skilled teams (analysts, quant traders, risk managers)
But there’s a big challenge: Their trades are so large, they can’t buy or sell in one go. If they do, they’ll cause huge price moves (called slippage). So they use smart strategies to enter and exit positions quietly without alerting the market.
🧠 Core Institutional Trading Strategies
Here are the most important trading strategies used by institutions:
1. 📊 Volume-Based Trading (Accumulation & Distribution)
Institutions use a strategy of accumulating large positions over time (buying slowly) and later distributing (selling slowly). This is done to hide their true intent from the market.
Accumulation Phase: Buying gradually in small chunks to avoid price spikes.
Distribution Phase: Selling in a quiet way so they don’t crash the price.
They might accumulate shares for weeks or months, often using dark pools or algorithms to keep their activity hidden.
2. 🏦 Order Flow Analysis / Tape Reading
Institutional traders track real-time order flow — meaning they study the buy/sell pressure using tools like:
Level 2 (market depth)
Time & sales (ticker tape)
Footprint charts
Delta volume
They watch where large orders are being placed, pulled, or spoofed, giving insight into what other big players are doing.
3. 💻 Algorithmic & High-Frequency Trading (HFT)
Institutions use algorithms (algos) to place thousands of trades per second. These bots follow specific rules based on:
Market trends
Arbitrage opportunities
Statistical models
HFT strategies are extremely fast, aiming to profit from tiny price differences in milliseconds.
4. 🧱 Quantitative Trading
Quant funds like Renaissance Technologies or D.E. Shaw use math, coding, and machine learning to create models that predict price movements.
They may build systems that factor in:
Price action history
News sentiment
Economic indicators
Correlation between assets
Volatility, interest rates
These are not human trades – the models execute trades based on data patterns.
5. 🧩 Options-Based Hedging Strategies
Institutions use options to hedge, speculate, or generate income.
Common techniques:
Protective Puts (insurance for falling stocks)
Covered Calls (collect premium for sideways movement)
Calendar Spreads, Iron Condors, etc. (advanced strategies for theta/gamma/vega exposure)
They often create multi-leg options positions to reduce risk and take advantage of implied volatility.
6. 🏰 Dark Pools Trading
Institutions often trade through dark pools, which are private exchanges not visible to the public. These are used to place large orders without revealing size, so other traders don’t front-run their positions.
Example: An institution may buy 1 million shares through a dark pool instead of a public exchange like NSE or NYSE.
7. 📍 Sector Rotation Strategy
Institutions frequently rotate their capital between sectors based on economic cycles.
In recession: move to defensive stocks (FMCG, Pharma)
In recovery: switch to cyclicals (automobile, banking, infrastructure)
They allocate billions of dollars based on macro themes, earnings cycles, and geopolitical shifts.
8. 🔁 Rebalancing Portfolios
Large funds constantly rebalance their portfolios — buying/selling assets to maintain target allocations. This causes monthly/quarterly flows in stocks or ETFs, which can influence price significantly.
Traders often try to anticipate these flows and trade in the same direction.
📉 How Institutional Traders Enter Positions Quietly
Let’s break down a common stealth strategy:
📘 Step-by-Step Accumulation Example:
Stock ABC trades at ₹100.
Institution wants to buy 5 lakh shares.
If they buy all at once, the price may jump to ₹110+.
So they:
Break order into 5,000 share blocks
Buy at different times of day
Use different brokers/accounts to hide volume
Buy some shares in dark pool
Use algorithm to monitor market depth
After 2 weeks, they complete the buy at an average price of ₹101.
Once they have the position, they might release news or earnings upgrades to support the price.
They hold till price hits their target (say ₹130), then start distributing in small blocks again.
👁 How to Spot Institutional Activity as a Retail Trader?
While you can’t directly see them, you can learn to follow the footprints:
🔍 Clues of Smart Money Activity:
Unusual volume on low-news days
Breakout with high volume but small price move
Price holding key levels repeatedly (support/resistance)
Option open interest buildup
Low volatility periods followed by volume spike
Multiple rejections from the same price zone (indicating accumulation/distribution)
🧠 Mindset of Institutional Traders
What makes institutions successful is not just tools or money — it’s their discipline, planning, and patience. Key principles:
Capital preservation first
Risk-to-reward must be favorable
Avoid emotional decisions
Backtesting before executing strategies
Long-term consistency over short-term wins
📌 Summary – What Can We Learn?
Institutional trading is not magic — it’s structured, logical, and data-driven. As a retail trader, you can’t beat them in speed or capital, but you can:
✅ Learn how they operate
✅ Use similar risk management
✅ Follow the smart money
✅ Avoid emotional trades
✅ Focus on long-term skill building
🏁 Final Thought
The goal isn’t to copy institutional trades, but to understand their footprint and align your trades with their flow. Most successful retail traders grow by observing how smart money moves, then reacting wisely.
You don’t need ₹100 crore to trade like an institution — you need a strategic mindset, discipline, and a plan.

Advance Option Trading⚙️ Advance Option Trading
Advance Option Trading helps you level up your skills and trade like the pros!
It’s not just about buying Calls or Puts — it's about using smart, multi-leg strategies like:
🔹 Iron Condors
🔹 Butterflies
🔹 Credit Spreads
🔹 Calendar Spreads
These strategies let you profit from:
📈 Price movement
⏳ Time decay (Theta)
🌪️ Volatility changes (Vega)
🔍 What You'll Learn:
Greeks mastery – Delta , Theta , Gamma , Vega
Risk control – Trade with limited loss & defined risk
Trade adjustments – Fix or flip trades smartly
High-probability setups – Trade based on logic, not luck
💡 Perfect For:
✅ Experienced traders
✅ Options scalpers & income seekers
✅ Anyone ready to trade like institutions
🚀 Final Thought:
Trade smarter. Risk less. Profit more.
Advance Option Trading is your path to professional-level strategies with control, clarity, and consistency.

Trading Master Class With Experts🎓 Trading Master Class With Experts
The Trading Master Class With Experts is a premium learning experience designed to take your trading skills to the next level by learning directly from market professionals – traders who’ve been in the game, seen the cycles, and built real strategies that work. 💼📈
In this expert-led masterclass, you will:
📊 Learn From Real Market Experts
🧠 Gain insights from institutional traders, analysts, and full-time professionals
🔍 Watch live trading sessions, analysis, and decision-making
🎯 Understand the logic behind high-probability trades
🔄 See how pros adapt to changing markets in real time
🔧 Master Advanced Trading Skills
📉 Deep dive into technical and fundamental analysis
💹 Learn options, futures, and multi-asset strategies
📍 Build a risk-managed trading system from scratch
⚙️ Use institutional tools: order flow, volume profiles, and price action
🛡️ Get Mentorship & Community
👥 Join a private trading community
💬 Get answers in live Q&A sessions
📈 Share progress, refine skills, and grow with a pro network
📌 In simple words:
The Trading Master Class With Experts is where serious traders learn the real rules of the game — directly from those who play it at the highest level.

RELIANCE INDUSTRIES Reliance could fall 📉 to 1290 or to the white line within 11th August or if there's some deviation then it could fall within 25th August 2025
Disclaimer:
It's a personal view not a financial advice and I assume no responsibility and liability whatever outcome arises.
Small Account Scalping / Challenge Trading🔍 What is Small Account Scalping?
Scalping means taking very short, quick trades — entering and exiting the market in a matter of seconds to a few minutes — to capture small price moves.
Now combine this with a small account — typically ₹1,000 to ₹10,000 (or $100 to $500). You're looking at a trading style where:
Tiny profits are taken quickly
High discipline and speed are critical
Risk-to-reward ratios are tight
Compounding is the core idea (small wins stack up)
Scalping with a small account is not just about earning big money quickly — it's often done as a "challenge" to prove skill, build discipline, or simply to show that trading isn’t about how much money you have, but how well you manage it.
🎯 What is Challenge Trading?
Challenge Trading is when a trader publicly sets a goal, like:
Turning ₹5,000 into ₹50,000
Growing $100 to $1,000 in 30 days
Doubling capital in 10 trades
These challenges are usually:
Documented daily (on YouTube, Telegram, or Instagram)
Done with full transparency
Focused on scalping or intraday setups
Built around strict rules and money management
Why do people do it?
For credibility
To learn discipline
To inspire beginners
To prove skill without needing big capital
📉 Why Most Traders Fail with Small Accounts
Let’s be honest — 90% of small account traders blow their capital within days or weeks.
Here’s why:
1. Overleveraging
Trying to turn ₹1,000 into ₹5,000 in one day? Most traders overtrade, use max quantity, and take unnecessary risks.
2. No Risk Management
They don’t respect stop-losses. One bad trade wipes 50% or more of their account.
3. Emotional Trading
Small capital = High emotions. Losing ₹300 from ₹1,000 hurts more than ₹3,000 from ₹1,00,000.
4. No Consistency
They jump from strategy to strategy. From breakout trading to option buying to indicator-based setups — nothing sticks.
5. Trying to Get Rich in One Day
Small accounts are not magic lamps. Trying to “flip money” quickly always backfires without a strong base strategy.
✅ How to Actually Win at Small Account Scalping
Let’s now focus on how to do it right — step by step.
✳️ Step 1: Choose the Right Market Instrument
For scalping with small capital, you want:
High liquidity (easy entries & exits)
Fast movement
Low capital requirement
Some good choices:
Index options like Nifty/BankNifty Weekly
FinNifty (Tuesday expiry)
Micro lots in Futures (if margin allows)
USDT/INR scalping on crypto exchanges (Binance, CoinDCX)
Stocks like Reliance, Tata Motors, SBIN – but be cautious
Avoid:
Illiquid stocks
High lot-size contracts
Multi-leg option strategies with high cost
✳️ Step 2: Pick a Scalping Setup That Works
You don’t need 10 strategies. Just 1-2 that work well on a small timeframe.
Examples:
Breakout on 1-min chart
Mark consolidation
Wait for breakout candle with volume
Enter with tight SL, book in 1:1.5 or trail
VWAP Rejection Entry
Wait for price to test VWAP
If rejected, enter in the opposite direction
Small risk, quick reward
Fakeout Trap
Market fakes breakout → reverses
Enter with confirmation of reversal
Common in BankNifty scalping
News-Based Scalping
RBI decisions, GDP data, Budget day
Extreme volatility → use strict stop-loss
✳️ Step 3: Master Position Sizing
Golden rule: Never lose more than 2-3% in one trade.
With ₹2,000 capital:
Risk max ₹40–₹60 per trade
Use option buying, not futures
Focus on quantity control
If you're using 50% of capital in one trade, you’re doing it wrong. That’s not scalping — that’s gambling.
✳️ Step 4: Use a Simple Tool Setup
Keep your charts clean.
Timeframe: 1-min or 3-min
Indicators: VWAP, EMA (9 or 20), Volume
Levels: Draw basic support/resistance
Avoid: Overloaded charts with 6 indicators
✳️ Step 5: Take Only 1–3 Trades a Day
In small account scalping, overtrading kills faster than losing.
Max 3 trades per day
Win 2 out of 3 = Green Day
Lose 2 = Stop trading
Stick to the plan. Live to trade another day.
✳️ Step 6: Focus on % Growth, Not ₹ Profit
Don’t compare yourself to traders making ₹20K/day
If you make ₹150 on ₹2,000 → that’s 7.5% gain
Make 5% a day for 20 days = 100% monthly compounding!
Small wins matter. They build discipline, confidence, and capital.
🧠 Psychology Behind Challenge Trading
To win the small account game, your mindset matters more than your strategy.
Mental Rules:
Treat every rupee as if it’s ₹1,000
Never chase revenge trades
Accept red days calmly — they’re part of the game
Celebrate consistency more than profit
📌 Tracking Your Progress
Make a Trading Journal:
Entry/Exit time
Setup used
Why you entered
How you felt
Profit/Loss
Over 30 days, this builds emotional and strategic control.
🚫 Mistakes to Avoid in Small Account Scalping
❌ Averaging in loss
❌ Trading without stop-loss
❌ Copying random Telegram tips
❌ Overtrading after losses
❌ Ignoring brokerage and slippage
❌ Expecting daily profits
🏁 Final Words: Is Small Account Scalping Worth It?
✅ YES — if:
You want to build confidence and discipline
You want to master trading with risk management
You like fast-paced, quick decision-making
❌ NO — if:
You’re in a hurry to make big profits
You trade emotionally
You don’t journal your trades or follow structure
It’s a journey — not a race.
With patience and process, your ₹2,000 account can one day fund your ₹2 Lakh trading journey.
Institution Option Trading📌 1. Multi-leg Strategic Trades
Institutions rarely take single-leg naked options. They use advanced setups like:
✅ Vertical Spreads (Bull Call / Bear Put)
✅ Iron Condor / Iron Butterfly
✅ Calendar / Diagonal Spreads
✅ Ratio Spreads
✅ Box Spreads (riskless arbitrage)
These strategies offer:
Defined risk
Better reward-to-risk ratios
Controlled exposure to market direction and volatility
📌 2. Delta Hedging
Institutions holding large stock or futures positions hedge delta using options.
For example:
Holding ₹50 crore worth of Reliance shares
Buy Reliance PUT options to protect against fall
Or, dynamically sell call options as price rises to adjust exposure
This is called Delta Hedging, and it’s done in real-time using algorithms.
📌 3. Open Interest (OI) Tracking
Institutions use option chain OI to:
Spot support/resistance based on strike activity
Identify traps and short-covering zones
Detect institutional presence via unusual OI spikes
For example:
Sudden OI surge at 22,000 PE in Bank Nifty
Might indicate put writers protecting downside, expecting reversal
📌 4. Time Decay (Theta) Exploitation
Institutions are the real beneficiaries of theta decay.
They sell options (straddles, strangles, spreads) around key levels (like VWAP, CPR) and let time decay eat the premium.
Especially on:
Expiry day (Thursday in India)
After big moves
In range-bound markets
They deploy millions of rupees in premium-selling strategies to generate daily/weekly returns.
🔶 Institutional Option Strategies Explained
Let’s break down some common institutional strategies in real terms:
🔷 1. Short Straddle
Sell ATM Call and ATM Put at same strike
Works in sideways markets
Profits from time decay and low movement
✅ Used heavily by institutions on weekly expiry
✅ Risk: Sharp move in either direction
🔷 2. Bull Call Spread
Buy a lower strike Call
Sell a higher strike Call
Lower cost, limited risk & reward
✅ Used when institutions expect moderate bullish move
✅ Controlled exposure + reduced premium
🔷 3. Iron Condor
Sell OTM Call & Put
Buy further OTM Call & Put
Net credit strategy with limited risk
✅ Best in low volatility, non-trending markets
✅ Profitable if market stays between two levels
🔷 4. Calendar Spread
Sell near-term option
Buy far-month option (same strike)
Used when:
Near-term IV is high
Long-term view is neutral or unclear
✅ Profits from IV difference and time decay advantage
🔷 5. Protective Put
Holding equity or futures
Buy Put Option to insure position
Institutions use this to hedge large portfolios during high uncertainty (e.g., elections, war threats, Fed rate decisions)
🔶 Real Example – How an Institution Trades Nifty Options
Let’s say Nifty is at 22,000.
📊 Scenario:
IV is high
No major event ahead
OI buildup seen at 22000 PE and 22100 CE
📈 Institutional Strategy:
Sell 22000 PE and 22100 CE (Short Straddle)
Buy 21900 PE and 22200 CE (hedge legs)
Result:
If Nifty stays in range → theta decay = profit
If it breaks out → hedge legs protect loss
✅ Low-risk, smart premium capture strategy
🔶 Key Tools Institutions Use in Options Trading
Bloomberg Terminal (real-time global data)
Opstra / Sensibull / QuantsApp (for Greek/OI analysis)
Option Vega/IV scanners
Algo trading engines
Python/R-based custom backtesting engines
Retail traders can start by using TradingView + Sensibull/Opstra.
🔶 How to Learn Institutional Options Trading?
Here’s a step-by-step approach:
✅ Understand Options Basics – Calls, Puts, Moneyness
✅ Study Greeks Deeply – Delta, Theta, Vega, Gamma
✅ Learn Option Chain Analysis – OI, IV, Max Pain
✅ Explore Spreads & Multi-leg Setups
✅ Practice Risk Management & Position Sizing
✅ Track Institutional Behavior via OI shifts & volume
✅ Backtest Your Strategy before going live
🔶 Final Takeaways
Institutional Options Trading is not about guessing. It’s about data, structure, and risk.
Retail traders who try to copy institutions without understanding their objectives often get trapped.
But if you:
Study Smart Money behavior
Use strategic entries based on volume + volatility
Respect risk and capital preservation
…you can trade with the institutions, not against them.

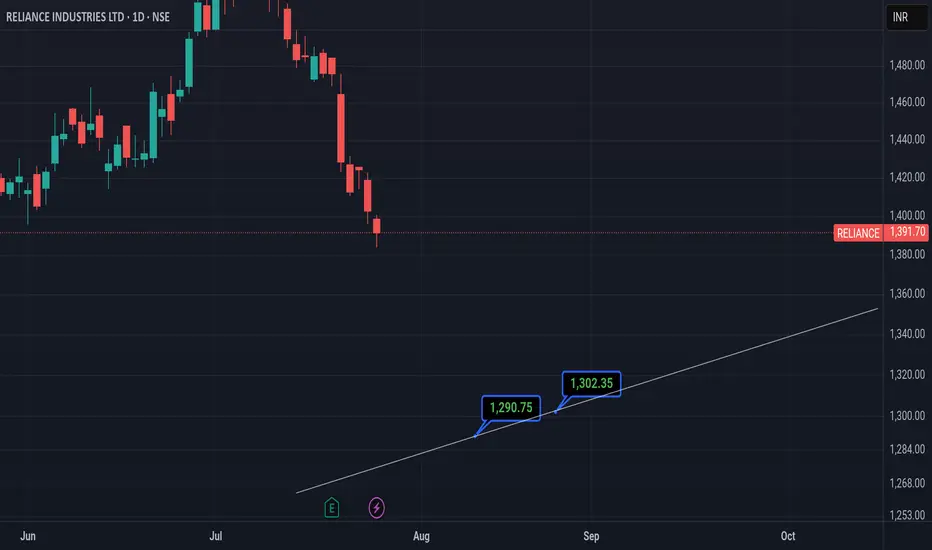
Reliance: opportunity to add more in your portfolioThis will seek a support around 1324.
This is a demand zone and
One can add more stocks here at this point price.. Overall trend is up
Institutional Order Flow / Smart Money Concepts🚀 What is Institutional Order Flow?
Institutional Order Flow simply means tracking how big players are placing their buy and sell orders, and using that data to trade alongside them — not against them.
Big players can’t enter or exit in one go. If they do, they’ll move the market too much. So they:
Split their orders
Use liquidity zones
Create traps and fakeouts to fill their orders
Your job as a retail trader is to spot these footprints.
💡 Why is it Important?
Most retail traders:
Follow indicators
Chase breakouts
React late
Institutions:
Create liquidity traps
Use retail mistakes to enter their positions
Push price into zones that force emotional trading
By understanding Institutional Order Flow or Smart Money Concepts, you’ll stop being the one getting trapped—and start trading with the whales.
🔍 Key Concepts of Smart Money / Institutional Order Flow
Let’s now break down the core principles and tools.
1. Liquidity Zones
Institutions need liquidity — meaning many buyers or sellers to fill their orders.
They create fake breakouts, stop hunts, or news spikes to force retail traders to enter or exit — and then they do the opposite.
Example:
Price breaks above resistance — retail buys breakout
Institutions sell into that liquidity
Price reverses sharply = retail gets trapped
Your job: Identify where liquidity is sitting (above highs, below lows).
2. Breaker Blocks
A breaker block is an OB that failed, but now acts as the opposite side’s zone.
Example:
Price breaks bullish OB and comes back → now it acts as support.
Same with bearish OB → becomes resistance.
These show who is now in control — buyers or sellers.
3. Market Structure Shifts (MSS)
Smart money tracks structure, not indicators.
A Market Structure Shift happens when:
The trend breaks (HH → LL or LL → HH)
A new direction is confirmed
Institutions often wait for MSS before executing large orders.
Your job: Don’t jump in early. Wait for structure change to confirm smart money is switching sides.
4. Fair Value Gap (FVG)
An FVG is a price imbalance between candles — where price moved too fast, leaving a “gap” in liquidity.
FVG means:
A zone where institutions might revisit
Often gets “filled” later
Use for entries, targets, or rejections
How to spot: In a strong move, look between the first candle’s high and the third candle’s low (or vice versa) – this is your FVG.
5. Internal vs External Liquidity
Institutions use both:
External Liquidity = above highs / below lows (stop-loss areas of retail traders)
Internal Liquidity = inside the range (consolidation, breaker retests)
They:
Grab external liquidity
Fill internal orders
Then move price in their actual direction
This explains why breakouts fail — they were designed to!
🔁 Typical Smart Money Price Flow (Simple)
Accumulate (Sideways range)
Manipulate (Fake breakout or stop hunt)
Distribute (Strong move in real direction)
If you know this sequence, you can start trading the traps, not falling for them.
🛠 How to Trade Smart Money Concepts – Step by Step
Let’s bring it all together in a logical workflow:
✅ Step 1: Analyze Market Structure
On higher timeframes (1H, 4H, Daily), check:
Trend (bullish/bearish)
Breaks in structure (HH/LL change)
Are we in consolidation?
✅ Step 2: Identify Key Zones
Mark:
Order blocks (the last opposite candle before big move)
FVGs (imbalances)
Equal highs/lows (liquidity)
Swing points (for stop hunts)
✅ Step 3: Wait for Liquidity Grab
Watch for:
Wicks above highs or below lows
Aggressive moves into zones
Quick rejections
These are signs smart money is active.
✅ Step 4: Confirmation
MSS: Wait for structure to shift
Candle Confirmation: Engulfing, Break of structure candle
FVG Fill or OB tap
Only enter when confluence builds — not just one clue.
✅ Step 5: Risk-Managed Entry
Entry: After confirmation near OB or FVG
SL: Just outside OB/FVG
TP: Next liquidity zone or opposite OB
Always maintain minimum 1:2 RR.
😱 Common Mistakes Retail Traders Make
Trading breakouts blindly
Entering before confirmation (no MSS or candle clue)
Ignoring structure for indicators
Thinking OB is one candle – it's a zone
No patience – chasing price instead of letting price come to you
🎯 Why Institutions Need You to Lose
Yes — if you lose, they win.
Your stop-loss is their entry liquidity
Your breakout buy is their exit plan
Your emotional trading funds their smart entries
That's why they manipulate, trap, and fake moves to create liquidity.
But with knowledge of Institutional Order Flow — you flip the script.
💬 Final Thoughts
Institutional Order Flow / Smart Money Concepts aren’t a secret strategy — they’re simply a deeper understanding of how the market actually works.
Instead of being manipulated, you become the one who reads the manipulation.
It’s not about predicting the market — it’s about reacting to what smart money is doing, with patience, precision, and process.
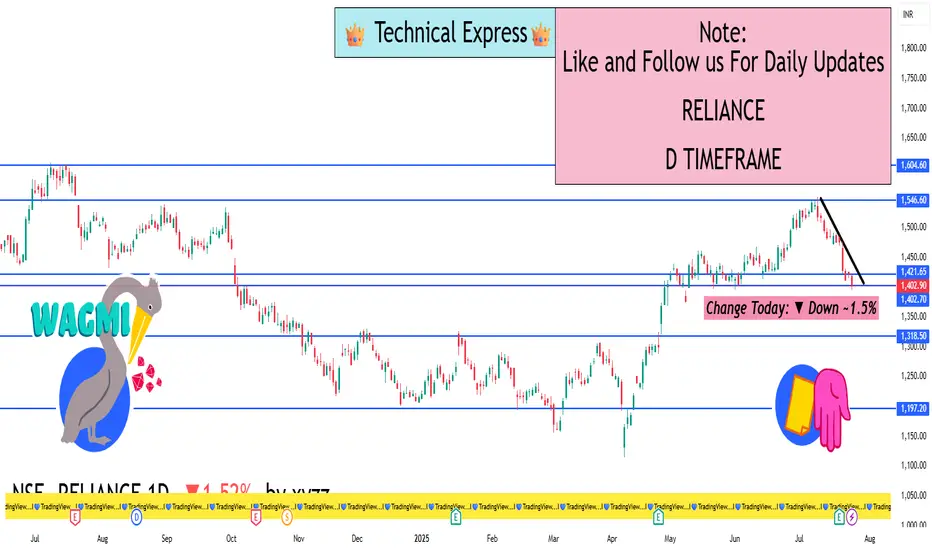
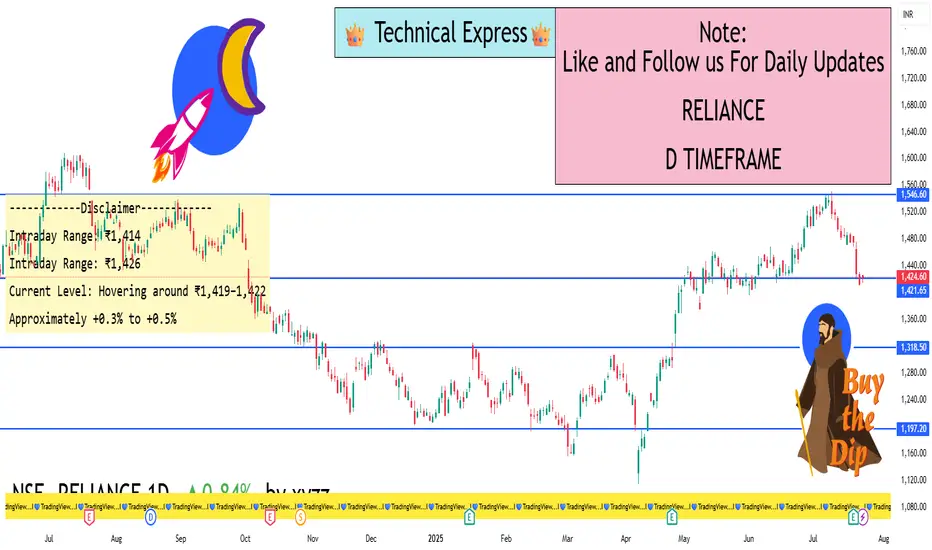
RELIANCE 1D TimeframeStock Data (1D Time Frame)
Current Market Price: ₹1,403 – ₹1,405 (Approx.)
Change Today: ▼ Down ~1.5%
Previous Close: ₹1,425
Day’s High: ₹1,427
Day’s Low: ₹1,398
52-Week High: ₹1,551
52-Week Low: ₹1,115
🧾 Intraday Performance Summary
Reliance opened mildly negative and continued a downward trend due to broader market weakness.
The stock touched an intraday low near ₹1,398 as profit-booking continued post its recent rally.
Despite reporting record profits in Q1, investor sentiment remains cautious due to underperformance in its Oil-to-Chemicals (O2C) and Retail segments.
🧠 Technical View (1-Day Time Frame)
Indicator Status
Trend Short-term Weak/Bearish
RSI (Relative Strength Index) Near 45 – slightly weak
Support Level ₹1,390 – ₹1,350 zone
Resistance Level ₹1,430 – ₹1,470
Volume Above average during dips
Stock is trading below key moving averages (20 and 50 DMA).
Break below ₹1,390 may lead to further correction toward ₹1,350.
Upside momentum may resume only if it breaks and sustains above ₹1,430–₹1,440 levels.
🧮 Fundamental Insights
💼 Q1 FY26 Highlights:
Net Profit: Around ₹30,783 crore, helped by a one-time gain from stake sales.
Core Business Growth: Adjusted profit growth (excluding exceptional items) is about 25% year-over-year.
Retail & O2C: Both divisions saw margin pressure despite revenue growth.
Jio Platforms: Continued to show strong performance through ARPU improvement and subscriber growth.
New Energy Segment: Investment in green energy, solar, and hydrogen tech continues to build momentum.
📈 Key Growth Drivers Ahead
Jio Expansion – Increased monetization from 5G and digital platforms.
Retail Scaling – Aggressive expansion through online + offline strategies.
Green Energy Push – Investments in solar panels, hydrogen energy, and battery storage to become significant in 2025–26.
Potential IPOs – Jio and Retail business listing possibilities can unlock value.
🛑 Risks to Watch
Pressure on global refining margins may continue to affect the O2C segment.
Delay in clean energy execution can lead to valuation stress.
Macro market correction or FII selling could drag heavyweights like Reliance.
🔮 Outlook
Short Term: Cautious-to-bearish unless ₹1,430 is reclaimed. ₹1,350 is a critical support.
Medium to Long Term: Remains fundamentally strong. New growth drivers (Jio, Retail, Energy) support a positive outlook beyond 3–6 months.
Master Institutional Trading🎯 Introduction
Master Institutional Trading is the advanced art and science of trading the financial markets the way big institutions do — with deep capital, strategic precision, and unmatched risk management.
Unlike retail trading, which often relies on basic indicators and emotions, institutional trading follows a rule-based, data-driven, and psychology-controlled framework. Mastering this approach means stepping into the mindset and strategy of hedge funds, mutual funds, proprietary desks, and investment banks.
If you want to trade with consistency, clarity, and capital preservation, mastering institutional trading is the next step.
💡 What is Institutional Trading?
Institutional trading refers to the activities of large financial entities that control significant capital and influence market movement through their trades.
Examples include:
Hedge Funds
Mutual Funds
FIIs (Foreign Institutional Investors)
DIIs (Domestic Institutional Investors)
Pension Funds
Proprietary (Prop) Trading Desks
These institutions operate based on in-depth research, order flow analysis, macroeconomic models, and advanced risk frameworks.
🧠 What Does “Master Institutional Trading” Mean?
It means gaining the skills, tools, mindset, and techniques to:
Analyze market movements through institutional logic
Identify smart money footprints
Build trades based on volume, order flow, and positioning
Manage risk with capital preservation like pros
Avoid retail traps and fakeouts set by institutions
You’re not just reacting to the market—you’re reading what the big players are doing and aligning with them.
🧩 Core Concepts in Master Institutional Trading
1. Market Structure Analysis
Understand liquidity zones, order blocks, and institutional S/R
Learn why institutions build positions over time, not all at once
2. Volume & Open Interest Analytics
Spot unusual volume spikes
Understand Open Interest traps in options
Decode what institutions are betting on
3. Smart Money Concepts
Accumulation and Distribution phases
Wyckoff Theory in modern application
Spotting manipulation and liquidity grabs
4. Advanced Risk Management
Never risk more than 1–2% per trade
Use position sizing based on volatility
Focus on capital efficiency, not revenge trading
5. Price Action + Institutional Candle Patterns
Recognize imbalance zones, breaker blocks, and engulfing traps
Use tools like VWAP, Delta Volume, and Footprint Charts
6. Trade Execution Techniques
Partial entries
Scaling in/out like funds
Managing trade lifecycle like a desk trader
🛠 Key Strategies in Master Institutional Trading
A. Liquidity Hunting
Institutions place orders where most retail SLs are placed
Then reverse price after triggering retail orders
B. Options Positioning & IV Play
Use of Straddles/Strangles for theta decay
Selling volatility pre-event, buying it post-event
C. Delta Neutral & Gamma Scalping
Market-neutral strategies hedged with futures or stocks
Designed to profit from volatility swings
D. Accumulation/Distribution Mapping
Long consolidation = institutional entry/exit
Price reacts to volume shifts more than indicator signals
🔥 Institutional Footprint Examples (Nifty/Bank Nifty)
ATM Straddle OI surge with no move in price
→ Market makers hedging aggressively = big move coming
Sudden OTM Put buying with high IV on a flat day
→ Institutions betting on downside volatility = potential crash setup
VWAP deviation rejection
→ Institutions use VWAP as a fair value; moves away from it often reverse
👨🏫 How to Master Institutional Trading?
✅ Step-by-step Learning Path:
Study Market Microstructure
Understand how orders get matched, what limit/market orders do.
Learn Option Greeks & Institutional Strategies
Especially delta, gamma, and IV crush.
Use Volume Profile, VWAP, OI data together
Build your view based on multi-layered confirmation.
Follow FIIs/DII Data Daily
Learn how they position in equities, derivatives, and sectors.
Backtest Institutional Setups
Focus on risk-reward, not just accuracy.
Use Trading Journals
Analyze what works, improve continuously.
⚠️ Common Mistakes Traders Make (That Institutions Don’t)
Chasing trades emotionally
Overtrading low-conviction setups
No journaling or review process
Relying on random indicators instead of structure
Ignoring risk-to-reward or capital management
🧘♂️ Mindset of Institutional Traders
"Protect capital first, profits will follow."
Trade like a sniper, not a machine gun.
Think in terms of probabilities, not guarantees.
Never marry your analysis; adapt to new information.
💼 Who Should Learn Master Institutional Trading?
Intermediate to advanced traders
Full-time traders or those planning to go full-time
Derivatives traders (Nifty, Bank Nifty, Options)
Students of technical analysis who want a deeper, real-world edge
🔚 Final Words
Master Institutional Trading is the next-level evolution of your trading journey. It’s about stepping away from noise and hype, and embracing how real money trades.
You don’t need a hedge fund job to trade like one—you just need the knowledge, tools, and discipline. When you think and act like an institution, you stop being prey and start playing the game with the big players.

Advance Option Trading vs. Master Institutional Trading🎯 What is Advance Option Trading?
Advance Option Trading means using complex option strategies to manage risk, take advantage of volatility, or make consistent income from the market.
You’re not just buying a Call or a Put here. You’re using combinations of options like:
Spreads (Bull Spread, Bear Spread)
Iron Condors
Butterflies
Ratio Spreads
Calendar Spreads
You're also learning to understand and control variables like:
Delta (directional movement)
Theta (time decay)
Vega (impact of volatility)
Gamma (rate of Delta change)
In short, it’s like playing chess with the market using tools that have defined risk and reward. You can win even if the market moves sideways or only slightly moves in your direction.
🧠 What is Master Institutional Trading?
Master Institutional Trading is about thinking and trading like big institutions – the banks, hedge funds, and FIIs (Foreign Institutional Investors). These players don’t trade like retail traders.
They control large volumes, manage millions or billions in capital, and have the ability to move markets. But here's the secret: they don’t chase price… they create price movement.
In this trading style, your focus is on:
Volume Profile
Order Blocks
Liquidity Zones
Market Structure
Smart Money Concepts (SMC)
Wyckoff Theory
You're not predicting price – you're following the footprints of big money. You’re trying to enter when institutions are entering, and avoid traps they set for retail traders.
🔄 Core Difference at a Glance
Feature Advance Option Trading Master Institutional Trading
Asset Used Options (CE/PE) Stocks, Futures, Options
Main Tool Option Greeks, Option Chain Volume Profile, Order Flow
Style Strategy-based Flow-based
Mindset Structured, mathematical Contextual, dynamic
Learning Curve High (requires math + logic) High (requires market psychology + vol read)
🧰 Tools Used
Tool Option Trading Institutional Trading
Option Chain ✅ ❌
Greeks (Delta, Theta, Vega) ✅ ❌
Volume Profile ❌ ✅
Market Structure (HH/LL) ❌ ✅
Implied Volatility (IV) ✅ ❌
Order Flow/Tape ❌ ✅
Liquidity Zones ❌ ✅
Expiry Analysis ✅ Sometimes
VWAP & POC Optional Core tool
🎯 Goals of Each Trader
🧪 Advance Option Trader:
Earn from time decay (Theta)
Use spreads to protect capital
Trade with defined risk
Take advantage of volatility crush
Scalp on expiry days using option premiums
🎯 Institutional Trader:
Trade in alignment with Smart Money
Ride major directional moves
Avoid retail traps
Use volume as a leading indicator
Trade price action with deeper logic
💥 Example in NIFTY
Let’s say NIFTY is at 22000.
✅ Option Trader's View:
Market is range-bound
Build an Iron Condor:
Sell 21800 PE, Buy 21700 PE
Sell 22200 CE, Buy 22300 CE
Max profit if NIFTY stays in range for next 3 days
✅ Institutional Trader's View:
Market faked a breakout above 22100
Big volume appeared at top, then reversed
Enters short after liquidity sweep
Targets zone near 21850, which is a demand block
🤔 Which One Should You Learn?
Your Profile Go for Option Trading Go for Institutional Trading
You like rules, logic, math ✅ ❌
You enjoy price-action & market behavior ❌ ✅
Want passive income from theta decay ✅ ❌
Want to scalp or swing big moves ❌ ✅
Prefer fixed risk/reward trades ✅ ❌
Want to track where big money trades ❌ ✅
You hate fake breakouts ❌ ✅
🧩 Can You Combine Both?
Absolutely!
In fact, many successful traders today use Institutional Trading concepts (like SMC or Volume Profile) to identify zones and then execute trades using option strategies.
Example:
Use institutional zone to identify support/resistance
Then sell options near those zones
Or place a directional option spread trade
This is called "confluence trading" – where different systems come together to build a stronger edge.
⚠️ Common Mistakes
🚫 In Option Trading:
Ignoring Greeks
Blindly buying options without IV analysis
Trading low volume strikes
Not adjusting positions
🚫 In Institutional Trading:
Overusing Smart Money concepts without confirmation
Misreading fakeouts as real breakouts
Trading against volume
Being impatient and entering early
✅ Final Summary
🔹 Advance Option Trading
You’re a strategy player
Mastering time decay, volatility, and spreads
Goal: Defined profit, controlled loss, consistent income
🔹 Master Institutional Trading
You’re a market observer
Mastering order flow, liquidity, and manipulation
Goal: Ride big moves, avoid traps, think like smart money

RELIANCE 1D TIMEFRAME🧾 Basic Market Overview
Open: ₹2,990
High: ₹3,012
Low: ₹2,943
Close: ₹2,956
Change: Down by ~₹34 (approx. -1.13%)
Today, Reliance started strong but faced immediate selling near the ₹3,000 mark, resulting in a negative close. The price remained weak for most of the session, and closed near the day’s low, which is a bearish sign.
🕯️ Candlestick Formation
The candle formed on the daily chart resembles a strong bearish candle — possibly a long red candle or bearish engulfing if it closes below the previous day’s close. This shows:
📈 Trend Overview
Short-Term Trend: Weak — downward momentum building
Medium-Term Trend: Sideways to slightly bullish
Long-Term Trend: Bullish — still intact unless price breaks ₹2,850
Today’s weakness has not yet broken long-term structure, but short-term traders should be cautious.
🔮 What Could Happen Next?
✅ Bullish Recovery:
If Reliance moves back above ₹3,000 and sustains with volume, it can retest ₹3,050–₹3,080
A bullish engulfing or reversal pattern needed for upside confirmation
⚠️ Bearish Continuation:
If it breaks below ₹2,940, more downside is possible toward ₹2,915–₹2,875
Traders may take short positions below this level with tight stop-loss
🔄 Consolidation:
If the price holds between ₹2,940 and ₹3,000, expect sideways movement or base building before a big move
🎯 Strategy Suggestions
For Intraday Traders:
Watch ₹2,940 – ₹3,000 levels closely
Short below ₹2,940 with a target of ₹2,915
Long above ₹3,000 only if backed by strong buying
For Swing Traders:
Avoid new longs until daily candle shows strength
Consider fresh buys near ₹2,900–₹2,915 with SL below ₹2,875
Wait for a breakout above ₹3,050 to confirm bullish reversal
For Investors:
No need to panic; long-term uptrend still valid
Add in dips if it reaches ₹2,875–₹2,850 with confirmation
Fundamental strength supports medium-to-long-term outlook
📌 Summary
Reliance showed bearish sentiment today, breaking below the short-term support of ₹2,975 and closing weak at ₹2,956. It’s trading between a critical support zone of ₹2,940–₹2,915 and facing resistance around ₹3,000–₹3,020.
Short-term: Bearish bias
Medium-term: Neutral to weak bullish
Long-term: Still bullish unless ₹2,850 breaks decisively
Traders should be cautious and wait for confirmation before taking aggressive positions.
Buyers attempted a push above ₹3,000 but failed.
Bears took over the session.
Closing near the day’s low suggests strong downside momentum.
Master Institutional Trading✅ Introduction: What Is Institutional Trading?
Institutional trading refers to the strategies and market activities carried out by big players—like hedge funds, mutual funds, insurance companies, foreign institutional investors (FIIs), banks, and proprietary trading firms.
Unlike retail traders (individuals), institutions manage large capital, influence markets, and use advanced data-driven strategies to enter and exit positions silently and smartly.
"Master Institutional Trading" is all about learning how these big players operate, how they make decisions, and how you—an individual trader—can read their moves and trade alongside the smart money instead of against it.
🧠 Why Learn Institutional Trading?
Most retail traders lose money because they trade emotionally or follow the crowd. Institutional traders, on the other hand:
Follow data, not emotions
Trade with discipline and risk management
Use volume, price action, and order flow
Focus on capital protection as much as profits
Mastering Institutional Trading helps you:
Understand how smart money moves
Identify hidden demand and supply zones
Trade with precision using volume and price action
Avoid retail traps and manipulation zones
Develop a rule-based, professional approach
📘 What You Learn in Master Institutional Trading
Here’s what a full-fledged Master Institutional Trading program or strategy guide includes:
1️⃣ Market Structure: Understanding the Battlefield
Difference between retail and institutional behavior
Market cycles: Accumulation → Manipulation → Distribution
Price action and how institutions create fake breakouts
Liquidity hunting: How institutions trap retail traders
2️⃣ Smart Money Concepts
Smart money refers to capital controlled by professional institutions. You’ll learn:
How to track smart money footprints
Concepts like Order Blocks, Liquidity Zones, Fair Value Gaps (FVG)
Role of volume spikes and open interest in showing big trades
How smart money builds positions slowly to avoid moving the market
3️⃣ Volume Profile and Order Flow
Institutional traders focus on volume and flow, not indicators.
How to use Volume Profile (POC, Value Area High/Low)
Footprint charts and Delta analysis
How to read Buy vs Sell pressure
Spotting imbalances where smart money takes control
4️⃣ Institutional Candlestick Behavior
Candles tell a story—especially when institutional players are involved.
You’ll learn:
Master Candle setups
Break of Structure (BOS) and Change of Character (CHOCH)
Identifying manipulation wicks and liquidity grabs
Candlestick rejections at key institutional levels
5️⃣ Option Chain Analysis (Institutional Option Trading)
Institutions use options to hedge and speculate quietly.
Interpreting Open Interest (OI) data
Spotting institutional positions at strikes
Using PCR (Put Call Ratio) and Max Pain
Advanced option strategies like short straddles/strangles, iron condors
6️⃣ Institutional Risk Management
Institutions are masters of risk.
You will learn:
Capital allocation strategy
Stop-loss planning based on liquidity zones, not random points
Scaling into trades, position sizing
Trade management and profit-booking plans
7️⃣ Market Psychology & Trap Detection
Institutional traders create fake moves to trap retail traders.
How to avoid bull traps and bear traps
Understand news-based manipulation
The concept of dumb money vs smart money
Mindset training for following your edge
8️⃣ Building Your Institutional Strategy
The final goal is to trade like an institution, even with a small account.
You will build:
A structured plan based on smart money concepts
Entry/Exit criteria using price action + volume
Trade journaling system
Performance review framework
💼 Who Is This For?
"Master Institutional Trading" is ideal for:
Intermediate and advanced traders
Option traders looking to time entries better
Intraday, swing, and positional traders
Traders tired of using random indicators
Anyone serious about building a long-term profitable system
🧭 Real-World Application Examples
Bank Nifty Levels: Institutions often build positions using weekly options and defend key OI levels.
Nifty50 Zones: Watch for institutional buying during heavy dips or selling into rallies.
Futures Volume: A sudden spike in Bank Nifty Futures + Open Interest jump = Institutional entry.
Option Writers: At resistance zones, call writing increases sharply = probable reversal zone.
🎓 Conclusion
Mastering Institutional Trading is not about getting secret indicators or magic tips. It’s about understanding the market at its core—through price, volume, structure, and behavior of smart money.
Once you learn this, you stop following the herd. You become a confident, calm, data-driven trader who knows how to read the market like a pro.
🔹 Whether you're trading Nifty, Bank Nifty, stocks, or forex – the principles of institutional trading remain the same

Bank Nifty and Nifty50 Scalping TechniquesWhat is Scalping in Index Trading?
Scalping is a high-frequency intraday trading style where a trader looks to capture small price movements multiple times throughout the day. In indices like Nifty50 and Bank Nifty, where price movement is fast and often sharp, scalping is a preferred strategy for many traders.
Scalpers don't aim to catch a ₹100 move. Even ₹20–₹30 on a Bank Nifty option, done 3–4 times a day with volume and discipline, can generate consistent returns.
Why Nifty50 & Bank Nifty for Scalping?
High Liquidity: Tight bid-ask spreads make it easier to enter and exit quickly.
Option Volatility: Options on these indices give quick 5–10% moves in minutes.
Trend & Momentum Friendly: These indices often move in clean intraday trends, giving plenty of scalping chances.
Institutional Interest: Nifty and Bank Nifty are tracked by institutions, so technical levels work well.
Tools Every Scalper Must Use
Before we dive into strategies, make sure you have these ready:
5-Minute / 3-Minute Candlestick Chart
VWAP (Volume Weighted Average Price)
CPR (Central Pivot Range)
Price Action Levels (Previous Day High/Low, Opening Range)
Option Chain Analysis (for OI build-up)
Volume & Momentum Indicators (e.g., RSI, MACD)
Top Scalping Techniques for Nifty & Bank Nifty
1. VWAP Bounce Strategy
Best Time: 9:30 AM to 11:00 AM or 1:30 PM to 3:00 PM
How it works:
Wait for price to test the VWAP line.
If trend is up, and price bounces from VWAP with a bullish candle → enter Call Option.
If trend is down, and price rejects VWAP with bearish candle → enter Put Option.
Entry: On confirmation candle after touching VWAP
Target: 15–25 points on option premium
Stop Loss: 5-minute candle close above/below VWAP
Why it works: Institutions use VWAP for entries; many intraday algos are VWAP-based.
2. CPR Breakout Scalping
Best Time: Opening hour or post-lunch (2:00 PM onwards)
How it works:
If the day’s CPR is narrow, expect trending moves.
Wait for a breakout above CPR high (for long) or below CPR low (for short).
Entry only after a strong 5-minute candle closes outside CPR.
Bonus Tip: Narrow CPR + gap-up = trend day; very scalper-friendly.
Targets: 1:1.5 or trailing stop loss
Risk: High if you trade before confirmation—wait for candle close.
3. Opening Range Breakout (ORB)
Best Time: 9:15 AM – 9:45 AM
How it works:
Mark high and low of first 15 minutes (Opening Range).
Wait for price to break above high or below low with volume.
Ride the momentum for a quick 20–30 point move.
Ideal with: Volume spike + option chain confirmation (OI buildup)
Setup Example:
Bank Nifty breaks above 15-min high, with strong buying in 44,000 CE option → go long.
4. Momentum Scalping with RSI + Candles
How it works:
Use 3-minute chart.
If RSI crosses 60 and a strong green candle forms → go long.
If RSI drops below 40 and red candle forms → go short.
Why this works: Combines price momentum with volume conviction.
Targets: Small, quick moves (10–20 points in Nifty, 20–40 in Bank Nifty options)
Stop Loss: Fixed SL or previous candle high/low
5. Option Chain Scalping – "Smart Money Footprint"
How it works:
Track OI build-up in real-time (especially at ATM or 1-step OTM strikes).
If you see heavy OI build-up + volume spike at 44,000 CE → momentum may build.
Enter on confirmation from price chart (ideally with VWAP or CPR confluence).
Bonus: Combine this with Live Change in OI (many brokers offer this now).
Tools to watch:
Strike Price OI Build-up
IV Rise (Implied Volatility)
Volume on Option Contracts
Important Scalping Do’s & Don'ts
Do’s:
Trade only when price structure + indicator + volume align.
Use limit orders to reduce slippage.
Cut losses fast. Scalping is risk-first.
Have fixed daily targets (e.g., ₹1,500/day)
Trade less when market is choppy
Don’ts:
Don’t chase after big moves already gone.
Don’t increase lot size without system consistency.
Don’t scalp in low volatility phases (e.g., between 12–1:30 PM).
Mindset of a Nifty/Bank Nifty Scalper
You are not a trend trader – you’re a sniper.
Profits come from repetition, not jackpot moves.
You must read the pulse of the market within the first 30 minutes.
No trade > bad trade.
Scalping is about control, discipline, and micro-decisions. Even 3–5 successful trades in a session can result in high accuracy days.
Example Live Scenario (Bank Nifty)
Date: Suppose Bank Nifty opens at 44,000
CPR Range: 43,940–44,060 (tight)
VWAP: At 44,020
Option Chain: 44,000 CE OI increasing rapidly, price trading above VWAP
Setup: CPR breakout + VWAP hold + OI build-up at CE
Trade: Buy 44,000 CE @ ₹120
Target: ₹140–₹160
SL: ₹110
Exit: Within 10–15 mins
Avoid trading just on gut feeling. Use structure.
Conclusion
Scalping in Nifty and Bank Nifty is not gambling—it's calculated, quick decision-making with small but consistent profits. Whether you’re using VWAP, CPR, or live option data, your edge comes from preparation and discipline, not prediction.
If you're just starting, begin with paper trading or small lots, and gradually scale up once your win-rate improves. With time, you'll find the setup that fits your personality best—whether it’s breakout-based, pullback scalping, or OI-driven.
Reliance 1D Timeframe📊 Reliance Industries – Intraday Overview
Previous Close: ₹1,428.6
Opening Price: Opened slightly lower around ₹1,427–₹1,431.
Intraday High: Approximately ₹1,432 during early session.
Intraday Low: Dropped towards ₹1,410 during the mid-session.
Current Trading Price: Trading near ₹1,415, showing around 0.9% to 1% decline from the previous close.
🔍 Key Reasons for Movement Today
Post-Earnings Pressure: After recent earnings, Reliance faced profit booking as some investors booked gains following a previous rally.
Sector Weakness: Energy and telecom segments showed subdued strength while retail remained flat.
Heavy Volume: Trading volume remained above average, suggesting active participation from institutions and retail traders.
📈 Technical Snapshot
Immediate Support Zone: ₹1,410–₹1,412. If this breaks, next support could be near ₹1,400.
Immediate Resistance Zone: ₹1,430–₹1,432. A breakout above this may lead towards ₹1,440–₹1,450.
Trend Positioning: Reliance is currently below its short-term (20-day) moving average, indicating mild short-term weakness but no major breakdown.
💡 Intraday Strategy Levels
Scenario Trigger Point Expected Move
Bullish Reversal Above ₹1,432 Potential upside towards ₹1,445–₹1,450
Neutral/Bearish Between ₹1,410–₹1,430 Consolidation zone with limited moves
Breakdown Risk Below ₹1,410 Could slide to ₹1,400 or even ₹1,390 short-term
✅ Summary Conclusion
Reliance is trading with a mild negative bias, with price action holding between ₹1,410–₹1,432. The overall short-term structure remains weak after intraday profit booking, but key support is holding near ₹1,410. Watch for recovery above ₹1,432 for any bullish reversal or break below ₹1,410 for further downside.
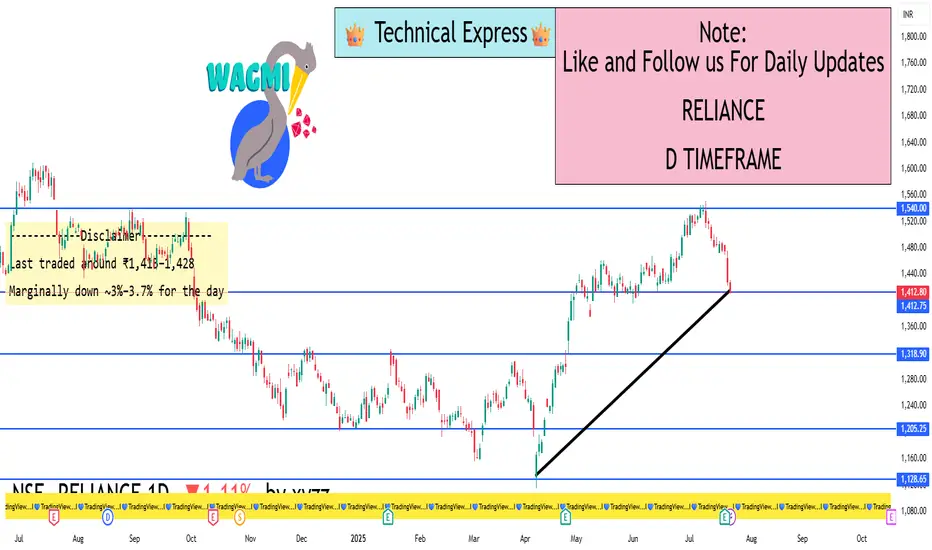
RELIANCE TECHNICAL SHORT BIASLooking forward on a short opportunity, technicals wise on Reliance, aligning with a major trendline breakout on the 4h and a major key level break to the downside. Expect a pullback/correction move to the nearest support-turned resistance level before the final impulse move to the downside.