Support and Resistance part 1In stock market technical analysis, support and resistance are certain predetermined levels of the price of a security at which it is thought that the price will tend to stop and reverse. These levels are denoted by multiple touches of price without a breakthrough of the level.
RIGD trade ideas

Support and Resistance part 2Support is a price point below the current market price that indicate buying interest. Resistance is a price point above the current market price that indicate selling interest. S&R can be used to identify targets for the trade. For a long trade, look for the immediate resistance level as the target.

RELIANCE INDUSTRIES - Bullish Flag & Pole Breakout (Daily T/F)Trade Setup
📌 Stock: Reliance Industries ( NSE:RELIANCE )
📌 Trend: Strong Bullish Momentum
📌 Risk-Reward Ratio: 1:3 (Favorable)
🎯 Entry Zone: ₹1454 (Breakout Confirmation)
🛑 Stop Loss: ₹1373 (Daily Closing Basis) (~5.6% Risk)
🎯 Target Levels:
₹1499.70
₹1546.85
₹1595.45
₹1648.50
₹1697.00 (Final Target)
Technical Rationale
✅ Bullish Flag & Pole Breakout - Classic bullish pattern confirming uptrend continuation
✅ Strong Momentum - Daily & Weekly RSI >60 (Bullish zone)
✅ Golden Crossover - 50 DEMA crossed above 200 DEMA
✅ Volume Confirmation - Breakout volume 20.18M vs previous day's 5.57M (Nearly 4x surge)
✅ Multi-Timeframe Alignment - Daily and weekly charts showing strength
Key Observations
• The breakout comes with significantly higher volume, validating strength
• Well-defined pattern with clear price & volume breakout
• Conservative stop loss at recent swing low
Trade Management Strategy
• Consider partial profit booking at each target level
• Move stop loss to breakeven after Target 1 is achieved
• Trail stop loss to protect profits as price progresses
Disclaimer ⚠️
This analysis is strictly for educational purposes and should not be construed as financial advice. Trading in equities involves substantial risk of capital loss. Past performance is not indicative of future results. Always conduct your own research, consider your risk appetite, and consult a financial advisor before making any investment decisions. The author assumes no responsibility for any trading outcomes based on this information.
What do you think? Are you watching NSE:RELIANCE for this breakout opportunity? Share your views in the comments!

ReliancePrice is having double top resistance at the zone 1440 - 1450. Price tested it and now it is falling towards the support zone 1390 - 1400. If price is unable to gain strength, we will get range bound move between 1390 to 1450.
Buy above 1402 with the stop loss of 1388 for the targets 1420, 1438, 1452, 1476 and 1498.
Sell below 1376 with the stop loss of 1390 for the targets 1360, 1348, 1332 and 1314.
Always do your own analysis before taking any trade.

RELIANCE INDUSTRIES IN LAST LEG OF CORRECTION ??Reliance Industries has seen a lot in last few months. Its time for Reliance industries to complete its last leg of correction and then resume its upward journey.
2 possibilities in last leg of correction.
1) It can be an impulsive move which will be in 1-2-3-4-5, which will be overall Wave C
2) It could be a triangle in which case the downfall and so the correction will be limited but boring.
Check out my previous chart on Reliance Industries.

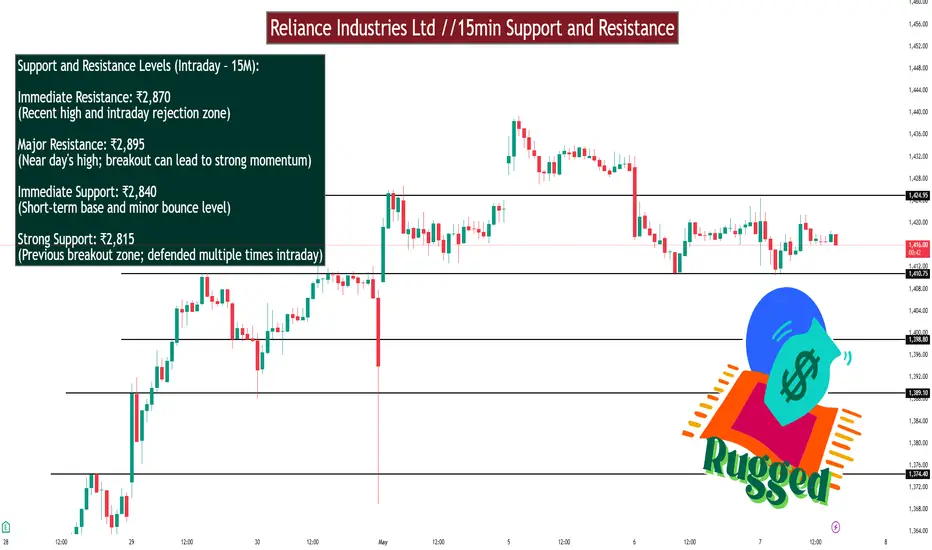
Reliance Industries Ltd //15min Support and ResistanceRELIANCE INDUSTRIES LTD – 15-Minute Chart Support & Resistance
Support and Resistance Levels (Intraday – 15M):
Immediate Resistance: ₹2,870
(Recent high and intraday rejection zone)
Major Resistance: ₹2,895
(Near day's high; breakout can lead to strong momentum)
Immediate Support: ₹2,840
(Short-term base and minor bounce level)
Strong Support: ₹2,815
(Previous breakout zone; defended multiple times intraday)
Trend Insight:
RELIANCE is trading in a rising channel, with buyers stepping in around ₹2,840. Sustained move above ₹2,870 may trigger an upside breakout.
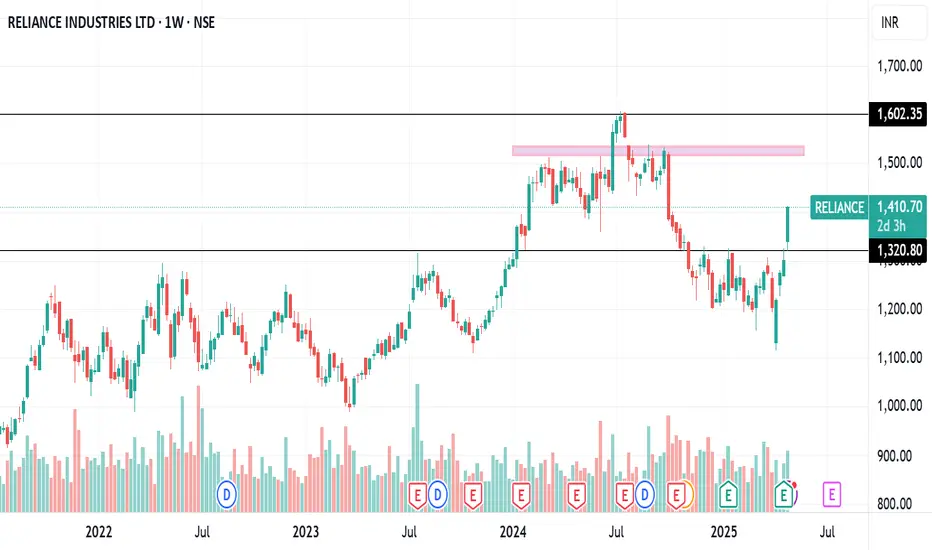
Amazing breakout on WEEKLY Timeframe - RELIANCECheckout an amazing breakout happened in the stock in Weekly timeframe, macroscopically seen in Daily timeframe. Having a great favor that the stock might be bullish expecting a staggering returns of minimum 25% TGT. IMPORTANT BREAKOUT LEVELS ARE ALWAYS RESPECTED!
NOTE for learners: Place the breakout levels as per the chart shared and track it yourself to get amazed!!
#No complicated chart patterns
#No big big indicators
#No Excel sheet or number magics
TRADE IDEA: WAIT FOR THE STOCK TO BREAKOUT IN WEEKLY TIMEFRAME ABOVE THIS LEVEL.
Checkout an amazing breakout happened in the stock in Weekly timeframe.
Breakouts happening in longer timeframe is way more powerful than the breakouts seen in Daily timeframe. You can blindly invest once the weekly candle closes above the breakout line and stay invested forever. Also these stocks breakouts are lifelong predictions, it means technically these breakouts happen giving more returns in the longer runs. Hence, even when the scrip makes a loss of 10% / 20% / 30% / 50%, the stock will regain and turn around. Once they again enter the same breakout level, they will flyyyyyyyyyyyy like a ROCKET if held in the portfolio in the longer run.
Time makes money, GREEDY & EGO will not make money.
Also, magically these breakouts tend to prove that the companies turn around and fundamentally becoming strong. Also the magic happens when more diversification is done in various sectors under various scripts with equal money invested in each N500 scripts.
The real deal is when to purchase and where to purchase the stock. That is where Breakout study comes into play.
LET'S PUMP IN SOME MONEY AND REVOLUTIONIZE THE NATION'S ECONOMY!

RelianceAs per the daily chart, price is moving up for many days. It can give some pull back. 1400 is an important zone to decide the trend direction. Price have to sustain above this to be bullish.
Buy above 1415 with the stop loss of 1402 for the targets 1432, 1454, 1470, 1486 and 1498.
Sell below 1390 with the stop loss of 1402 for the targets 1376, 1360, 1344, 1330 and 1312.
Always do your own analysis before taking any trade.

Reliance - Price action channel + Candlestick + RSIKey Observations from the Chart
Channel Structure -
Both resistance and support lines have been tested multiple times with precise reactions
The most recent price action shows a strong rejection at the lower channel boundary
Candlestick Formation-
This month printed a textbook strong lower wick rejection candle:
Long lower wick indicates buyers aggressively stepping in at support
RSI Confluence-
The RSI tells a compelling complementary story:
Recently retested COVID-era levels (historic oversold territory)
Has since established higher highs and higher lows (bullish structure)
Shows positive divergence with price (RSI making HHs while price tests support)

Reliance buy givennear 1180-90 ,trail sl to 1350 levels on chartHow to take trades using Harmonic pattern projection Trade setup is explained below :-
Entry : 1st SL point : 0% is recent top or bottom.
Trailing D: 15.1% is work as trailing SL of buy or sell trade if hit then we have to book profit
.If price goes below 2nd D 22.5% to 24.5% range then early traders can make fresh reversals trade after breaking 1st D 15.1% safe traders can reversal trade after breaking Point D 22.5.4% to 24.5% range
Targets :
Target T1 : 36.1% to 38.3%
Target T3 : 49.1% to 52.5%
T3: 60.9% to 64.8% is our 3rd Target since this is reversal zone so must book profit if break then take fresh trade again
Target T4 : 76.4% to 79.7%
Next Targets are 100% , 127.2% ,141.4% and final Target 161.8%.
How to take reversal trade :
If price going upside/ downside then then buy or sell levels appear on Chart ( Automatically show when price reach any reversal zone of harmonic projection ).
Trailing SL:
After reach 1st Target trail SL to just above or below cost ( for example we are holding sell trade from 100 1st Target 110 hit then move trailing sl to 104-105 and move SL as price move upside or Downside)
Re- Entry :
For Re-entry in any pull back Point D ( 15.1% ) is used for re-entry then SL recent high or low Point SL ( 0% ) .
Blue Line is 1st support/ Resistance
Green line is 2nd support/ resistance
Red line is 3rd Support/ resistance

Option TradingOption trading involves buying or selling contracts that give the right, but not the obligation, to buy or sell an underlying asset (like a stock) at a specific price (strike price) by a certain date (expiration date). It allows traders to speculate on future price movements of an asset without actually owning it.

Overview of Financial MarketsA financial market is a place where firms and individuals enter into contracts to sell or buy a specific product, such as a stock, bond, or futures contract.

RELIANCE RESISTANCE BREAKOUTReliance breaking resistance weekly basis
with good volume building up since few week
bullish RSI,RSI divergence
posted good #q4results
#target 1500-1535
breaking 1540 #target 1600
NO BUY/SELL RECOMENDATION
Price Action TradingPrice action trading is a strategy that focuses on analyzing and interpreting an asset's price movements to make trading decisions. It involves studying price patterns, trends, and support/resistance levels to anticipate future price direction. Instead of relying heavily on technical indicators, price action traders focus on the raw price data and chart patterns to identify entry and exit points.

MACD TradingThe Moving Average Convergence/Divergence indicator is a momentum oscillator primarily used to trade trends. Although it is an oscillator, it is not typically used to identify over bought or oversold conditions. It appears on the chart as two lines which oscillate without boundaries.

PCR TradingIn trading, PCR, or Put-Call Ratio, is a derivative indicator used to assess market sentiment by comparing the volume or open interest of put options to call options. It's a contrarian indicator, meaning it can suggest an opposite trend to what the market is currently showing. A higher PCR generally indicates bearish sentiment (expecting the market to decline), while a lower PCR suggests bullish sentiment (expecting the market to rise).

RELIANCE: At Crucial Levels! Expecting to bounce back!⚡ Price Analysis:
1️⃣ Price structure is still not bullish need confirmation.
2️⃣ Strong candle formation near the demand zone.
3️⃣ Price needs to HOLD above 1,310 for a strong bull rally to kick in!
⭐ Key Observations:
➡️ Major support area so expecting the price is start bounce back
➡️ Aggressive entry can be planned since confirmation is still pending
➡️ PERFECT Risk-Reward Ratio (RRR) with a very small risk – golden chance!
⚠️ Disclaimer: This is NOT a buy/sell recommendation. For learning ONLY. Views are personal. Please, do your due diligence before investing.⚠️
🍀Cheers! 🔥

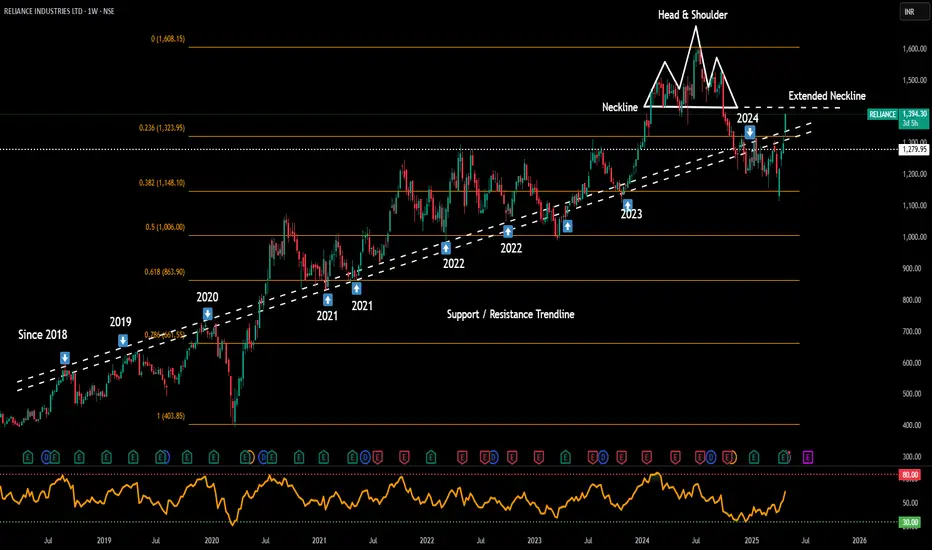
Relaince Date 29.04.2025
Relaince
Timeframe : Weekly Chart
*Important note :
Extended neckline 1414 is now next make or break resistance/breakout zone ahead of the stock. Time for partial profit booking
Important support = 1323
Some weakness :
1 The company has delivered a poor sales growth of 10.1% over past five years.
2 Company has a low return on equity of 8.89% over last 3 years.
3 Dividend payout has been low at 9.84% of profits over last 3 years
Stock PE Ratio = 27.1
1 Oil to Chemicals (O2C):
This segment, which includes refining, petrochemicals, and polymers, generated the highest revenue in FY24, it reached ₹5,64,749 crore.
2 Retail:
Reliance Retail, which operates a wide network of physical stores and online platforms, is another significant revenue contributor in FY24, its revenue was ₹3,06,848 crore.
3 Digital Services (Jio):
Reliance's telecom business, Jio, which offers mobile, broadband, and digital services, generated ₹1,32,938 crore in revenue in FY24.
4 Oil & Gas E&P:
The Oil and Gas Exploration & Production segment contributed ₹24,439 crore to the total revenue in FY24.
5 Media and Entertainment:
This segment, which includes TV networks, digital platforms, and content production, generated ₹10,826 crore in revenue in FY24.
Regards,
Ankur
Reliance Industries //1 day Support and ResistanceAs of April 29, 2025, here are the key daily support and resistance levels for Reliance Industries Ltd (NSE: RELIANCE) based on recent technical analyses:
📈 Daily Support and Resistance Levels
Level Type Value (₹)
Support 1 (S1) ₹1,191.37
Support 2 (S2) ₹1,177.43
Support 3 (S3) ₹1,153.37
Resistance 1 (R1) ₹1,229.37
Resistance 2 (R2) ₹1,253.43
Resistance 3 (R3) ₹1,267.37
These levels are derived from recent technical analyses and can serve as potential reversal or breakout zones for the stock.
📊 Additional Technical Indicators
Relative Strength Index (RSI): Approximately 48.94, indicating a neutral to slightly bearish momentum.
Moving Averages:
5-Day Simple Moving Average (SMA): ₹1,210.41
50-Day Simple Moving Average (SMA): ₹1,213.72
200-Day Simple Moving Average (SMA): ₹1,216.23
The stock is trading near its short-term moving averages, suggesting a consolidation phase.
📌 Key Observations
Resistance Levels: If Reliance Industries breaks above ₹1,229.37, it may face resistance at ₹1,253.43 and ₹1,267.37.
Support Levels: A decline below ₹1,191.37 could lead to further support at ₹1,177.43 and ₹1,153.37.
Trend Analysis: The stock is currently trading within a range, with key levels at ₹1,229.37 on the upside and ₹1,191.37 on the downside. A breakout above or below these levels could indicate the next directional move.
Please note that these levels and indicators are based on historical data and technical analysis, and actual market conditions may vary. It's advisable to conduct further research or consult with a financial advisor before making investment decisions.

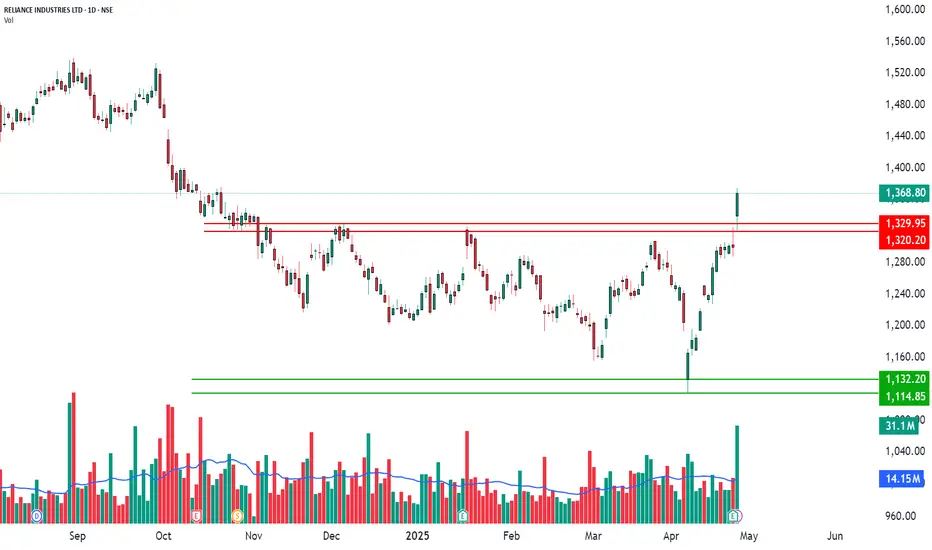
Strong Bullish Breakout! | Daily Time Frame📈 RELIANCE INDUSTRIES LTD – Strong Bullish Breakout!
📅 Date: April 28, 2025
📈 Timeframe: Daily Chart
🔍 Stock: Reliance Industries Ltd (NSE)
📌 Technical Overview:
Reliance Industries has shown strong bullish momentum after breaking out above the important level of ₹1300.90.
Several indicators are supporting this breakout:
✅ RSI Breakout – Showing strong strength.
✅ Bollinger Bands Breakout – Price is breaking outside the bands, showing heavy momentum.
✅ Bullish VWAP Trend – Price is trading well above the VWAP line.
✅ TTM Squeeze Breakout – Major squeeze breakout confirms buyers' control.
🧩 Key Levels:
Major Resistance Broken: ₹1300.90 ✅
Immediate Support Now: ₹1329.95 and ₹1320.20 (red lines)
Next Possible Support: ₹1132.20 and ₹1114.85 (green lines, if reversal happens later)
📊 Volume Analysis:
Heavy spike in volume confirming strong buying activity.
🧠 Observational Bias:
As long as the price stays above ₹1300.90, the momentum remains bullish.
Small dips toward support can be seen as healthy pullbacks.
Reliance : A reliable stock in tough times#RelianceIndustries is on 🔥!
Over the weekend, Reliance Industries delivered stellar results — beating expectations and setting a strong, positive tone for the future! 📈
Today, the stock looks ready to break out after a long consolidation phase. Eyes are now set on the key resistance zone between ₹1480 - ₹1530 — a breakout above this could unlock serious upside potential! 🎯
🛡️ On the downside, ₹1200 remains a rock-solid support level, aligning with its 200-week EMA. Only a major negative event could shake it below this mark — but for now, the momentum is very much with the bulls. 🐂
📊 Valuations? The stock is trading at a P/E of ~26, exactly in line with its 5-year historical average — meaning it’s fairly priced even after the recent gains.
🌟 Plus, the much-anticipated Reliance Retail IPO is gearing up, adding an extra layer of sentimental support that could keep any major corrections in check.
Bottom Line: Having Reliance in your portfolio right now feels like playing with the trend, not against it. 🚀
#Reliance #StockMarket #Breakout #Investing #RelianceRetail #Nifty50 #Jio

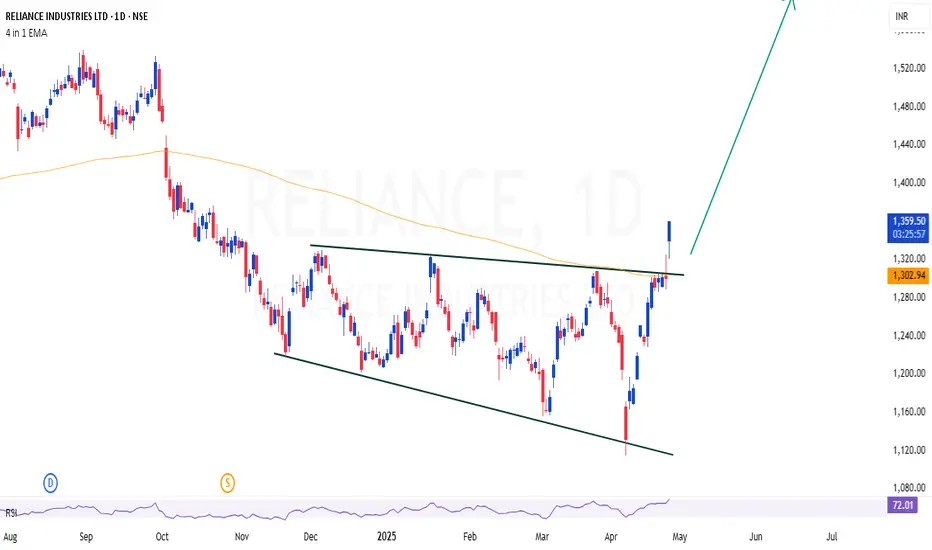
RELIANCE | Lets join hands with Ambani - Looks good for 20% shorRELIANCE | Lets join hands with Ambani - Looks good for 20% short term
Simple trendline (Channel) breakout
CMP : 1359
SL : 1250
Target : 1600
Reliance buy given near 1160-50 enjoy huge profit trail sl 1280How to take trades using Harmonic pattern projection Trade setup is explained below :-
Entry : 1st SL point : 0% is recent top or bottom.
Trailing D: 15.1% is work as trailing SL of buy or sell trade if hit then we have to book profit
.If price goes below 2nd D 22.5% to 24.5% range then early traders can make fresh reversals trade after breaking 1st D 15.1% safe traders can reversal trade after breaking Point D 22.5.4% to 24.5% range
Targets :
Target T1 : 36.1% to 38.3%
Target T3 : 49.1% to 52.5%
T3: 60.9% to 64.8% is our 3rd Target since this is reversal zone so must book profit if break then take fresh trade again
Target T4 : 76.4% to 79.7%
Next Targets are 100% , 127.2% ,141.4% and final Target 161.8%.
How to take reversal trade :
If price going upside/ downside then then buy or sell levels appear on Chart ( Automatically show when price reach any reversal zone of harmonic projection ).
Trailing SL:
After reach 1st Target trail SL to just above or below cost ( for example we are holding sell trade from 100 1st Target 110 hit then move trailing sl to 104-105 and move SL as price move upside or Downside)
Re- Entry :
For Re-entry in any pull back Point D ( 15.1% ) is used for re-entry then SL recent high or low Point SL ( 0% ) .
Blue Line is 1st support/ Resistance
Green line is 2nd support/ resistance
Red line is 3rd Support/ resistance
