macd trading# **MACD Trading Strategy**
MACD (**Moving Average Convergence Divergence**) is a momentum indicator used to identify **trend strength, reversals, and entry-exit points**.
## **1️⃣ Key Components**
✅ **MACD Line:** Difference between the 12-day and 26-day EMA.
✅ **Signal Line:** 9-day EMA of the MACD line (triggers buy/sell signals).
✅ **Histogram:** Shows the gap between MACD and Signal Line (momentum strength).
## **2️⃣ Trading Strategies**
✅ **MACD Crossover:**
🔹 **Bullish:** MACD crosses above the Signal Line → Buy.
🔹 **Bearish:** MACD crosses below the Signal Line → Sell.
✅ **MACD Divergence:**
🔹 **Bullish Divergence:** Price makes lower lows, MACD makes higher lows → Uptrend reversal.
🔹 **Bearish Divergence:** Price makes higher highs, MACD makes lower highs → Downtrend reversal.
### **Conclusion**
MACD is a reliable tool for **trend confirmation and momentum analysis**. Combining it with **support-resistance and volume** enhances trade accuracy. 🚀
RIGD trade ideas

Reliance Industries LtdReliance was founded by Dhirubhai Ambani and is now promoted and managed by his elder son, Mukesh Dhirubhai Ambani. Ambani's family has about 50% shareholding in the conglomerate.
Key Points:-
OIL-TO-CHEMICALS SEGMENT (~57% of revenues)
Under the segment, the company primarily refines crude oil to manufacture/ extract transportation fuels, polymers and elastomers, intermediates and polyesters. It has plants and manufacturing assets located across India in Jamnagar, Hazira, Dahej, Nagothane, Vadodara and others. It has a crude refining capacity of 1.4 million barrels per day. It also has the largest single site refinery complex globally. It had a total throughput of ~77 million metric tonnes in FY22 out of which ~89% was meant for sale.
RETAIL SEGMENT (~23% of revenues)
The company is the largest retailer in India with various store concepts selling consumer electronics, fashion & lifestyle, groceries, pharma and connectivity. It operates ~15,200 retail stores and has a customer base of ~19 crore customers.Its store brands include Reliance fresh, digital, smart, Hamleys, Jio Outlets, netmeds, resQ, etc. It also operates various digital commerce platforms including JioMart, milkbasket, Reliance Digital, Ajio, zivame, urban ladder, netmeds and others. Some of its acquisitions under the segment include Justdial, 7-Eleven, milkbasket, Manish Malhotra, Clovia, Dunzo, etc.
Expansion - Reliance Retail undertook significant expansion in FY22 adding on avg. 7 stores every day and crossed the milestone of 15,000 stores.
DIGITAL SERVICES BUSINESS (Jio) (~11% of revenues)
Jio Digital is India's largest digital services platform with a total subscriber base of ~41 crore subscribers and a market share of 36% in India. It offers wireless connectivity, home broadband and enterprise and SMB broadband under its digital connectivity business. It carried ~10% of the global mobile data traffic in 2021.
Broadband Expansion - The company became the largest broadband provider in India with a market share of 50% within just 2 years of launch.
Shareholders of Jio - The company holds ~67% stake in Jio Platforms while the rest was sold by Reliance to major multinational corporates such as Meta (Facebook), Google, KKR, Vista Equity and others.
OIL & GAS E&P BUSINESS(~1% of revenues)
RIL as an integrated E&P Operator is India’s leading Deepwater Operator. Its domestic portfolio comprises of conventional oil and gas blocks in Krishna Godavari and Mahanadi basins and two Coal Bed Methane (CBM) blocks, Sohagpur (East) and Sohagpur (West) in Madhya Pradesh. The business saw a significant increase in gas production due to ramp-up of production from KGD6 block located in the Krishna-Godawari Basin. It went from producing 2% of India's total gas in Q3FY21 to ~20% in FY22.
Media & Entertainment Business
The company owns Network 18 Media which has presence across full spectrum of content genres such as news, entertainment, sports, movies and live entertainment. Its portfolio includes CNBC TV, Colors, MTV, nick, History tv and others. It also owns digital platforms such as moneycontrol, News 18, CNBC, firstpost, voot and bookmyshow.
Right now Indian Market is not supporting any long position at this moment, but the chart looks very attractive. however I am sharing with you all.I hope you will like & share this publication. Thanks for watching, follow us for more updates visiting again.

"Reliance on the Move: Is This the Start of a Major Reversal?"📢 Market Sentiment Poll: Where Do You See Reliance Industries Heading?
🔘 Bullish – Potential upside towards ₹1,400+ 🚀
🔘 Neutral – Likely to consolidate 📊
🔘 Bearish – Could dip below ₹1,200 📉
💬 Share your market insights in the comments! This poll is for educational purposes only and does not constitute financial advice. Always conduct your own research before making investment decisions.

MOTABHAI - First leg of Correction is over?TF: Daily
Looks like 5 wave impulse is complete (Blue)
Subwaves within each of the motive waves are marked in black
5th being Diagonal abcde
Awaiting breakout confirmation (the falling trendline - Red)

options and database trading# **Options and Database Trading**
Combining **Options Trading** with **Database Trading** can improve decision-making by leveraging **historical data, AI models, and statistical patterns** for better trade execution.
## **1️⃣ Options Trading Basics**
✅ **Call Options:** Right to buy at a fixed price (bullish view).
✅ **Put Options:** Right to sell at a fixed price (bearish view).
✅ **Key Strategies:** Covered calls, straddles, iron condors for different market conditions.
## **2️⃣ How Database Trading Enhances Options Trading**
✅ **Backtesting Strategies:** Uses **historical data** to test option strategies before execution.
✅ **Volatility Analysis:** Predicts market movements using **IV (Implied Volatility) & HV (Historical Volatility)**.
✅ **Real-Time Data Execution:** AI-driven models analyze **OI (Open Interest) and PCR (Put-Call Ratio)** for optimal trade entry.
## **3️⃣ Key Benefits of This Approach**
✅ **Data-Driven Trades:** Reduces emotional bias and improves accuracy.
✅ **Pattern Recognition:** Identifies high-probability setups based on past performance.
✅ **Automated Execution:** Faster decision-making using algorithmic models.
### **Conclusion**
Merging **database-driven insights** with **options trading** creates an **efficient, risk-managed, and profitable trading approach**. 🚀

PositionalNSE:RELIANCE looks like it's corrected a bit
The biggest stock is down
Can add on such levels if holding period is decades
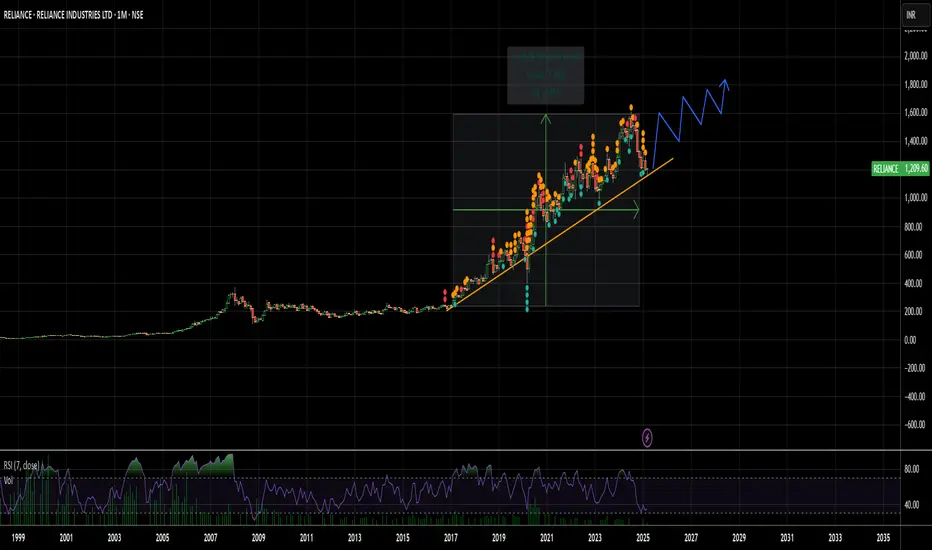
Reliance Industries Long Term Chart Analysis 53% Upside PossibleHello everyone, i hope you all would be doing good in your life and your trading as well. Today i have brought an stock which is a ELEPHANT of indian market yes your guess is right, i am talking about Reliance Stock and it is trading inside the long-term trend within an upward rising channel. The price has tested both the upper resistance band and lower support band multiple times, confirming the channel's reliability. Currently, the stock is near the lower support band (1185-1155), making it a high-probability support zone for potential upside moves. A stop loss is placed at ₹986 in case of a breakdown.
The projected targets are set as follows: Short-term target: 1285, Second target: 1400, Medium-term target: 1532, and the Final long-term target: 1800. The analysis suggests a 53% potential upside if the stock respects the lower band and continues its bullish trajectory. Keep an eye on price action for confirmation before entry.
Disclaimer: This analysis is for educational purposes only. Please consult a financial advisor before making investment decisions.
If you Found this helpful? Don’t forget to like, share, and drop your thoughts in the comments below.

Best buying Opprtunity in Reliance stock Reliance Industries Announces ₹20,000 Crore Green Energy Joint Venture
Reliance Industries Limited (RIL) has partnered with a leading European firm to invest ₹20,000 crore in India’s renewable energy sector.
The joint venture aims to accelerate the development of solar power, wind energy, and green hydrogen production.
As part of this collaboration, advanced gigafactories will be established to manufacture solar photovoltaic (PV) modules, wind turbines, and electrolyzers, promoting indigenous production under the ‘Make in India’ initiative.
The project is expected to generate thousands of direct and indirect employment opportunities, particularly for engineers, technicians, and skilled professionals.
This strategic partnership will contribute significantly to reducing carbon emissions, aligning with India’s Net Zero Emission targets.
Additionally, the venture will enhance India’s position in the global renewable energy market by integrating next-generation energy solutions, smart grid technology, and AI-driven energy management systems.
Support Levels:
Current Support Zone: ₹1,205 - ₹1,214
Extended Support Level: ₹1,150
Major Support Zone: ₹999 - ₹1,019
Resistance Levels:
Immediate Resistance Zone: ₹1,298 - ₹1,316
First Short-term Target: ₹1,450
Second Short-term Target: ₹1,650
Major Resistance Zone: ₹1,578 - ₹1,611 (near all-time high)
The stock is currently testing the support zone of ₹1,205 - ₹1,214, and if this level breaks, the next downside level to watch is ₹1,150. On the upside, the ₹1,298 - ₹1,316 zone acts as resistance, with potential for further movement towards ₹1,450 and ₹1,650 if strength builds.
LIKE & SHARE , Comment For More Stock Analysis

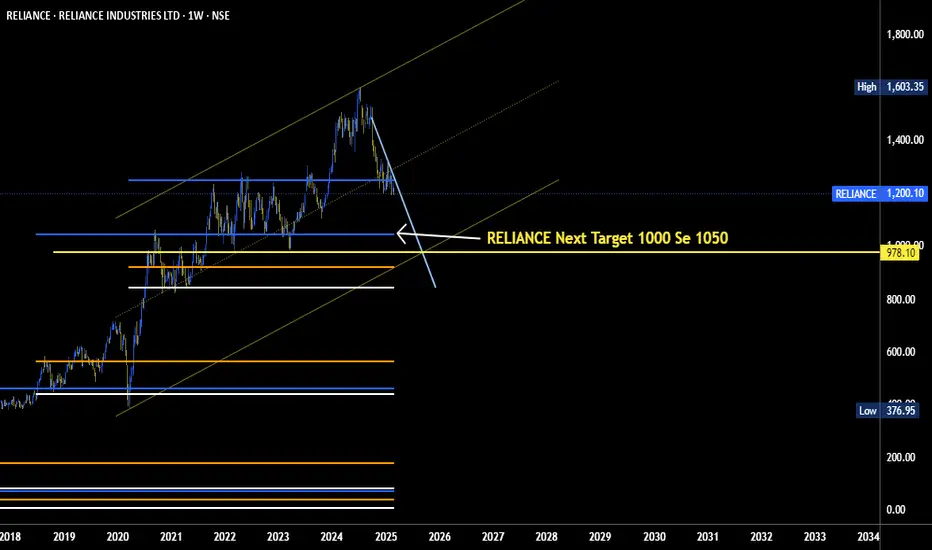
Reliance industries LTDReliance stock running in downtrend , Looking for Weekly and Monthly demand zone Rs 950

Reliance: Leading the Market Correction & Nearing Strong SupportTopic Statement:
Reliance has undergone a sharp correction in recent months, significantly influencing the broader market downturn, but key technical levels suggest a potential stabilization.
Key points:
1. The stock has corrected to the 38.2% retracement level, receiving strong support.
2. Price is now below the 180-day exponential moving average, indicating oversold conditions.
3. Weekly RSI stands at 34, marking an oversold zone from a long-term perspective.

RelianceDate : 03.03.2025
Relaince
Timeframe : Weekly
Remarks :
1 Broke resistance cum support trendline starting since 2018
2 Broke 200 weekly exponential moving average after 2020 covid crash
3 At present at 38.2% which is make or break for stock
4 fresh short only below 38.2% & keep that as stoploss either side trades long/short
Regards,
Ankur

Reliance : Good Entry Point🚨 #Reliance Share – Opportunity or Caution? 🚨
📉 Why the Dip today ? Reliance shares are under pressure today, largely due to a potential ₹125 Cr fine for not setting up the battery unit.
📊 Key Levels to Watch:
🔻 Support: The stock is trading in a strong monthly demand zone of ₹1110-₹1180, with another support zone below. If it can hold ₹1000 in the coming months, a potential reversal rally could be on the cards.
🔺 Resistance: On the upside, ₹1330-₹1360 is a critical supply zone, aligned with the 20W EMA—a breakout above this could signal a trend reversal.
🚀 What’s the Catalyst?
The highly anticipated Reliance Retail IPO in 2025 could act as a strong fundamental support, reducing the chances of a major sell-off.
📌 Bottom Line: If Reliance defends key support levels, this dip could be an accumulation opportunity for long-term investors!
💬 What’s your take—Buy the dip or wait for confirmation? ⬇️
#learn_at_stoxsense #Learntradingwithsudhir #StockMarketIndia #Optiontrading #learntrading #sebiregisteredra #reliance

view on Reliance IndustriesStock name: Reliance Industries
current price: 1200
current support at 1200-1180, it can retest 1220-1240 and may remain in 1240-11800 range.
below 1180 stock can see more fall to 1150-1110
If it breaks resistance above 1240, upside target would be 1290+

Reliance Closed Below Danger level Now Time To Create New Short As of the latest available data, Reliance Industries Limited (RIL) is trading at approximately ₹1,199.60 per share, reflecting a 0.62% decline from the previous close. citeturn0news28 The stock remains 25.44% below its 52-week high of ₹1,608.95, reached on July 8, 2024. citeturn0search6
In recent developments, RIL's subsidiary, Jio Platforms, is developing a cloud-based AI personal computer accessible on any device, aiming to facilitate compute-intensive AI applications at low cost. citeturn0search3 Additionally, Reliance Retail has launched the Shein India Fast Fashion app, marking Shein's return to the Indian market after a previous ban. citeturn0news38
These initiatives underscore RIL's commitment to innovation and market expansion, potentially influencing its stock performance in the near future.
navlistRecent Developments in Reliance Industriesturn0news29,turn0news38,turn0news39
Reliance Target After Monthly Negative Closing is 1031**Reliance Industries Limited (RIL)** is India's largest conglomerate, with diversified businesses in **energy, petrochemicals, retail, telecommunications, and digital services**. It is one of the most valuable companies in India and among the world's largest corporations.
---
### **Key Facts About Reliance Industries:**
- **Founded:** 1958 (by Dhirubhai Ambani)
- **Founder:** Dhirubhai Ambani
- **Chairman & MD:** Mukesh Ambani
- **Headquarters:** Mumbai, India
- **Revenue:** Over **₹9 lakh crore ($110+ billion)** (varies yearly)
- **Stock Listing:** **NSE & BSE** (Ticker: **RELIANCE**)
- **Market Cap:** Among India's highest (over $200 billion)
---
### **Major Business Segments:**
#### **1. Energy & Petrochemicals**
- **Reliance O2C (Oil-to-Chemicals):** One of the world’s largest **refining & petrochemical** businesses.
- **Jamnagar Refinery:** World’s largest refining complex.
- **Renewable Energy:** Investments in **green hydrogen, solar, and battery storage** (Reliance New Energy).
#### **2. Reliance Jio (Telecom & Digital Services)**
- **Jio 4G & 5G:** India’s largest telecom provider.
- **Jio Platforms:** Digital services (JioFiber, JioCinema, JioCloud, etc.).
#### **3. Reliance Retail**
- India’s **largest retail company**, covering:
- **Grocery (Reliance Fresh, Smart Bazaar)**
- **Fashion (Trends, Ajio)**
- **Electronics (Reliance Digital, JioMart)**
#### **4. Media & Entertainment**
- Owns **Network18, Viacom18, JioCinema** (OTT platform).
#### **5. New Energy (Green Investments)**
- Investing **$75 billion** in green energy, hydrogen, and solar power.
---
### **Competitors:**
- **Telecom:** Airtel, Vodafone Idea
- **Retail:** Amazon, Flipkart, Tata Group
- **Energy:** Adani Group, ONGC, IOC
Reliance is constantly expanding into new sectors like **EV battery production, AI, and data centers**. Are you looking for stock insights, latest news, or specific business details? 🚀

Reliance buy 1200 near for long term sl 1140 target 1340-60How to take trades using Harmonic pattern projection Trade setup is explained below :-
Entry : 1st SL point : 0% is recent top or bottom.
Trailing D: 11.4% is work as trailing SL of buy or sell trade if hit then we have to book profit
.If price goes below 2nd D 21.4% then early traders can make fresh reversals trade after breaking 1st D 11.4% safe traders can reversal trade after breaking 2nd D 21.4%
Targets :
Target T1 : 28.3% ( early trade if entry at 11.4% )
Target T1 : 35.1% to 38.2%
Target T3 : 50.1% to 53.2%
T3: 61.8% to 65.1% is our 3rd Target since this is reversal zone so must book profit if break then take fresh trade again
Target T4 : 76.4% to 79.7%
Next Targets are 100% , 127.2% ,141.4% and final Target 161.8%.
How to take reversal trade :
If price going upside/ downside then then buy or sell levels appear on Chart ( Automatically show when price reach any reversal zone of harmonic projection pattern based .
After showing reversal levels wait for confirmation until 21.4% or 28.3 % level not break if break then exit from current buy / sell trade and take fresh reverse trade buy/ sell .
Trailing SL:
After reach 1st Target trail SL to just above or below cost ( for example we are holding sell trade from 100 1st Target 110 hit then move trailing sl to 104-105 and move SL as price move upside or Downside)
Re- Entry :
For Re-entry in any pull back Point D ( 11.4% ) is used for re-entry then SL recent high or low Point D ( 0% ) .
Target is same as early 21.4% , 28.3 , 35.1 and so on
Blue Line is 1st support/ Resistance
Green line is 2nd support/ resistance
Red line is 3rd Support/ resistance

candlestick patterns **SkyTradingZone** is your go-to source for educational content on trading, covering market insights, strategies, and in-depth analysis. Our goal is to empower traders and investors with knowledge to navigate the markets effectively.
---
# **Candlestick Patterns – Part 1: Basics and Key Reversal Patterns**
Candlestick patterns are one of the most powerful tools in **technical analysis**. They help traders understand market sentiment and predict future price movements based on past price action.
📌 **Why Use Candlestick Patterns?**
✅ They provide **visual insights** into price action.
✅ They help identify **market reversals, trend continuations, and breakouts**.
✅ They work well when combined with **support & resistance, volume, and indicators** like RSI or MACD.
---
## **1️⃣ Understanding Candlestick Structure**
A candlestick consists of **four key components**:
📌 **Open** – The price at which the candle starts.
📌 **Close** – The price at which the candle ends.
📌 **High** – The highest price reached during the timeframe.
📌 **Low** – The lowest price reached during the timeframe.
🔹 **Bullish Candle (Green/White):** When the **closing price** is higher than the **opening price**, showing buyers are in control.
🔹 **Bearish Candle (Red/Black):** When the **closing price** is lower than the **opening price**, showing sellers are in control.
---
## **2️⃣ Types of Candlestick Patterns**
Candlestick patterns can be broadly classified into **two types**:
✅ **Reversal Patterns** – Indicate a possible change in trend.
✅ **Continuation Patterns** – Indicate that the trend will likely continue.
---
## **3️⃣ Key Reversal Candlestick Patterns**
### 📍 **A) Bullish Reversal Patterns**
1️⃣ **Hammer**
🔹 A small body with a **long lower wick** (shadow).
🔹 Appears after a **downtrend**, signaling a potential reversal.
🔹 **Indicates buyers have entered the market aggressively.**
📌 **Confirmation:** The next candle should be bullish with high volume.
🔹 **Example:** If Nifty 50 forms a hammer at a key **support level**, it could signal a trend reversal.
---
2️⃣ **Bullish Engulfing**
🔹 A **large green candle** completely engulfs the previous **red candle**.
🔹 Shows **strong buying pressure**, often leading to an **uptrend**.
📌 **Confirmation:** Must occur at a **support level or after a downtrend**.
🔹 **Example:** If a stock forms a **bullish engulfing pattern near a 200-day moving average**, it’s a strong buy signal.
---
3️⃣ **Morning Star**
🔹 A **three-candle pattern** appearing after a **downtrend**:
✅ First Candle – Large **red candle** (sellers in control).
✅ Second Candle – Small **indecisive candle** (doji/spinning top).
✅ Third Candle – Large **green candle**, confirming reversal.
📌 **Confirmation:** The third candle should close above the first candle’s midpoint.
🔹 **Example:** A **Morning Star on Bank Nifty's daily chart** at a key support zone can indicate a bullish rally ahead.
---
### 📍 **B) Bearish Reversal Patterns**
1️⃣ **Shooting Star**
🔹 A small body with a **long upper wick**.
🔹 Appears after an **uptrend**, signaling a potential reversal.
🔹 Shows that **buyers tried to push prices higher but failed, and sellers took control**.
📌 **Confirmation:** The next candle should be bearish with strong volume.
🔹 **Example:** If **Reliance stock** forms a **shooting star** near resistance, it could indicate a **sell-off**.
---
2️⃣ **Bearish Engulfing**
🔹 A **large red candle** completely engulfs the previous **green candle**.
🔹 Indicates **strong selling pressure** and potential **trend reversal**.
📌 **Confirmation:** Must occur at a **resistance level or after an uptrend**.
🔹 **Example:** A **Bearish Engulfing pattern on the Nifty 50 weekly chart** near a **key resistance level** signals weakness in the index.
---
3️⃣ **Evening Star**
🔹 A **three-candle pattern** appearing after an **uptrend**:
✅ First Candle – Large **green candle** (buyers in control).
✅ Second Candle – Small **indecisive candle** (doji/spinning top).
✅ Third Candle – Large **red candle**, confirming reversal.
📌 **Confirmation:** The third candle should close below the first candle’s midpoint.
🔹 **Example:** An **Evening Star on HDFC Bank’s chart** near all-time highs may signal a bearish reversal.
---
## **4️⃣ How to Trade Candlestick Reversal Patterns?**
📌 **Step 1:** Identify the pattern at a **key support or resistance level**.
📌 **Step 2:** Wait for **confirmation** from the next candle.
📌 **Step 3:** Use **indicators like RSI, MACD, or Volume** for extra confirmation.
📌 **Step 4:** Enter a trade with a **stop-loss below/above the pattern’s wick**.
📌 **Example Trade Setup:**
✅ If a **Hammer pattern forms at a support level with increasing volume**, go **long**.
✅ Place **stop-loss** below the candle’s wick.
✅ Target **previous resistance levels** for profit-taking.
---
## **5️⃣ Common Mistakes to Avoid When Using Candlestick Patterns**
❌ **Trading Patterns in Isolation** – Always combine with support/resistance and indicators.
❌ **Ignoring Volume Confirmation** – A strong reversal needs high volume support.
❌ **Entering Without Confirmation** – Wait for a confirming candle before taking a trade.
❌ **Using Too Many Patterns** – Stick to **high-probability setups** like Engulfing, Hammer, and Shooting Star.
📌 **Pro Tip:** The best traders use **candlestick patterns along with market structure, trendlines, and momentum indicators** for higher accuracy.
---
## **Final Thoughts – Why Candlestick Patterns Are Important?**
🚀 **Candlestick patterns provide an edge in understanding market psychology and potential price movements.**
📌 **To Master Candlestick Trading:**
✅ Learn to identify **reliable reversal and continuation patterns**.
✅ Combine with **key support/resistance levels**.
✅ Backtest patterns to see which works best in different market conditions.
By mastering **Candlestick Analysis**, traders can significantly improve their decision-making and **increase profitability in the stock market!** 📈💰
---
📌 **Coming Up Next in Part 2:** **Continuation Candlestick Patterns (Doji, Spinning Tops, Three Soldiers, etc.) and How to Use Them in Trading.**
🔹 **Disclaimer**: This content is for educational purposes only. *SkyTradingZone* is not SEBI registered and does not provide financial or investment advice. Please conduct your own research before making any trading decisions.

RelianceH&S pattern observed on 125 mins
Nifty index also looks weak and Rel in weak condition make it a confirmation
Brace yourself from fresh buy

Reliance Industries Ltd.**Reliance Industries Ltd. (RELIANCE) Stock Analysis**
**Company Overview:**
Reliance Industries Ltd. is one of India's largest conglomerates, with operations spanning across several sectors including petrochemicals, refining, oil and gas exploration, retail, and telecommunications. It holds a dominant position in the Indian market with its diversified businesses, and the company is known for its significant impact on India's economic development, particularly in the telecom and retail industries through its Jio and retail businesses.
**Fundamental Analysis:**
- **Market Capitalization:** Approximately ₹16.61 trillion.
- **Price-to-Earnings (P/E) Ratio:** The stock trades at a P/E ratio of 24.01, which is above the industry average, indicating that the stock is priced at a premium in anticipation of future growth.
- **Earnings Per Share (EPS):** ₹51.13, showing the company's strong profitability in terms of earnings generated per share.
- **Return on Equity (ROE):** 8.29%, suggesting moderate efficiency in generating profits from shareholders' equity.
- **Debt-to-Equity Ratio:** 0.44, indicating that Reliance maintains a balanced approach to using debt in its capital structure, with a moderate reliance on borrowing.
- **Dividend Yield:** 0.41%, which is on the lower side, reflecting a conservative dividend payout policy.
**Technical Analysis:**
- **Current Price:** ₹1,227.70.
- **52-Week Range:** The stock has traded between ₹978.15 and ₹1,608.95 during the past year, displaying significant price volatility.
- **Support Levels:**
- First Support: ₹1,200.00
- Second Support: ₹1,150.00
- **Resistance Levels:**
- First Resistance: ₹1,300.00
- Second Resistance: ₹1,350.00
- **Breakout Point:** A sustained move above ₹1,300.00 could signal the start of a bullish trend, potentially bringing more investors into the stock.
- **Retest Levels:** If the stock breaks above ₹1,300.00, a retest of this level would confirm it as a new support level, solidifying a stronger trend.
**Recent Performance:**
- **1 Week:** The stock has increased by 0.75%.
- **1 Month:** The stock has decreased by 3.92%, reflecting a period of downward pressure.
- **6 Months:** The stock has decreased by 16.35%, underperforming compared to broader market indices.
**Analyst Ratings:**
- **Morgan Stanley:** Maintains an 'Overweight' rating with a target price of ₹1,606, suggesting a 31% upside from the current market price.
- **JP Morgan:** Holds an 'Overweight' rating, with a potential upside of up to 25% from current levels.
**Conclusion:**
Reliance Industries Ltd. continues to be a key player in the Indian market, with strong fundamentals and diversified business operations. Despite its elevated P/E ratio and some short-term underperformance, it remains a long-term growth candidate due to its dominant position in sectors like telecom and retail. Traders should watch key support levels at ₹1,200.00 and ₹1,150.00, and be alert for potential breakout opportunities above ₹1,300.00 for further upside momentum.
*Please note that stock market investments carry inherent risks. It is advisable to conduct thorough research or consult with a financial advisor before making investment decisions.*

what is support and resistance ?**Support and resistance** are key concepts in technical analysis that help traders identify potential price levels where an asset's price might reverse, stall, or break through. They represent areas on a chart where the price has historically had difficulty moving past in a particular direction. These levels are crucial for understanding market behavior, making decisions, and managing risk.
### **What is Support?**
**Support** is a price level at which an asset tends to find **buying interest**, preventing the price from falling further. It's considered a "floor" for the price, where demand is strong enough to halt or reverse a downward movement.
- **Why does support form?**: When the price falls to a certain level, buyers typically believe the asset is undervalued, leading to an increase in demand. As a result, the price tends to bounce off this level and move higher.
- **Support Level**: The more times the price bounces off a level and doesn’t break below it, the stronger the support is considered to be.
#### **Characteristics of Support**:
- Price tends to “bounce” off support.
- The more times the price has touched this level without breaking below it, the stronger the support.
- In an uptrend, the price might pull back to support and then continue its upward movement.
### **What is Resistance?**
**Resistance** is the opposite of support. It is a price level where an asset tends to face **selling pressure**, preventing the price from rising further. It's seen as the "ceiling" for the price, where supply exceeds demand, often causing the price to reverse downward.
- **Why does resistance form?**: When the price rises to a certain level, traders or investors might think the asset is overvalued, leading them to sell, which creates selling pressure. This selling pressure prevents the price from moving above the resistance level.
- **Resistance Level**: Similar to support, the more times the price touches this level without breaking above it, the stronger the resistance is considered to be.
#### **Characteristics of Resistance**:
- Price tends to “bounce” down from resistance.
- The more times the price has touched this level without breaking above it, the stronger the resistance.
- In a downtrend, the price might rise to resistance and then continue its downward movement.
### **How to Use Support and Resistance in Trading**
1. **Identifying Entry and Exit Points**:
- **Buying near support**: Traders may look for buying opportunities when the price approaches a support level, anticipating that it will bounce upward.
- **Selling near resistance**: Traders may look for selling opportunities when the price nears a resistance level, expecting it will reverse downward.
2. **Breakouts**:
- If the price **breaks through** a **support** or **resistance** level, it can signal the beginning of a new trend.
- A **breakout** above resistance may indicate the start of an uptrend (bullish breakout).
- A **breakdown** below support may indicate the start of a downtrend (bearish breakdown).
- Breakouts often come with higher volume and momentum, providing confirmation that the price may continue in the direction of the breakout.
3. **Trend Reversals**:
- **Support turning into resistance**: After a price breaks below support, that same level may act as **resistance** on a price rally. This is known as a "reversal" of roles.
- **Resistance turning into support**: After a price breaks above resistance, that level may now act as **support** in case the price pulls back. This is called a "role reversal."
4. **Consolidation Zones**:
- When price moves within a range between support and resistance, it’s considered **consolidation**. Traders often trade this range by buying at support and selling at resistance, anticipating that the price will remain within the range until it breaks out.
### **Support and Resistance in Practice**
#### **Example of Support**:
- Imagine a stock has been trading at $50 and repeatedly bounces off this level without going lower. Traders will see this as a strong **support level** at $50, where they may place buy orders anticipating a bounce.
#### **Example of Resistance**:
- Similarly, if a stock has been trading at $60 and has failed to move higher than this price on several occasions, $60 is a **resistance level**. Traders might place **sell orders** near $60, expecting the price to reverse and go back down.
---
### **Types of Support and Resistance**
1. **Horizontal Support and Resistance**:
- These are the most straightforward types, where the price repeatedly bounces at a particular level (flat price level) on the chart.
- Example: If the price of a stock frequently stops falling at $50 and rises back up, $50 is a horizontal support level.
2. **Trendline Support and Resistance**:
- Trendlines are diagonal lines that connect significant lows for support or significant highs for resistance.
- Example: In an uptrend, a **trendline support** is drawn by connecting the lows of the price, and in a downtrend, a **trendline resistance** is drawn by connecting the highs.
3. **Moving Average Support and Resistance**:
- Moving averages, such as the **50-day** or **200-day moving average**, can also act as dynamic levels of support or resistance. If the price is above the moving average, the moving average can act as support; if the price is below it, the moving average can act as resistance.
---
### **Importance of Support and Resistance in Trading**
- **Market Psychology**: Support and resistance reflect the **psychology of the market**—buyers are willing to buy at support, and sellers are willing to sell at resistance. These levels give insight into where market participants are likely to take action.
- **Risk Management**: Support and resistance levels are often used for **setting stop-loss** and **take-profit** levels. Traders may place a stop-loss just below support when buying or just above resistance when selling to limit potential losses.
- **Predicting Future Price Movements**: By understanding where support and resistance levels are, traders can anticipate potential price movements. When the price approaches one of these levels, it gives traders insight into how the market might react.
---
### **Conclusion**
Support and resistance are essential tools in technical analysis that help traders identify price levels where an asset might reverse, stall, or break through. Understanding how to read and apply these levels can provide valuable insights into market trends and price movements. By combining support and resistance with other technical indicators and analysis, traders can improve their entry and exit decisions, manage risk, and enhance their overall trading strategies.

what is Database trading ?**SkyTradingZone** is your go-to source for educational content on trading, covering market insights, strategies, and in-depth analysis. Our goal is to empower traders with knowledge to navigate the markets effectively.
---
## **What is Database Trading?**
### **1️⃣ Introduction to Database Trading**
Database trading is a systematic approach to trading that involves collecting, storing, and analyzing large amounts of market data to make informed trading decisions. It is widely used by hedge funds, quantitative traders, and algorithmic traders to gain a statistical edge in the market.
### **2️⃣ How Database Trading Works**
Database trading relies on:
✅ **Data Collection** – Gathering historical and real-time market data.
✅ **Data Storage** – Using databases like SQL, MongoDB, or cloud-based storage.
✅ **Data Analysis** – Identifying patterns, trends, and inefficiencies.
✅ **Automated Execution** – Placing trades based on predefined conditions.
---
## **3️⃣ Components of a Database Trading System**
### 🔹 **1. Market Data Collection**
- Data sources: TradingView, Binance API, Alpha Vantage, Yahoo Finance, Quandl.
- Data types:
✅ **Price data** (OHLC – Open, High, Low, Close)
✅ **Volume data**
✅ **Order book data**
✅ **Sentiment data** (News, social media)
### 🔹 **2. Database Management**
- **SQL Databases** (PostgreSQL, MySQL) for structured data storage.
- **NoSQL Databases** (MongoDB, Firebase) for unstructured data.
- **Cloud Storage** (AWS, Google Cloud) for scalability.
### 🔹 **3. Data Analysis & Strategy Development**
- **Statistical Analysis:** Mean, median, standard deviation of price movements.
- **Backtesting:** Testing strategies on historical data before applying them live.
- **Machine Learning:** Predicting price movements using AI models.
### 🔹 **4. Trade Execution & Automation**
- **Python-based bots** using APIs like CCXT, Alpaca, Binance API.
- **Algorithmic Trading:** Executing trades based on programmed logic.
---
## **4️⃣ Why Use Database Trading?**
📊 **Reduces Emotional Trading** – Trades are executed based on data, not emotions.
📈 **Enhances Strategy Accuracy** – Backtested strategies improve success rates.
🔄 **Scalability** – Can be applied to multiple markets (stocks, forex, crypto).
🏦 **Institutional-Level Trading** – Aligns with hedge fund and quantitative strategies.
### **Next Steps in Database Trading**
In upcoming sections, we will cover:
✅ **How to Collect and Store Market Data**
✅ **Setting Up a Trading Database**
✅ **Backtesting & Automating Strategies**
Stay tuned for more advanced insights!
---
🔹 **Disclaimer**: This content is for educational purposes only. *SkyTradingZone* is not SEBI registered, and we do not provide financial or investment advice. Please conduct your own research before making any trading decisions.

What is database trading ?**Database trading** refers to the use of databases to store, analyze, and manage large volumes of financial market data to inform trading strategies and decisions. Traders, especially quantitative and algorithmic traders, rely heavily on databases to organize and manipulate market data such as stock prices, volume, economic indicators, and other financial metrics. By using database-driven systems, traders can access vast amounts of data quickly, perform complex analyses, and backtest strategies.
### **How Database Trading Works**:
1. **Data Collection and Storage**:
- In database trading, market data is collected from various sources such as exchanges, financial reports, and APIs. This data includes price histories, order book information, trading volume, technical indicators, news sentiment, and more.
- The data is stored in **databases** (such as relational databases like **MySQL**, **PostgreSQL**, or NoSQL databases like **MongoDB**) where it can be structured for easy retrieval, querying, and analysis.
2. **Data Analysis**:
- Traders use databases to organize and query market data. For example, a trader might query the database to retrieve historical price data for a specific asset, calculate moving averages, or identify patterns.
- Advanced analysis is typically carried out using tools like **SQL** for querying databases, and **Python**, **R**, or **MATLAB** for data manipulation, statistical analysis, and developing trading algorithms.
3. **Backtesting**:
- One of the key uses of databases in trading is **backtesting**. Traders use historical data stored in databases to test their trading strategies. They can simulate how a strategy would have performed in the past by applying it to the data and calculating metrics like returns, risk, and drawdowns.
- **Backtesting engines** often pull data from databases and execute simulated trades based on the historical market conditions stored in the database.
4. **Real-Time Data Processing**:
- Some database systems, especially when integrated with **real-time market data feeds**, allow traders to monitor live market conditions and execute trades automatically based on predefined algorithms.
- Databases play a critical role in storing and processing real-time data, ensuring that algorithms can access up-to-date information and respond to market movements promptly.
5. **Machine Learning and AI**:
- **Machine learning algorithms** can be applied to the data stored in databases to identify trends, correlations, or anomalies that can inform trading decisions.
- Traders can use databases to train models on historical data and then deploy these models in live markets to predict price movements or optimize strategies.
---
### **Why Database Trading is Important**:
1. **Efficient Data Management**:
- Financial markets generate massive amounts of data every second. Databases allow traders to **store, organize, and retrieve** this data efficiently, even when dealing with vast datasets across multiple assets and timeframes.
2. **Scalability**:
- Databases can handle **large datasets** with millions of data points. This is crucial for traders who require a scalable solution to process high-frequency trading data, tick-level data, or large historical datasets.
3. **Speed and Accessibility**:
- Trading systems need to be fast, particularly in high-frequency or algorithmic trading. Databases provide a structured and efficient way to store and query data, ensuring that traders can access the data they need quickly to make real-time trading decisions.
- **Low latency** is especially important when trading in fast-moving markets where decisions must be made in fractions of a second.
4. **Backtesting and Strategy Optimization**:
- The ability to backtest trading strategies with historical data is one of the core advantages of database trading. Traders can assess the viability of their strategies over different market conditions before applying them in live trading.
- This allows for **strategy optimization** by tweaking parameters and testing different variations of a strategy to find the most effective approach.
5. **Data Integrity and Accuracy**:
- Databases provide mechanisms for ensuring the **integrity** and **accuracy** of data, which is crucial for making reliable trading decisions. Traders can perform thorough data validation and cleaning before using the data in their models.
6. **Data-Driven Decision Making**:
- Database trading enables **data-driven decision-making** by providing traders with the ability to analyze and interpret large sets of financial data. This minimizes emotional decision-making and helps traders make rational, systematic choices.
---
### **Types of Data Used in Database Trading**:
1. **Market Data**:
- **Price data**: Historical and real-time price information for various assets (stocks, options, forex, etc.).
- **Volume data**: Data related to the number of shares or contracts traded.
- **Bid/Ask data**: The best available prices for buying (bid) and selling (ask) an asset at a given time.
- **Order book data**: Information about the orders waiting to be executed in the market.
2. **Fundamental Data**:
- **Earnings reports**, **balance sheets**, and **cash flow statements** of companies.
- **Economic indicators** such as GDP growth, inflation, interest rates, and employment numbers.
3. **Technical Indicators**:
- Data generated by calculating moving averages, RSI (Relative Strength Index), MACD (Moving Average Convergence Divergence), Bollinger Bands, and other common indicators used for technical analysis.
4. **Sentiment Data**:
- Data extracted from **news feeds**, **social media**, and **financial reports** to gauge market sentiment.
- Sentiment analysis can help predict how market participants might react to news events or earnings announcements.
5. **Alternative Data**:
- **Geolocation data**, **weather data**, and other unconventional datasets that might provide an edge in predicting market moves.
---
### **How Database Trading Can Be Profitable**:
1. **Automated Trading Strategies**:
- Traders can design **algorithmic trading strategies** that use data stored in the database to execute trades automatically based on certain criteria. By leveraging historical data, these strategies can identify patterns and opportunities that would be hard for human traders to spot.
2. **High-Frequency Trading (HFT)**:
- High-frequency traders rely on **fast, automated decision-making** systems that use real-time data stored in databases. By processing large volumes of data quickly, high-frequency trading algorithms can capture small price movements across numerous assets, leading to profitability through sheer volume of trades.
3. **Risk Management**:
- By leveraging databases for real-time data analysis, traders can implement **dynamic risk management** systems that adjust position sizes, stop losses, and take profits based on market conditions. This helps protect profits and minimize losses.
4. **Predictive Analytics**:
- Machine learning models and predictive analytics can be applied to the data in the database to forecast price movements, asset correlations, and volatility patterns. Traders can use these insights to make informed decisions about entry and exit points.
5. **Improved Strategy Development**:
- With access to vast amounts of data, traders can continuously test, optimize, and improve their strategies. This allows them to stay ahead of market trends and make adjustments to their trading algorithms when necessary.
6. **Diversification**:
- Traders can use databases to analyze a wide range of assets, strategies, and timeframes. This allows them to implement **diversified strategies** and reduce the overall risk of their trading portfolio.
---
### **Challenges of Database Trading**:
1. **Data Quality and Integrity**:
- If the data stored in the database is incomplete, inaccurate, or inconsistent, it can lead to incorrect trading decisions. Ensuring data quality is paramount to successful database trading.
2. **Complexity and Maintenance**:
- Database-driven trading systems require regular maintenance, updates, and tuning. Traders need to manage both the infrastructure (databases, servers, etc.) and the software (trading algorithms, data processing pipelines) to ensure the system runs efficiently.
3. **Computational Power**:
- Analyzing large volumes of data in real-time can require significant computational resources. For high-frequency or machine learning-based strategies, having access to powerful servers or cloud-based infrastructure is crucial.
4. **Latency**:
- In fast-moving markets, even small delays in data processing can affect trading outcomes. High-frequency and algorithmic trading strategies require **low-latency systems** to ensure that orders are executed quickly and accurately.
### **Summary**:
**Database trading** is a powerful approach for managing, analyzing, and executing trades using vast amounts of financial data. It provides traders with a structured and efficient way to store, analyze, and access data, which is essential for developing profitable trading strategies. By using databases, traders can automate their strategies, backtest their models, and analyze large datasets in real time to gain a competitive edge in the market.

what is price action ?**Price action** refers to the movement of an asset’s price over time, depicted through charts. It is the study of historical price data to make trading decisions, without relying on technical indicators or other external tools. In other words, price action traders focus purely on the price itself—its patterns, trends, and movements—believing that all necessary information is contained within the price action.
### Key Concepts in Price Action:
1. **Candlestick Patterns**:
- **Candlestick charts** are commonly used in price action analysis. These charts show the open, high, low, and close prices for a given time period.
- Certain candlestick patterns (like Doji, Engulfing, Hammer, or Shooting Star) are used to identify potential market reversals or continuations.
2. **Support and Resistance**:
- **Support** is the price level at which an asset tends to find buying interest, causing the price to bounce upward.
- **Resistance** is the price level at which an asset tends to encounter selling pressure, causing the price to move lower.
- Price action traders often watch these levels to predict potential reversals or breakouts.
3. **Trends**:
- Price action trading is largely based on understanding market trends (uptrends, downtrends, or sideways movement).
- Traders use **higher highs and higher lows** in an uptrend, and **lower highs and lower lows** in a downtrend to identify and trade with the trend.
- The idea is to "trade with the trend" rather than against it, as trends tend to persist over time.
4. **Price Patterns**:
- Traders look for recurring price patterns such as **triangles**, **flags**, **head and shoulders**, **double tops**, and **double bottoms**. These patterns help in forecasting future price movements.
- For instance, a **double top** pattern (a resistance level followed by a pullback, then another attempt to break the resistance) can signal a potential bearish reversal.
5. **Market Structure**:
- **Higher highs** and **higher lows** indicate an uptrend.
- **Lower highs** and **lower lows** indicate a downtrend.
- A trader’s goal is to identify the structure of the market and trade based on whether it’s in an uptrend, downtrend, or consolidation phase.
6. **Breakouts and Pullbacks**:
- **Breakouts** occur when the price moves beyond a defined support or resistance level, signaling the start of a new trend.
- **Pullbacks** (or retracements) are temporary reversals within the existing trend, and traders often look to enter positions during pullbacks to trade in the direction of the trend.
### How to Use Price Action in Trading:
1. **Identify the Trend**:
- The first step in price action trading is identifying whether the market is trending (up, down, or sideways).
- In an uptrend, you’d typically look for buying opportunities when the price pulls back to a level of support or a previous low.
- In a downtrend, you’d look for selling opportunities at resistance or previous highs.
2. **Look for Key Levels**:
- Identify major **support** and **resistance** levels where price has historically reversed. These levels act as psychological barriers for traders, and price action often tends to react to them.
- **Breakouts** above resistance or below support can indicate the start of a new trend.
3. **Trade Patterns**:
- Watch for **candlestick patterns** (like pin bars, engulfing candles, or dojis) at key levels. These can act as signals for potential trend reversals or continuations.
- For example, a **bullish engulfing candle** at a support level could suggest the start of an uptrend, while a **bearish engulfing** at a resistance level could signal a downtrend.
4. **Wait for Confirmation**:
- Price action traders often wait for price to confirm a setup before entering a trade. For instance, if the price breaks above resistance, they may wait for a pullback to test the new support before entering a long trade.
5. **Risk Management**:
- Price action traders use **stop-loss** orders placed at logical levels based on the price structure (for example, below a recent low in an uptrend).
- **Position sizing** is also crucial. Since price action can often be subjective, it’s important to use proper risk management to avoid large losses.
### Benefits of Price Action Trading:
- **No Indicators Needed**: Price action trading is based purely on price data, making it simple and easy to follow, without relying on technical indicators.
- **Flexibility**: Price action can be used across different time frames, from minute charts to daily or weekly charts.
- **Versatility**: It works across all asset classes (stocks, forex, commodities, crypto, etc.), and it is ideal for both short-term and long-term traders.
- **Clear Signals**: Price action trading gives direct, clear signals based on price movements, which many traders find easier to interpret than complex indicators.
### Drawbacks of Price Action Trading:
- **Subjectivity**: Interpreting price action can sometimes be subjective, as it depends on the trader’s understanding of the price movements and patterns.
- **Requires Experience**: Price action trading involves a lot of nuance and requires experience to recognize and act on subtle price signals effectively.
- **Lack of Confirmation**: Without indicators, traders may sometimes miss the confirmation signals, leading to false or untimely trades.
### Example of Price Action in a Trade:
- A trader sees that a stock has been in a **bullish trend** for a few weeks (price making higher highs and higher lows).
- The stock pulls back to a level of **previous support** (a point where price has reversed before).
- At that support level, the trader notices a **bullish engulfing candlestick pattern** forming.
- The trader enters a **buy** position, placing a stop loss just below the support level, aiming to capture the next upward movement.
### Conclusion:
Price action trading is a straightforward yet powerful method for analyzing and trading markets based on price movements alone. By focusing on patterns, trends, and key price levels, traders can make decisions without relying on complex indicators. However, it does require a keen eye and experience to interpret price movements correctly, and it’s essential to combine it with sound risk management practices.
