LTCUSD sell below $125.00Litecoin has started to turn bearish alongside the broader cryptocurrency market after falling below the key $125.00 level. The four-hour time frame is also showing that the LTCUSD pair has now broken under key trend-line support. Weakness in the LTCUSD pair should be expected in the short and medium-term while the price continues to trade below the pivotal $125.00 level.
The LTCUSD pair is only bullish while trading above the $125.00 level, key resistance is found at the $140.00 and $160.00 levels.
If the LTCUSD pair trades below the $125.00 level, key support is found at the $110.00 and $100.00 levels.
LTCUSD.P trade ideas

LTCUSD correction overdueLitecoin is starting to struggle in early Wednesday trade as the cryptocurrency appear overdue for a much-needed technical correction. A sustained move below the $125.00 level should provoke technical selling in the LTCUSD pair toward at least the 110.00 support level. If bulls can break the $140.00 the LTCUSD pair offer relatively limited technical resistance until the $160.00 level.
The LTCUSD pair is only bullish while trading above the $125.00 level, key resistance is found at the $140.00 and $160.00 levels.
If the LTCUSD pair trades below the $125.00 level, key support is found at the $110.00 and $100.00 levels.


LTCUSD watching bearish patternLitecoin has failed to follow Bitcoin higher and rally to a fresh 2019 trading high, with the popular crypto so far finding resistance from the just below the $145.00 level. The one-hour time frame is showing that bulls need to make a new high as a bearish head and shoulders pattern is in play. Overall, the LTCUSD pair is still extremely bullish while trading above the important $125.00 level.
The LTCUSD pair is only bullish while trading above the $125.00 level, key resistance is found at the $145.00 and $160.00 levels.
If the LTCUSD pair trades below the $125.00 level, key support is found at the $120.00 and $100.00 levels.

LTCUSD Trend before halvingLTCUSD Trend before halving....Want to cross -check later against this trend.

LTCUSD Bullish Trend - Long Term Weekly ChartLTCUSD Bullish Trend - Long Term Weekly Chart... Right time to accumulate now. Come on guys..come on guys....Board the bus now and it will not stop in the middle until destination of 350+ for sure. :)

LTCUSD could hit $160.00Litecoin has advanced to fresh 2019 trading high following a bullish technical breakout above the $120.00 resistance level on Tuesday. The LTCUSD pair is now marching forward, with the $134.00 and $160.00 levels the two major bullish targets ahead. The daily time frame is clearly showing that a huge inverted head and shoulders pattern could now be in the forming.
The LTCUSD pair is only bullish while trading above the $110.00 level, key resistance is found at the $134.00 and $160.00 levels.
If the LTCUSD pair trades below the $110.00 level, key support is found at the $100.00 and $90.00 levels.

LTCUSD $100.00 breakout supportLitecoin has followed the broader cryptocurrency market lower this week, with the sixth largest crypto so far finding technical support from the $96.50 level. The $100.00 level is still seen as major breakout support on both the four-hour and daily time frames. Bulls need to rally the cryptocurrency towards the $120.00 level to negate the bearish double-top pattern formation on the four-hour time frame.
The LTCUSD pair is only intraday bullish while trading above the $110.00 level, key resistance is found at the $120.00 and $135.00 levels.
If the LTCUSD pair trades below the $110.00 level, key support is found at the $96.50 and $85.00 levels.

LTCUSD $110.00 pivotLitecoin has started to trade lower after hitting $120.00, with the sixth largest cryptocurrency so far finding support from the $100.00 level. The LTCUSD pair now needs to break above the $110.00 level to encourage new buying towards the $114.00 and $120.00 levels. The Ichimoku indicator on the four-hour time frame is showing that the $110.00 level is major support before the $90.00 region.
The LTCUSD pair is only bullish while trading above the $110.00 level, key resistance is found at the $114.00 and $120.00 levels.
If the LTCUSD pair trades below the $110.00 level, key support is found at the $100.00 and $90.00 levels.

LTCUSD breakout underwayLitecoin has moved to a fresh 2019 trading high after buyers performed a bullish weekly price close above the psychological $100.00 resistance level. The LTCUSD pair has ignited a bullish pattern on the four-hour time frame and may soon target towards the $125.00 level. Sellers will need to force price back under the $100.00 level to change the strong intraday bullish bias surrounding the cryptocurrency.
The LTCUSD pair is only bullish while trading above the $100.00 level, key resistance is found at the $125.00 and $135.00 levels.
If the LTCUSD pair trades below the $100.00 level, key support is found at the $94.00 and $85.00 levels.

LTCUSD bullish above $85.00Litecoin is holding above major technical support in early Tuesday trade after the sixth largest cryptocurrency by market capitalization was rejected from just above the $100.00 level. If LTCUSD bulls can hold price above the $85.00 level another test of the $100.00 level seems likely. Overall, the bullish inverted head and shoulders pattern on the four-hour time frame still has an upside target of at least $130.00.
The LTCUSD pair is only bullish while trading above the $85.00 level, key resistance is found at the $100.00 and $130.00 levels.
If the LTCUSD pair trades below the $85.00 level, key support is found at the $77.00 and $70.00 levels.

LTCUSD faces formidable resistanceLitecoin is once again testing towards the best levels of 2019, with the sixth largest cryptocurrency facing formidable resistance from the $100.00 level. The Ichimoku indicator is showing that the LTCUSD pair is pushing through cloud resistance on the weekly time frame. Sellers need to move the price below the $77.00 level to shift the current bullish bias surrounding the LTCUSD pair.
The LTCUSD pair is only bullish while trading above the $77.00 level, key resistance is found at the $100.00 and $130.00 levels.
If the LTCUSD pair trades below the $77.00 level, key support is found at the $65.00 and $58.00 levels.

LTCUSD bullish above $75.00Litecoin is attempting to move higher in early week trade after the sixth largest cryptocurrency by market capitalization was given a boost by the latest strong rally in Bitcoin. The LTCUSD pair only has an intraday bullish bias while trading above key technical support, at $75.00. Bulls will soon need to break the former monthly trading high or the LTCUSD pair may come back under downside pressure.
The LTCUSD pair is only bullish while trading above the $75.00 level, key resistance is found at the $85.00 and $99.00 levels.
If the LTCUSD pair trades below the $75.00 level, key support is found at the $65.00 and $58.00 levels.

LTC / USD Price Analysis: Leaning On SupportLTC / USD Short-term price analysis
Litecoin retains its bearish short-term trading bias, with the LTC / USD pair still trading below its 200-period moving average on the four-hour time frame.
The four-hour time frame is showing that the LTC / USD pair is correcting back towards trendline resistance after finding strong technical support from the $65.00 level.
Technical indicators on the four-hour time frame are rising alongside the recent recovery in the LTC / USD pair.
Pattern Watch
Traders should note that the bearish breakout from the symmetrical triangle pattern has yet to reach its full downside target.
Relative Strength Index
The Relative Strength Index is bullish on the four-hour time frame, although it is now approaching overbought conditions.
MACD Indicator
The MACD indicator is bullish on the four-hour time frame, with the MACD signal line generating a buy signal.
LTC / USD Medium-term price analysis
Litecoin retains its bullish medium-term trading outlook, with the cryptocurrency still holding price above major technical support on the daily time frame.
The daily time frame is also showing that multiple bullish patterns have emerged, with an inverted head and shoulders pattern and a falling wedge pattern now present.
Technical indicators are attempting to correct higher on the daily time frame, following the recent sharp drop from just below the $100.00 level.
LTC / USD Daily Chart by TradingView
Pattern Watch
Traders should note that both bullish patterns highlight the $120.00 level as a potential upside target.
Relative Strength Index
The Relative Strength indicator is attempting to move higher on the daily time frame, although it has yet to turn bullish.
MACD Indicator
The MACD indicator is also attempting to turn bullish on the daily time frame.
Conclusion
Litecoin is attempting to regain its short-term bullish bias, with the popular cryptocurrency facing a key test of buying demand over the coming trading sessions.
The emergence of multiple bullish patterns on the daily timeframe suggests that the LTC / USD pair could start to trade above the $100.00 level over the medium-term.

LTC / USD Price Analysis: Bearish RetraceLTC / USD Short-term price analysis
LTC has a bearish short-term trading bias, with the LTC / USD pair now creating bearish lower lows and trading beneath its 200-period moving average on the four-hour time frame.
The bearish double-top pattern formation on the four-hour time frame continues to weigh on short-term trading sentiment with the LTC / USD pair so far finding interim support from the $68.00 level.
The four-hour time frame shows that key upcoming short-term support is located $60.00 and $54.00 levels.
Pattern Watch
Traders should note that a large inverted head and shoulders pattern remains present across the four-hour time frame.
Relative Strength Index
The Relative Strength Index is bearish on the four-hour time frame, although it is now attempting to recover from oversold conditions.
MACD Indicator
The MACD indicator is neutral on the four-hour time frame, with the MACD signal line and histogram failing to generate a clear trading signal.
LTC / USD Medium-term price analysis
LTC still has a bullish medium-term trading outlook, with the cryptocurrency trading well above its trend defining 200-day moving average.
The daily time frame shows that the LTC / USD pair is retracing lower after the recent upside rally created a much larger inverted head and shoulders pattern.
Key technical support on the daily time frame is currently located at the start of the April bullish rally, around the $60.00 level, and the pair’s 200-day moving average, at $50.00.
www.tradingview.co
LTC / USD Daily Chart by TradingView
Pattern Watch
Traders should continue to monitor the neckline of the bullish inverted head and shoulders pattern on the daily time frame.
Relative Strength Index
The Relative Strength Index is bearish on the four-hour time frame, although it is now attempting to recover from oversold conditions.
MACD Indicator
The MACD indicator has turned bearish on the daily time frame, with the MACD signal line continuing to issue a sell signal.
Conclusion
LTC is still under pressure in the short-term, with the four-hour time frame highlighting that the near-term sentiment towards the LTC / USD pair is still bearish.
The daily time frame is still showing that the inverted head and shoulders pattern remains valid, while the $50.00 level is the key downside area to watch over medium-term.

LTCUSD $65.00 major weekly supportLitecoin is struggling to move higher on Wednesday, as the sixth largest cryptocurrency by market capitalization failed to rally alongside Bitcoin on Tuesday. The LTCUSD pair is still trapped within a bullish descending triangle pattern on the daily time frame. Overall, the LTCUSD pair still has a bullish weekly trading bias above the $65.00 level, which is the neckline of the large inverted head and shoulders pattern.
The LTCUSD pair is only bullish while trading above the $65.00 level, key resistance is found at the $85.00 and $100.00 levels.
If the LTCUSD pair trades below the $65.00 level, key support is found at the $50.00 and $45.00 levels.

LTC $3100 in 2021Here is histroy of LTC coin before & after of halving you can clearly see in chart if after halving we can take up to only half 5000% we are on $3100.....

LTC ANALYSIS BULLISH SCENARIOIn my opinion LTC has to hold $42 for a bullish scenario. If this is actually the 4th wave down before the 5th wave up to the 1.618 extension. If does happen, I'm going to consider a bullish outlook as we could possibly make 5 impulse waves up rather than an ABC correction.

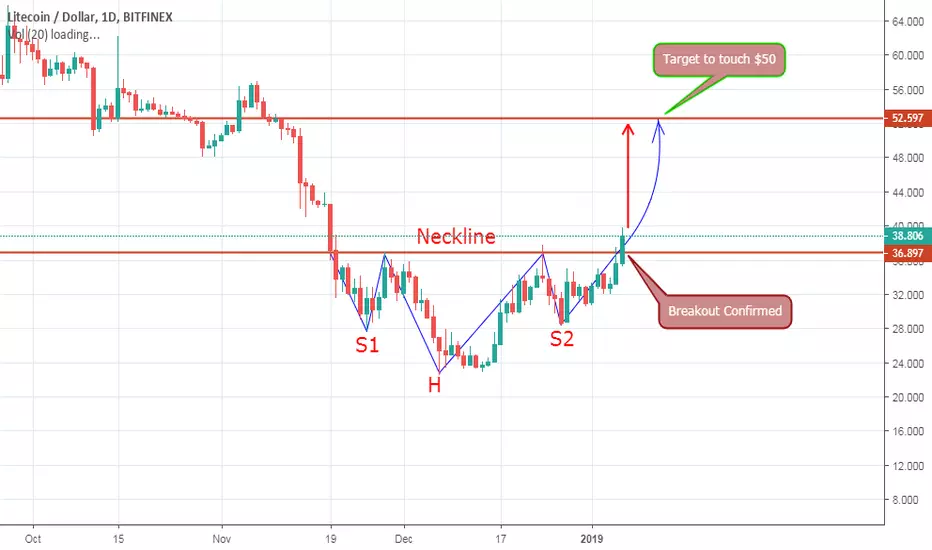
LTC Latest Chart Analysis Hello Everyone Hope you are doing good
In This Chart we can clearly see Breakout of Inverse H&S Pattern which is a Positive sign of Uptrend Current Price of Litecoin is $37.88 and it can move upto $50 as per this Chart Pattern. The area of $27.701–$29.349 is a critical support zone on the downside.
Hope this will help you
Thanks For watching Hit the like button if you like my work.
Possible count on LTCIt's probable that this was a large 3rd wave up and we're going to have a 5th wave up to hit a 1.618 extension.


LTCUSD : LITECOIN IS READY TO MOVE ?can give good profit in short time
for all target you can check my previous chart

LiteCoin (LTCUSD) buy setup - High risk high reward tradeBuy LTCUSD upon a close above 27 on day chart
Targets: Open
SL: 22
