#LTC/USDT Litecoin Price Bullish Breakout Indicates PotentialBased on the price action, it is anticipated that there will be a retest at $110 for LTC/USDT as it breaks out of the resistance trendline.
Trade ideas

LTCUSDT - LitecoinLTCUSDT - LiteCoin
Initially traced a Rising Wedge pattern, then broke down.
Recently witnessed a trendline breakout.
Identify significant levels.
Consider a potential entry at current levels with a tight stop loss.
Trade outcome might be a binary bet – either 0 or 1 😁.
Utilize a tight stop loss for greater leverage and aim for larger targets.

"No Way" - LTC ChartHello Traders
For HODL's only
Buy above $165, target 280 / 444 / 555 / 900 / 1111 / 1444
Plot is mentioned on the chart
Stay safe.. Trade according to your risk profile.
Let me know if you agree or disagree in comments... Looking forward
Best Regards


LTC Signals Green: Buy Now, Thank Me Later!Gemini
Conversazione con Gemini
immagine del profilo
Short Fondamental, recent news and desclaimer ltc coin in english usa
Mostra bozze
Litecoin (LTC) Fundamentals:
Peer-to-peer (P2P) digital currency designed for faster transactions compared to Bitcoin.
Launched in 2011, it's one of the earliest and well-established altcoins (alternatives to Bitcoin).
Uses a different hashing algorithm than Bitcoin, allowing for quicker block confirmation times (around 2.5 minutes compared to Bitcoin's 10 minutes).
Aims to be more scalable than Bitcoin by having a higher maximum supply of 84 million coins (compared to Bitcoin's 21 million).
Recent LTC News:
Price: As of March 24, 2024, LTC is trading around $86.64 USD, with a slight increase in the last 24 hours.
Volatility: The cryptocurrency market is generally volatile, and LTC's price can fluctuate significantly.
Disclaimer:
I am not a financial advisor and this information shouldn't be considered financial advice. Investing in cryptocurrency involves a high degree of risk. Do your own research before making any investment decisions.

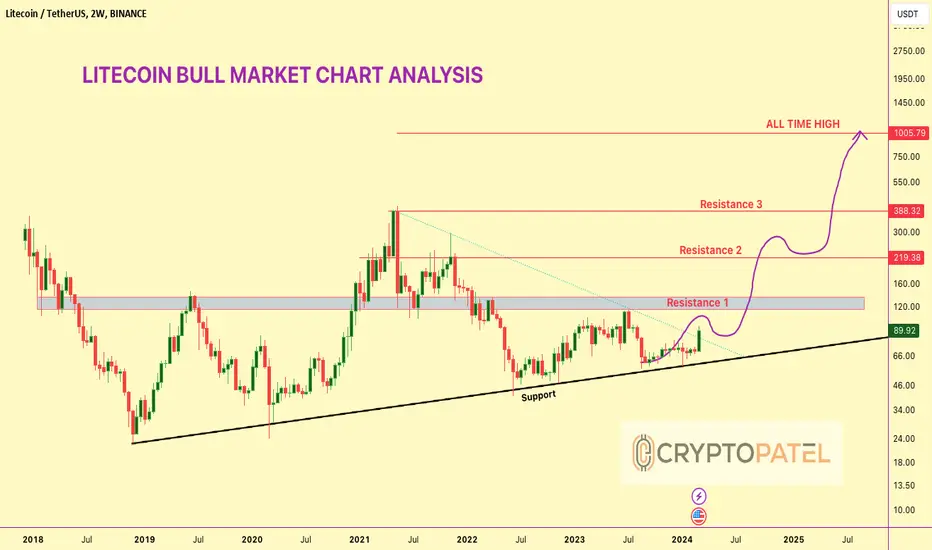
LITECOIN BULL MARKET CHART ANALYSIS#LITECOIN BULL MARKET CHART ANALYSIS
1⃣ CRYPTOCAP:LTC Stong Bounced From Support $60 Level
2⃣ Next Major Resistance is $115-$120 Level
3⃣ Bull Market Targets: $219/$388/$500/$700/$1000
4⃣ Entry: Buying Dip is good Opportunities
5⃣ Profit: Almost 50% Up from Our Last #LTC Setup
6⃣ Long Term: I am Super Bullish in the Long Run
RT/Like if you agree with my setup.
Thank you
#Cryptocurrencies #Altcoins
LTC: Bulls Ready to Charge! Breakout Potential Ahead 💎 LTC is poised to break multiple resistance levels, including the resistive trendline and a significant resistance zone, while also forming a bullish W pattern. This confluence of factors suggests a potential bullish move for LTC.
💎 If LTCUSDT manages to break out above the resistance level, it could pave the way for further upward movement towards subsequent resistance levels. Conversely, in the event of a pullback in price, we can anticipate a bounce from the demand zone, providing support to the bullish momentum.
💎 However, should LTCUSDT break down below the demand zone, it would be prudent to exercise caution and refrain from trading LTC in that scenario. This breakdown would signal a potential shift in market sentiment towards bearishness, warranting a reassessment of trading strategies.

ltc can go down so hello every one here . this market is in under risk so please make sure own your research . according me ltc can go down because btc is so high and ltc also draw a trangle pattern . please follow me for more trade

LTC : Booked a profit of about 7.12% on the invested capital Closed the position for the same reasons I closed other positions in Crypto on the same day: a high interest rate environment and the possibility of a recession hitting the global market in the near future.
I will consider re-entry if the price crashes and returns to cheaper valuations from a technical viewpoint.
Other posts related to the same coin are attached below. Do check them out too.

LTCusdt Binance Futuers Analysis Ltcusdt Long /Short Entry And Exit Points ,Follow The Chart Support /Resistance For Swing Trades For Maximum Gain ,Scalp (3-4 Days) Tp /Entry Are Mentioned In Chart
Important: Always Use Low Lev Never Gamble N Greed

Ltcusdt long76.80 breakout trade planning
76.50 to. 77.50 An entry can be planned within this price
Risk Reward Ratio 1;5

LTC Seems bearish because breakdown the triangle First target 41 and second near 33-26
LTC breakdown the triangle

$LTC Do or Die situationCRYPTOCAP:LTC | Litecoin
After 6 years of following this trendline,🫨 we are now seeking support once more to validate its significance.
Anticipating a minor upward movement followed by a more substantial pullback to retest the trendline for confirmation.
As in LTF, we can see a channel breakdown target is close to $50, so in the worst case, that's possible.
This moment could prove critical for #Litecoin's future.
Stick to your plan, be disciplined, and manage risk accordingly.

LITECOIN IS LOOKING FOR A BULLISH MOVE...📈⚡️Breakout of the resistance zone will result in a bullish movement.
Expected Targets are:
TP - 90

LTC FORMING BULLISH SHARK PATTEN LTC clearly formed bullish shark and bullish divergence, if LTC breaks trend line we can see the target as 115$ and if losses 80$ support we can see the next support level 70$.
#Bitcoin #nft #bnb #eth #btc #BSC #Binance #trading #altcoins #cryptocurrency #crypto

LTC/USDT: Bullish Momentum After Halving and Bullish Order Block
In this LTC/USDT technical analysis, we explore the potential for a bullish trend. The presence of a bullish order block and the recent halving event suggest a buying area and an anticipated price bounce.
Analysis (180 words):
1. Buying Area - 76-78 due to Halving and Bullish Order Block:
The recent Litecoin (LTC) halving event has significant implications for the cryptocurrency's price. As the block reward for miners gets reduced, the overall supply decreases, leading to potential upward pressure on the LTC/USDT price. This scarcity factor often drives demand and can result in a bullish trend.
Moreover, technical analysis reveals the presence of a bullish order block in the 76-78 price range. A bullish order block is a significant price level where buyers have shown strength and absorbed selling pressure in the past. It serves as a strong support zone, which makes it an attractive buying area for traders looking to enter the market at a favorable price.
2. Price Projection - Expecting a Bounce to 96-100:
With the confluence of the halving event and the bullish order block, we expect the LTC/USDT price to experience a notable bounce. As the buying interest increases around the support area, the price is likely to gain momentum and move towards the resistance level at 96-100.

LTC/USDT : Bullish Reversal Ahead Amid LTC Halving Narrative ?
In this LTC/USDT technical analysis, we explore a potential bullish reversal for Litecoin against the US Dollar Tether (USDT). As the price hovers around the buying area of 85 - 86, we anticipate a bounce towards 92 - 94.
Additionally, the LTC halving narrative provides a bullish implication for the cryptocurrency's future. Let's delve into the key technical indicators and chart patterns.
Considering the current market sentiment, there is a strong likelihood of LTC experiencing a bullish bounce in the near term. Our analysis suggests that once the price finds support at the buying area, a possible rally could take LTC towards the resistance zone of 92 - 94.
It is important to monitor the price action closely to confirm the upward momentum before entering any long positions.
Adding to the positive outlook is the LTC halving narrative, which has historically had a bullish implication on the cryptocurrency's price. LTC halving occurs approximately every four years and results in a reduction of block rewards for miners, decreasing the new LTC supply entering the market.
As demand continues to grow, this limited supply could drive the price higher in the long run.

LITECOIN under Bearish Mode#Litecoin 1hr. Chart Analysis
As per previously movements of CRYPTOCAP:LTC into #HarmonicWave Patterns of Butterfly Bullish trend is completed and now CRYPTOCAP:LTC moving under Ascending Broadening Wedge Pattern, it indicates always Bearish signal. It means, Soon CRYPTOCAP:LTC reach out towards lower of $89 soon in 24 hrs. after break-out of $90 again.
As per this Harmonic Wave signal, it's next cycle goes to completion with final cycle on Bullish trend towards $100 again up to next week.
Always read research and analyse pattern, signals, waves and indicators before starts any trade and trade with using of #StopLoss, It's #NFA & #DYOR
also, LIKE, SHARE & COMMENTS on it...

Short LtcThe strategy utilizes a combination of trend analysis and momentum indicators to identify potential downtrends in LTC's price action. It aims to capture profits from downward price movements by entering short positions when the conditions align.


H&S formation in LTC 1hr chartDespite of the upcoming halving event, LTC 1hr chart shows formation of H&S pattern. A down move till the trendline support is expected. It's only a chart based analysis not a financial advice.

LITECOIN - Falling Wedge PatternNYSE:LTC 1-hr. Chart Analysis
Litecoin moving under #FallingWedge Pattern from last 10 days, and it was created new #ATH of 2023 on 1st July 2023 at $115 and after that continously falling from previous All Time High Mark 10 days ago.
Under this Falling Wedge pattern and #FIBretracement markup points, mostly chances to reach out again $88 to $85 within coming 3-5 days, if market is not suddenly Pumping out before that.
Always #DYOR and Trade wisely by using #StopLoss, It's #NFA
Must LIKE & SHARE it..

LTC/USDT Potential for Bullish Reversal Ahead of Halving Event !
The upcoming Litecoin halving event, scheduled to occur in one month, adds to the bullish narrative. Traders and investors should closely monitor these factors as they could present promising trading opportunities.
Buying Area at 90-93:
The LTC/USDT pair has historically exhibited strong support levels within the range of 90-93. This range has proven to be a significant area where buyers have entered the market, leading to subsequent price increases.
Traders seeking to initiate long positions can consider buying within this range, as it offers a favorable risk-to-reward ratio.
Expected Price Bounce towards 125-130:
Based on recent price action and technical indicators, there are indications of a potential price bounce for LTC/USDT. We anticipate the pair to move towards the range of 125-130, which has previously acted as a notable resistance level.
LTC Halving as a Bullish Factor:
An additional bullish factor for Litecoin is the upcoming halving event, scheduled to take place in one month.
During halvings, the block rewards for miners are reduced by half. This event has historically triggered a supply reduction and increased demand, leading to price appreciation.
Additionally, monitoring market developments and adjusting stop-loss levels as the trade progresses is recommended.
Conclusion:
In conclusion, the technical analysis of LTC/USDT suggests the potential for a bullish reversal. With a buying area between 90-93 and an expected price bounce towards 125-130, traders can identify favorable trading opportunities. The upcoming Litecoin halving event adds to the bullish narrative. However, it is essential to implement effective risk management strategies and stay informed about market dynamics.
