IndusInd BankIndusind bank yesterday break his trendline and also today break his weekly resistance line
IDUSB trade ideas

INDUSIND BANK ready for a ride?INDUSINDBK(INDUSIND BANK) has given breakout from the symmetrical pattern it has been forming for the last few months, and it has closed above the resistance level as well for the day. If it closes above 1070 levels, it might rally to further highs.
Cheers! This is as per my Analysis. Feel free to share your view about this. Please do your analysis before trading/Investing.
Happy Trading.

IndusInd Bank Ltd. - Bulls are in.The price action pattern in NSE:INDUSINDBK is trying to attract the bull traders to join the move and push the price further higher.
NSE:INDUSINDBK has crafted a pennant or symmetrical triangle pattern that has given us a bullish breakout and ready to soar the price higher.
One may create a long position with a stop loss below 984.
Like, Follow & Share for new updates.

Trendline Breakout A trendline breakout is possible in Indusind bank. A great selling zone can be seen between 964 and 979 price range which provides a strong support base. Although the volumes are low, but a potential breakout can happen in future.
Target Price - 1110
Stop loss - 960

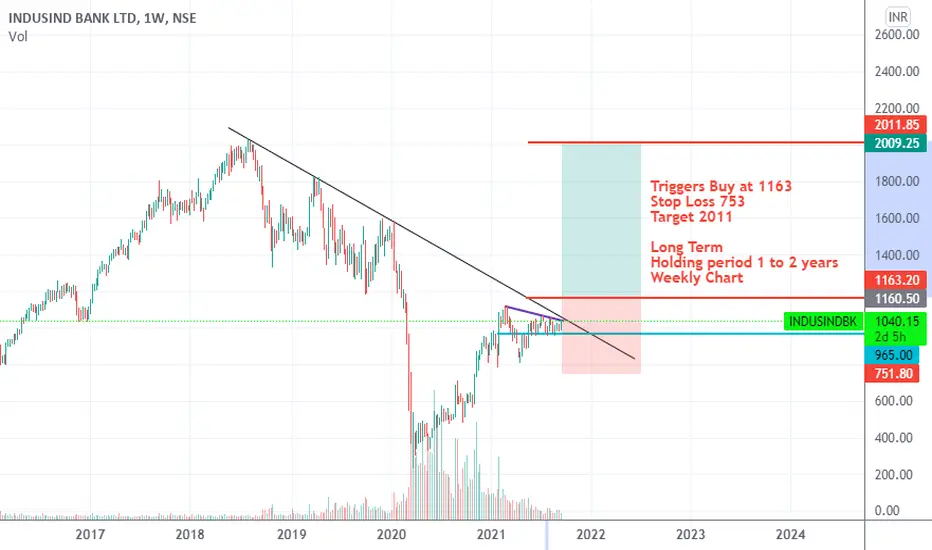
70 percent Expected Long Term View 1 to 2 years70 percent Expected Long Term View 1 to 2 years
Price not yet triggered.
Buy if the price crosses 1163
Stop Loss at 753
Target 2011
Long term view, so the target expected if for the time frame 1-2 years. I can be wrong as well, so this is not a trade recommendation.
Weekly Time Frame
Indusind Bank: Descending TriangleIndusind Bank is forming a Descending Triangle Pattern on the daily chart.
Details are given in the chart itself.

Short Term pick up ✌✌✌This scrip is expected to give short term return as it had formed a beautiful patte n. So traders keep on your radar to catch the momentum. Thanks to all 🙏🙏🙏

INDUSIND BANKLook for strength in ensuing days, and a strong b/o.
Target: 200 Dma on weekly chart. It may move further, look for strength.


INDUSINDBKINDUSIND BANK is consolidating to break Daily and Weekly trend lines ... once it is done next hurdle is at 1200 ... looking good for long after breakout

indus bank buy on every dip for long turmindus bank buy on every dip for long turm by prajapati9951...

#Indusindbk cash : Looks good around 1024-1026#Indusindbk cash -Positional call
14.09.2021
looks good around 1024-1026
stoploss 1000
tgt 1068-1070
cmp 1036.60

Indusind bank gearing upPrice range is narrowing up, break and sustain above the descending trendline will take it towards ATH. Volume also getting dried up.
Keep in radar

INDUSINDBK TL & SYM TRI BREAKOUTKeep an eye on Indusind bank symmetrical triangle breakout on daily & trend line breakout on weekly.
978 is PIVOT.

perfectly working with the levelsfib level is calculated and working perfectly fine look for both long and short positions in indusind bank

Indusind Bank As in previous month already shared the view on indusind bank. Till date it is in tight consolidation zone which 970-1030 this the range in which it is trading from last couple of weeks. If it close above 1030 and sustain for sometime than 1070,1100 is target for the indusind. And technically moving average is bullish in and RSI is neutral which is 48.1. My view is, it’s in tight consolidation zone if it break it’s resistance which 1030-40 than coming levels are 1100,1150. Don’t take any trade without your own research.

Symmetrical Triangle in INDUSIND BANKWe can see a formation of a symmetrical triangle in the INDUSIND BANK 4 hours timeframe chart. This setup looks good to me, an entry above 1045 for targets of 1120 and 1240 with a stop loss of 962. Here the risk-reward ratio is 1:2.35 for the final target of 1240. Also, it is taking good support from the 200 EMA, which is a positive sign for the bullish movement.
We can see the final target within a time period of 1 to 2 months.
It is just my analysis, if you go long you should do your analysis before entering.


INDUSBANK hourly chart analysis and setupHello Traders👋
Today i have made a post on indusbank hourly timeframe
I hope you find this post helpful and informative👍
The targets and stoploss would be given in the charts or they would be according to pivot points
Thank You
—DISCLAIMER—
I am not a SEBI registered financial advisor
Please consider your consultant's advise a must , all the setups posted here will be considered as informative and helpful post
I shall not be responsible for your profits and losses

Volatility contraction playing out on IndusInd Bank?A self-explanatory chart, can see a good rally provided the Bank Nifty doesn't correct too much from here.

INDUSIND BANK - Time to go SHORTAll details have been scripted in the chart so that the idead is well understood.

Support and resistance of Indusind bank.Please follow trendlines for support and resistance. Please do your own analysis before taking any trade
