Buy idea The stock is trading in a strong uptrend which has been marked on the chart. D+W+M is above 60 RSI which is again an indicator showing uptrend. Stock has given breakout of Aug 2017 and consolidated for approx 3 months. Can pick a good movement if the breakout candle comes with good volume. If you see monthly chart, there is a cup and handle pattern breakout. The target of this could be very big if anyone can hold for 2-3 years.
US0070261070 trade ideas

Aditya Birla Capital: Technical Analysis and Investment PerspectCrab Pattern Formation: Aditya Birla Capital has formed a Crab pattern, which is typically seen as a bullish reversal signal, indicating potential upward price movement.
Key Support Level: The stock is currently positioned at a strong support level of approximately ₹167, which could act as a crucial point for a price recovery.
Significant Decline from All-Time High: The stock has experienced a decline of about 30% from its all-time high, suggesting it may be undervalued and presenting an attractive entry point for investors.
Long-Term Investment Opportunity: Considering the technical setup and support levels, Aditya Birla Capital appears to be a favorable choice for long-term investment strategies.

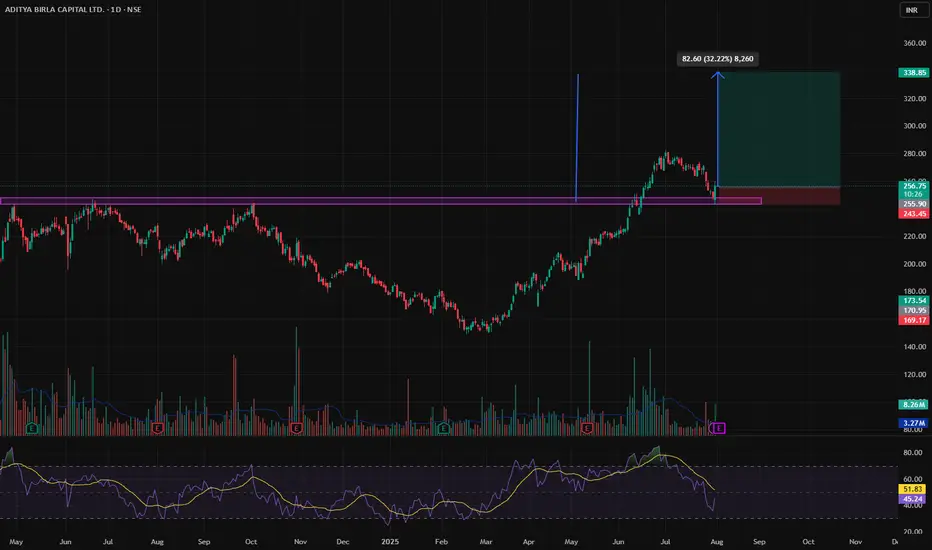
Aditya Birla - LONGEntry - 275 - 280
SL - 215
Target - 450
Entry Zone: ₹275 – ₹280
The 275–280 zone offers a favorable risk-reward entry aligned with the current trend structure.
Stop Loss: ₹215
A break below ₹215 would invalidate the bullish setup and suggest a deeper correction.
Target: ₹450
This is a medium-to-long-term target, which aligns with the breakout from a multi-month base and offers an attractive reward-to-risk ratio of approx. 3:1.
DISCLAIMER
This analysis is for educational purposes only and does not constitute financial advice. Please do your own research and manage your risk accordingly.

Cup & Handle breakout, momentumSTOCK has given positive breakout in last week after retest
good for long
ONLY FOR EDUCATIONAL PURPOSE NOT FOR SUGESSTION
ABCAPITAL - Strong Momentum + Strenght RisingABCAPITAL
Key Observations
1. All time high BO
2. Cup & Handle Pattern
3. Base BO
4. Rising Strenght On Strenght Meter
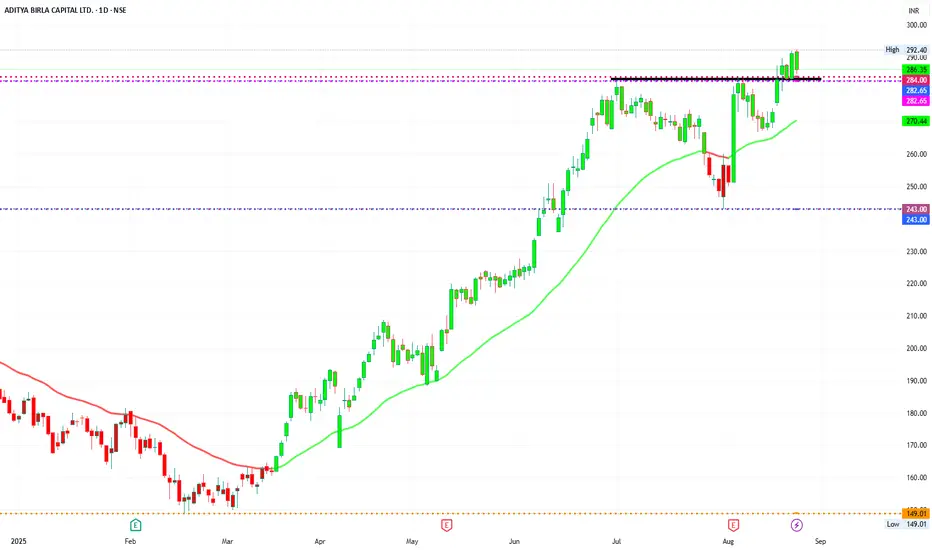
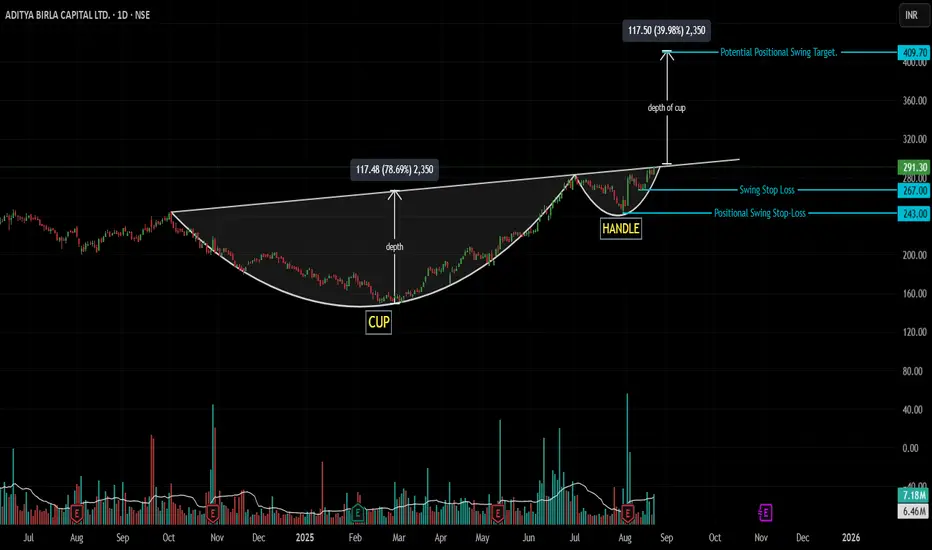
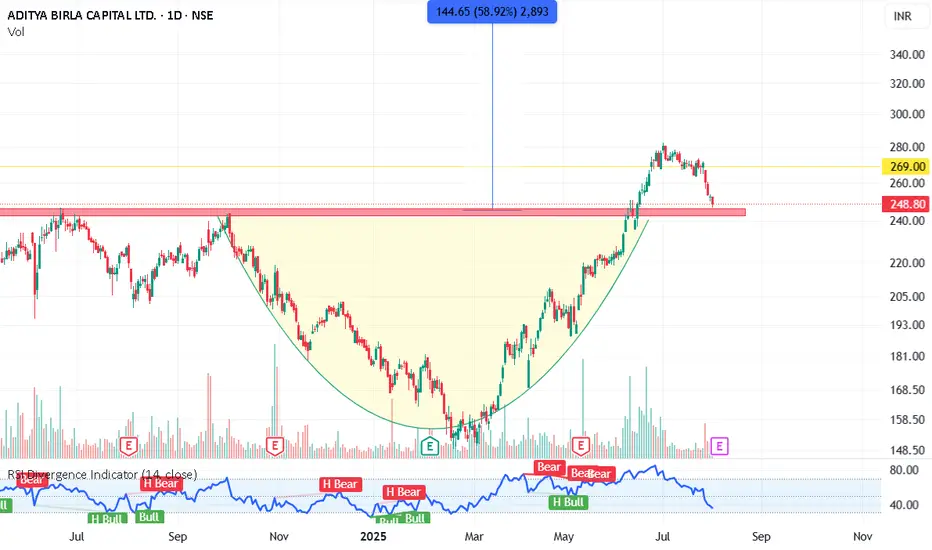
Volcanic Cup & Handle Breakout Imminent! (Swing/Positional)Script: NSE:ABCAPITAL | Timeframe: Daily | Pattern: Cup and Handle | Idea: Swing/Positional
Idea Analysis:
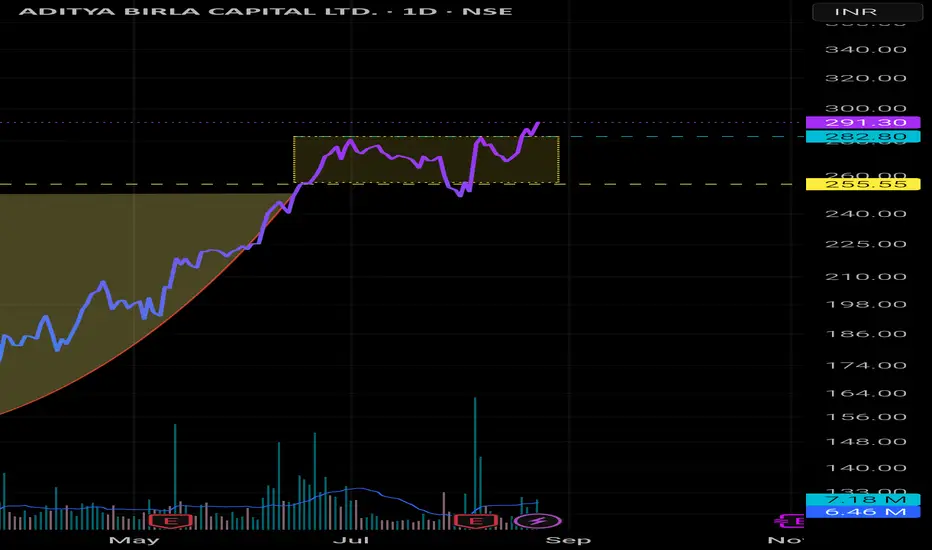
Aditya Birla Capital is demonstrating exceptional strength! After a brilliant bullish run that defined the right side of its Cup, the stock is now completing a bullish consolidation and is primed for its next major breakout.
The Powerful Run: The stock exhibited explosive momentum as it rounded off the bottom of its Cup, rallying powerfully from its lows to re-test the key resistance near ₹290. This strong impulse move is a clear sign of dominant buying interest.
The Short Rest: Following every strong run comes a period of rest. Since its peak, the price has been forming the Handle of a large Cup & Handle pattern. This isn't a sign of weakness, but a healthy bullish consolidation—a catch of breath where the stock digests its previous gains.
The Next Leg: This handle has now tightened sufficiently, bringing volatility to a contraction point. The stock is coiling at the handle's upper trendline, suggesting the "short rest" may be over. A breakout would signal the beginning of the next leg up in the larger bullish narrative.
Why This Looks Bullish:
Strong Momentum: The prior run proves there are strong buyers in this stock.
Constructive Action: The handle is a classic bullish continuation pattern or VCP (Volatility Contraction Pattern)
Volume Confirmation: A breakout with high volume will confirm the resumption of the uptrend.
Trade Strategy:
For Both Swing & Positional Traders:
Entry: On the closing of a candle that breaks above the trendline. The ideal candle is thick and green with minimal upper wick, confirming the end of the rest period.
Stop Loss (SL): Low of the breakout candle or ₹267 (Placed below the very recent low).
Stop Loss (SL) (Positional): ~₹243 (Low of the handle's low)
Target 1 (Swing): Initial Risk-to-Reward 1:2. Trail stops after.
Potential Long-term Target : ~₹410 (2-3 months horizon)
Key Levels:
Pattern Breakout: Above the trendline.
Major Support/Stop Level: ₹243
Positional Target (Pattern Projection): ₹400/410
⚠️ Disclaimer:
This post is for educational purposes only and does not constitute financial advice. Trading stocks involves substantial risk of loss and is not suitable for every investor. The price targets and levels are hypothetical projections based on technical analysis and are not a guarantee of future performance. Always conduct your own research and consider your risk tolerance before making any investment decisions.
👍 If you agree with this analysis, please give it a Boost!
💬 Which stock would you like to see featured in the next technical breakdown? Let me know in the comments!
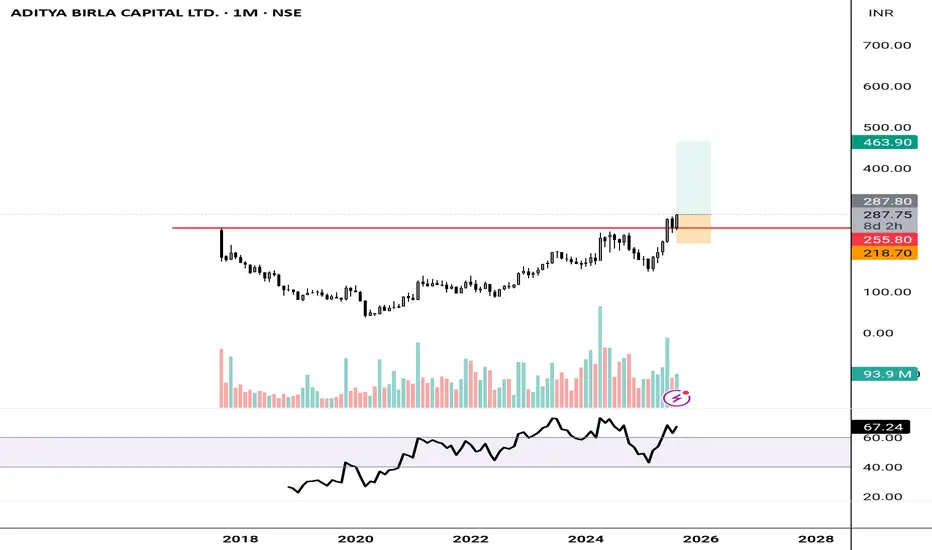
ABCapital (Aditya Birla Capital), C&H on weekly, Target ~450On weekly chart the script ABCapital has completed C&H Pattern and as per that ~450 seems to be the target in next 8-12 months.
Stop loss : Little below recent swing low of 245

ABCAPITAL Positional BUY- CUPABCAPITAL Positional BUY- CUP
ABCAPITAL Positional BUY- CUP
ABCAPITAL Positional BUY- CUP
ABCAPITAL(cup& handle)My analysis is large capital company with good returns.
Key piont is Make cup and handle pattern look into chart how was possible to Target reach . Road map create for our target is 230, 300 but .. respect to SL .. LIKE ME .
Company has delivered good profit growth of 47.2% CAGR over last 5 years
Shareholding pattern (%)
As On Dec-23
Promoter 69.0 %
DII 8.4%
FII 10.6 %
Others 12.0 %
for MORE check in my TradingView ID
If You LIKE👌👌 MY Idea ......Boost.🔥🔥🔥.. its.
"Disclosure : I am not Sebi-registered." This channel is for only educational purpose. Any profit/loss, I am not responsible.
Before taking any trade on our charts / calls, please consult your financial advisors. Thanks🙏

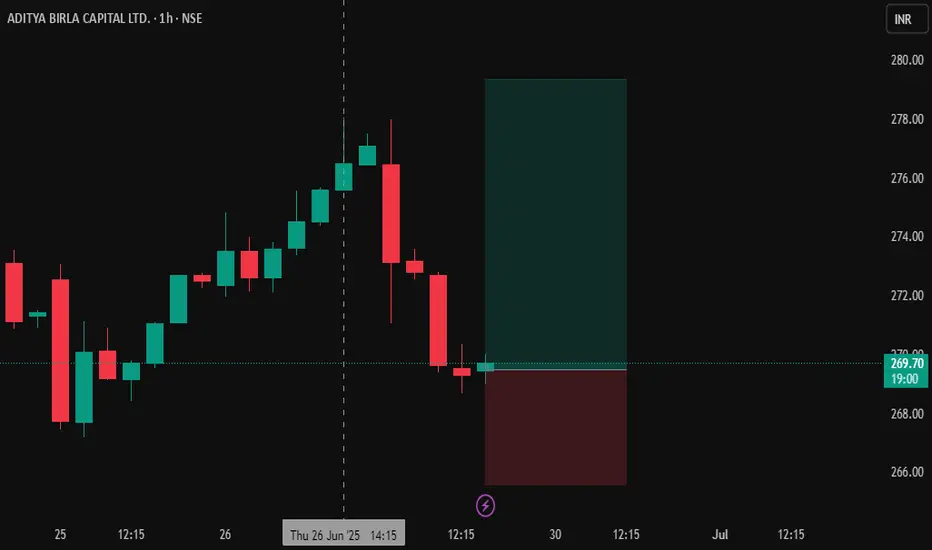
Rejection at ATH and Selling setup in ABCapitalAfter rejection of projected ATH 283.30, ABCapital is open for a sell opportunity below 271
Targets are 264.55, 257.35 and 253.35, respectively.
RSI crossing below 50 will give support to this bearish view.

CUP AND HANDLE IN ADITYA BIRLA CAPITAL LTD.The Stock Has Formed Cup And Handle. It Has Achieved Its First Target, After Good Consolidation ,It Has Broken Out With Volume For Its Next Target. The Initial 3 Targets Are Shown In The Chart. Rest Targets Will Be Set As The Chart Unfolds. Good Luck.Ty.

Breakout retestingThis stock is retesting the breakout level and will fly if Market and earning will support.
keep watching.
This is no any trade recommendation only for educational purpose
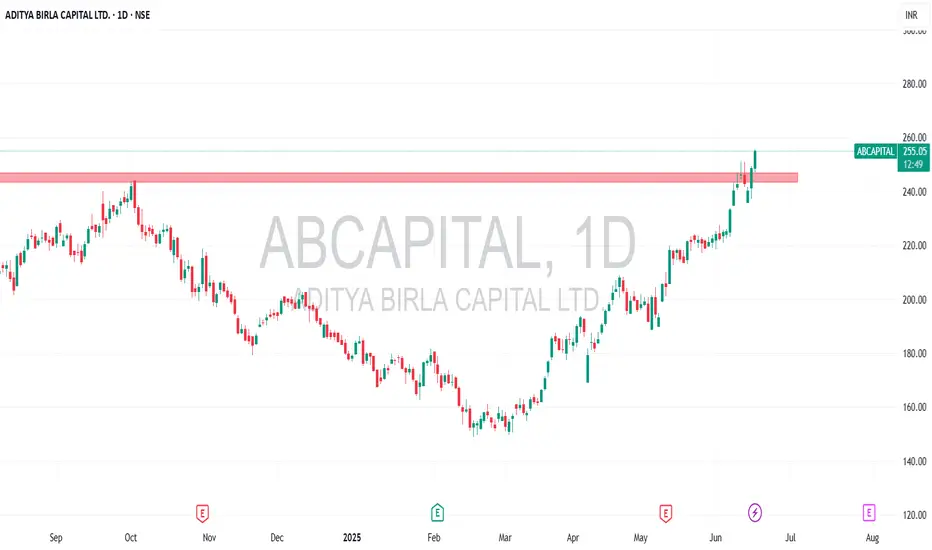
ABCapital’s Daily Retest: Bullish Bounce IncomingOn the Daily timeframe, price is revisiting the ₹244–₹248 zone, which had capped rallies three times before the breakout on 17 June 2025. After carving out a classic rounding bottom, ABCapital surged—now it’s offering a second chance to enter:
- Zone to Watch: ₹244–₹248 (prior resistance → new support)
- Timeframe: Daily
- Trend: Strongly bullish in both short and long term
- Upcoming Catalyst: Q2FY26 earnings on 4 August 2025
- Entry Strategy:
1. Look for bullish price action (pin‑bar, bullish engulfing, etc.) on daily candles
2. Verify with a volume pickup on the bounce before initiating a long 👍
Why It Works
- Daily retests of former resistance zones often lead to reliable bounces
- Rounding bottom reflects deep accumulation by smart money
- Daily trend remains intact until broken with conviction
Risk Management
• Stop‑loss just below ₹242
• Trail stops higher as price confirms strength
Targets
- Short‑term: ₹260
- Long‑term: ₹280+ and keep trailing.
🚀 A textbook daily‑timeframe retest in a powerful uptrend—perfect for fresh entries or scaling in.
Disclaimer: This is not financial advice. Conduct your own due diligence and manage risk prudently.
If this resonates, 👍 Boost, 💬 Comment, and 📝 Share your take!
❓ Got another stock in mind? Feel free to ask me which ticker you’d like analyzed next!
Ask ChatGPT

ABCAPITALADITYA BIRLA CAPITAL PVT LTD, After successful breakout stock is showing pullback. have a look on it. this can reward 25-30 % in few weeks.
ABC CAPITALchart looks good with sl at closing below 265.65 , chart made high yesterday with rsi going above 70 level and faking breakout
AUBANK back to All Time High.AUBANK is a few points away from the price where it started.
The trading strategy is to wait for the resistance range 250-246.90 for a retest of the all-time high and upper targets of 261.50 to 268 as new highs.
Upon rejection or confirmation of rejection of this resistance level, prices will fall to 231 and 221, respectively, as T1 and T2.

Aditya Birla Capital Ltd (ABCL)Aditya Birla Capital Ltd (ABCL) is an India-based holding company for the financial services businesses of the Aditya Birla Group, operating as a non-deposit-taking non-banking financial company (NBFC). Its segments include NBFC, Housing Finance, Life Insurance, Asset Management, General Insurance Broking, Stock and Securities Broking, Health Insurance, and other financial services like general insurance advisory, asset reconstruction, and private equity. Key subsidiaries include Aditya Birla Finance Ltd, Aditya Birla Housing Finance Ltd, Aditya Birla Money Ltd, and Aditya Birla Insurance Brokers Ltd.
Recent Developments (as of June 24, 2025):
Stock Performance: ABCL's stock reached a 52-week high of Rs. 269.5, gaining 4.75% over three days and trading above its 5-day, 20-day, 50-day, 100-day, and 200-day moving averages. It delivered a 12.64% return over the past year, outperforming the Sensex’s 6.85%. Morgan Stanley revised its price target for ABCL, reflecting a lower cost of equity due to declining government bond yields.
Block Deals: On June 11, 2025, Jomei Investments (linked to Advent International) sold a 1.4% stake (23.4 million shares) for Rs. 856 crore, and multiple institutional investors, including Motilal Oswal MF, Edelweiss MF, and BlackRock, bought a 1.8% stake for Rs. 1,136 crore. Despite expectations of a price correction, ABCL’s shares rose, trading at Rs. 249.90 on June 12.
Investment in Subsidiary: ABCL invested Rs. 249 crore in its wholly-owned subsidiary, Aditya Birla Housing Finance Ltd (ABHFL), to fund growth and improve its leverage ratio, following a Rs. 300 crore infusion via a rights issue.
Financial Performance: For Q4 FY25 (Jan-Mar 2025), ABCL reported a 31% decline in consolidated net profit to Rs. 864.60 crore from Rs. 1,245.41 crore year-on-year, though total income grew to Rs. 12,239 crore from Rs. 10,803 crore. Earlier quarters showed strong growth, with Q3 FY24 PAT up 39% YoY to Rs. 736 crore and Q4 FY24 PAT up 33% YoY to Rs. 812 crore. X posts highlight a Q2 FY25 EBITDA of Rs. 37.17 billion, a significant beat.
Market Position: ABCL’s market capitalization was Rs. 65,230 crore as of June 12, 2025, with a P/E ratio of 19.89. Its stock is near its 52-week high of Rs. 251. X posts note that despite sales growing 6.9x and net profit 4.93x from 2017 to 2025, the stock price remains at Rs. 255, suggesting potential undervaluation.
Analytical Views: A “Cup and Handle” breakout on the weekly chart, suggesting a multi-month uptrend toward Rs. 300-350 levels.

#ABCCAPITAL looking bullish on monthly & weekly timeframe#ABCCAPITAL has given a breakout at 260 on a weekly timeframe. Upside potential: 100%+. Stop loss: 238. A few things to note:
The stock has given a breakout on weekly level. Risk-averse traders can wait for June monthly close above 260
This stock will require immense patience as this could turn a multi-bagger
The volumes have been increasing over the last few months
This is not a buy/sell recommendation. Research carefully and invest at your own risk.
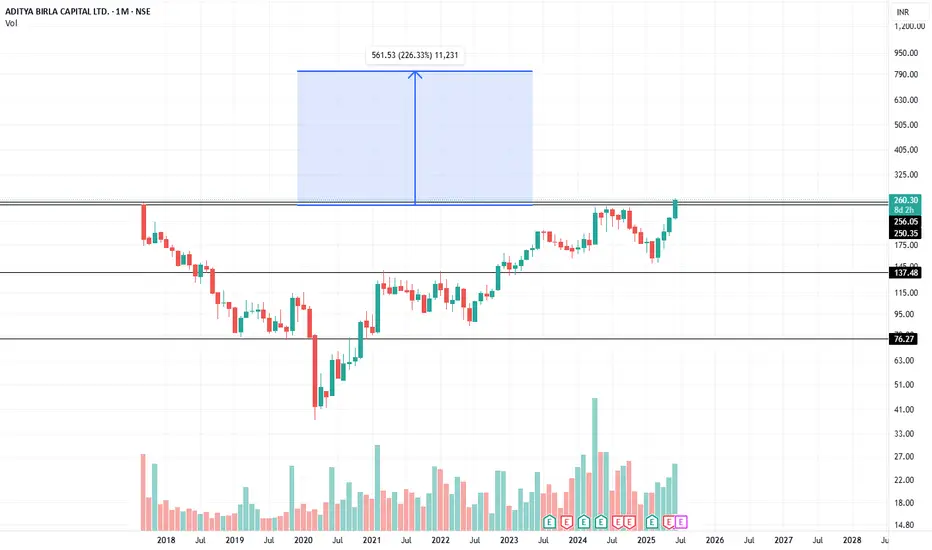
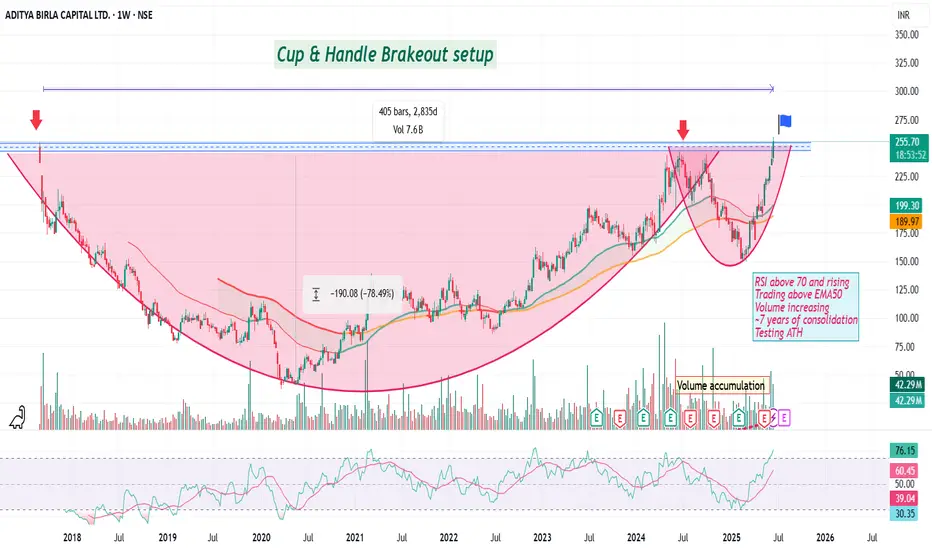
Multi-year breakout in AB CapitalAfter a long ~7 years of consolidation, Aditya Birla Capital is forming a Cup & Handle Breakout setup on Weekly Chart !
RSI > 70 and rising
Trading above EMA50
Volume surge
Testing All-Time High
📈 Price has already reclaimed the critical resistance zone (around ₹255).
Watch for breakout and Enter after confirmation
Disc: not a recommendation, DYOR.
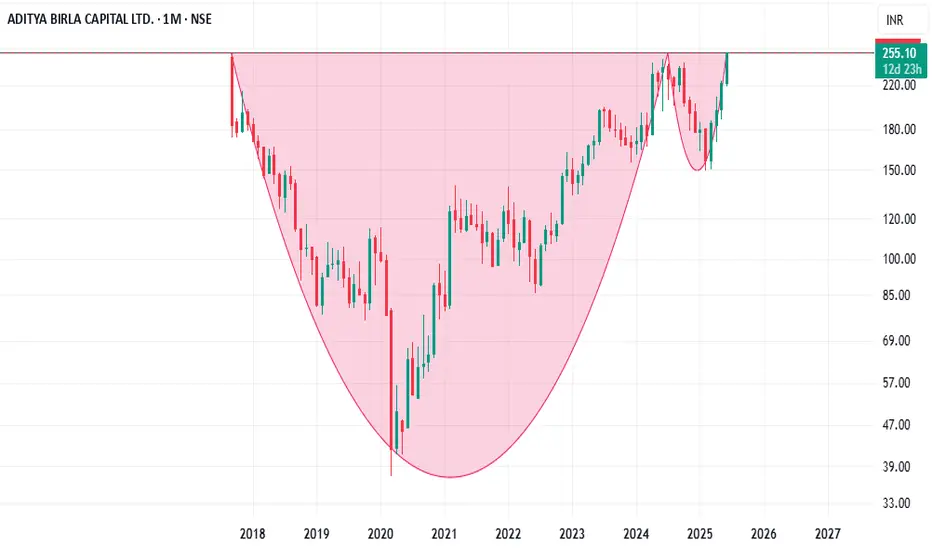
ABCAPITAL_CupNHandle Aditya Birla Capital Ltd. (monthly timeframe) shows a classic Cup and Handle pattern, which is typically considered a bullish continuation pattern.
The price is now testing the resistance zone around ₹255, the rim of the cup. A monthly close above ₹255 with volume would confirm a breakout.
Note : Above view shared for educational purpose only, no any buy or sell recommendations.
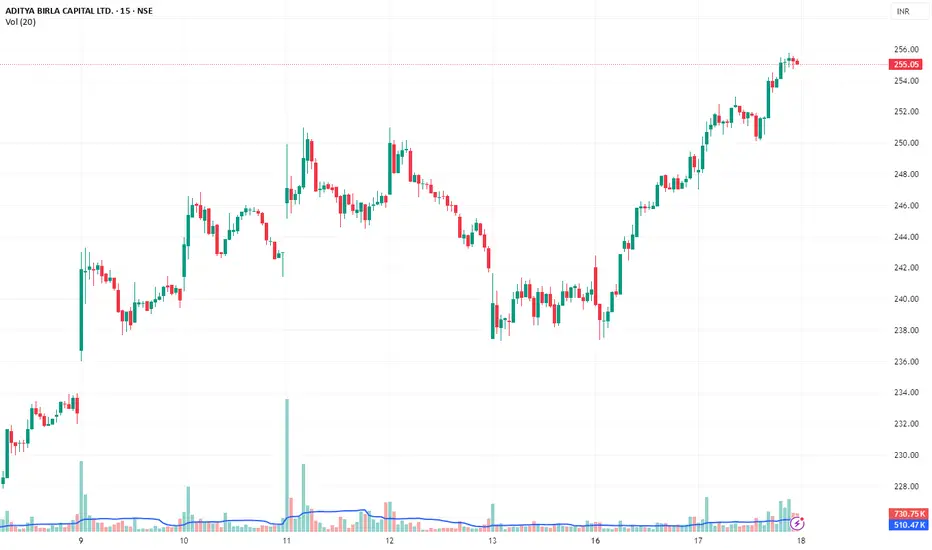
ABCAPITAL – Volume-backed Breakout with Momentum SetupABCAPITAL – Volume-backed Breakout with Momentum Setup | Short-Term Swing
🟢 CMP: ₹255.10
📆 Date: 17 June 2025
📊 Timeframe: 3–5 Days Positional Trade
🔍 Technical Analysis
✅ Strong rally from ₹243 to ₹255 with minimal retracement – signs of accumulation
✅ Sustained higher highs & higher lows forming a bullish structure
✅ Breakout from a minor consolidation seen around ₹250
✅ Price comfortably trading above key short-term EMAs (9 & 21)
✅ Volume spike on recent candles confirms breakout legitimacy
✅ RSI in the 60–65 zone, indicating momentum without overbought signs
🎯 Trade Plan
🔹 Parameter 🔹 Value
Buy Zone ₹252 – ₹256
Stop Loss ₹247.50 (below last swing)
Target 1 ₹262
Target 2 ₹268
Target 3 ₹274
Risk–Reward ~1:2.2
🔥 Conviction Score: 85%
💡 Backed by breakout structure + strong volume + short-term bullish sentiment
🧠 Watch for:
Price sustaining above ₹252 with healthy intraday volume
Caution if closes below ₹248 or market turns risk-off
#ABCAPITAL #BreakoutStock #MomentumTrade #VolumeAnalysis #SwingSetup #StockMarketIndia #NSEIndia #ShortTermTrading
Aditya Birla Capital Ltd – Powering Up for a Breakout Above ₹250📈Technical Analysis
Crucial Resistance Zone: Since 2017 listing at ₹250–255, this level has repeatedly acted as major resistance throughout 2024–25.
Recent Pullback: After reaching ₹248 recently, stock remains locked under this key zone.
Breakout Prerequisite: For a genuine bullish move, the ₹250–255 resistance must be cleared with strong volume and retested successfully as support, confirmed by bullish candlestick patterns.
No Breakout = No Rally: Unless the zone flips to support, further gains are unlikely and a correction may occur.
💰Q4 FY24 Key Financial Highlights (vs Q3 FY24 & Q4 FY23)
Total Income: ₹12,214 Cr (vs ₹9,381 Cr; ₹10,780 Cr)
Total Expenses: ₹8,419 Cr (vs ₹5,876 Cr; ₹7,182 Cr)
Total Operating Profits: ₹3,795 Cr (vs ₹3,505 Cr; ₹3,598 Cr)
Profit Before Tax: ₹1,361 Cr (vs ₹1,030 Cr; ₹1,606 Cr)
Profit After Tax: ₹886 Cr (vs ₹724 Cr; ₹1,288 Cr)
Diluted Normalized EPS: ₹3.32 (vs ₹2.72; ₹4.79)
📌Q4 FY24 delivered healthy sequential growth, though YoY profit dipped — a result of higher expenses and one-off gains in the base quarter.
🔍Fundamental Insights
Revenue Growth: Consolidated income rose ~13–14% YoY to ₹12,214 Cr
Profit Adjusted: FY24 PAT (excluding one-offs) increased ~6% YoY to ₹865–886 Cr .
Lending Portfolio: Combined NBFC + HFC loans grew ~27% YoY to ₹1.57 L Cr
AUM & Premiums Up: Total AUM ₹5.11 L Cr (+17% YoY) and life/health premiums ₹25,579 Cr (+22% YoY)
Distribution Expansion: 1,623+ branches; digital platforms (ABCD, Udyog Plus) gaining traction
Fundraising Plans: Board approved NCD issuance up to ₹1.65 L Cr → expands financial flexibility
📌Conclusion
Aditya Birla Capital shows solid sequential performance, strong loan book and AUM growth, and expanding distribution reach. Technically, everything hinges on the ₹250–255 zone:
✅Breakout & Retest with volume → bullish scenario
⚠️Failure to hold → likely consolidation or pullback
Watching closely!
Disclaimer: lnkd.in
Aditya Birla Capital Ltd – Powering Up for a Breakout Above ₹250📈 Technical Analysis
Crucial Resistance Zone: Since 2017 listing at ₹250–255, this level has repeatedly acted as major resistance throughout 2024–25.
Recent Pullback: After reaching ₹248 recently, stock remains locked under this key zone.
Breakout Prerequisite: For a genuine bullish move, the ₹250–255 resistance must be cleared with strong volume and retested successfully as support, confirmed by bullish candlestick patterns.
No Breakout = No Rally: Unless the zone flips to support, further gains are unlikely and a correction may occur.
💰 Q4 FY24 Key Financial Highlights (vs Q3 FY24 & Q4 FY23)
Total Income: ₹12,214 Cr (vs ₹9,381 Cr; ₹10,780 Cr)
Total Expenses: ₹8,419 Cr (vs ₹5,876 Cr; ₹7,182 Cr)
Total Operating Profits: ₹3,795 Cr (vs ₹3,505 Cr; ₹3,598 Cr)
Profit Before Tax: ₹1,361 Cr (vs ₹1,030 Cr; ₹1,606 Cr)
Profit After Tax: ₹886 Cr (vs ₹724 Cr; ₹1,288 Cr)
Diluted Normalized EPS: ₹3.32 (vs ₹2.72; ₹4.79)
📌Q4 FY24 delivered healthy sequential growth, though YoY profit dipped — a result of higher expenses and one-off gains in the base quarter.
🔍 Fundamental Insights
Revenue Growth: Consolidated income rose ~13–14% YoY to ₹12,214 Cr
Profit Adjusted: FY24 PAT (excluding one-offs) increased ~6% YoY to ₹865–886 Cr .
Lending Portfolio: Combined NBFC + HFC loans grew ~27% YoY to ₹1.57 L Cr
AUM & Premiums Up: Total AUM ₹5.11 L Cr (+17% YoY) and life/health premiums ₹25,579 Cr (+22% YoY)
Distribution Expansion: 1,623+ branches; digital platforms (ABCD, Udyog Plus) gaining traction
Fundraising Plans: Board approved NCD issuance up to ₹1.65 L Cr → expands financial flexibility
📌 Conclusion
Aditya Birla Capital shows solid sequential performance, strong loan book and AUM growth, and expanding distribution reach. Technically, everything hinges on the ₹250–255 zone:
✅Breakout & Retest with volume → bullish scenario
⚠️Failure to hold → likely consolidation or pullback
Watching closely!
⚠️ Disclaimer
This is for informational purposes only and not investment advice. Investors should do their own research or consult a financial advisor before making decisions.
