ABCAPITALADITYA BIRLA CAPITAL PVT LTD, After successful breakout stock is showing pullback. have a look on it. this can reward 25-30 % in few weeks.
Aditya Birla Capital Ltd. Sponsored GDR
No trades
Trade ideas
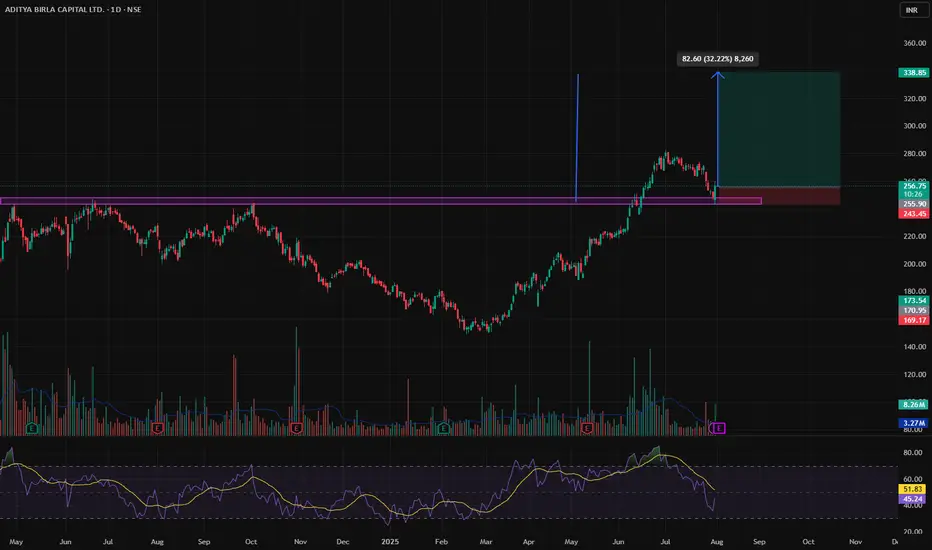
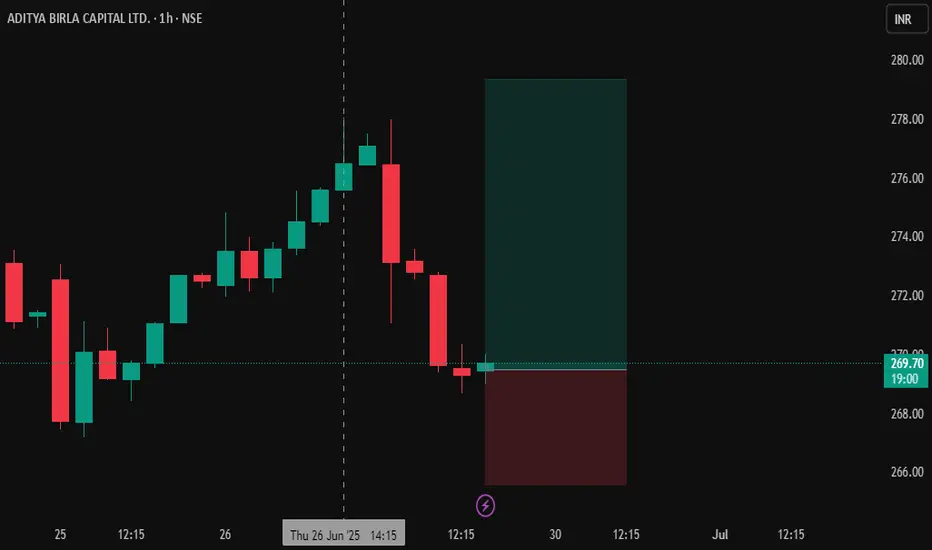
ABC CAPITALchart looks good with sl at closing below 265.65 , chart made high yesterday with rsi going above 70 level and faking breakout
AUBANK back to All Time High.AUBANK is a few points away from the price where it started.
The trading strategy is to wait for the resistance range 250-246.90 for a retest of the all-time high and upper targets of 261.50 to 268 as new highs.
Upon rejection or confirmation of rejection of this resistance level, prices will fall to 231 and 221, respectively, as T1 and T2.

Aditya Birla Capital Ltd (ABCL)Aditya Birla Capital Ltd (ABCL) is an India-based holding company for the financial services businesses of the Aditya Birla Group, operating as a non-deposit-taking non-banking financial company (NBFC). Its segments include NBFC, Housing Finance, Life Insurance, Asset Management, General Insurance Broking, Stock and Securities Broking, Health Insurance, and other financial services like general insurance advisory, asset reconstruction, and private equity. Key subsidiaries include Aditya Birla Finance Ltd, Aditya Birla Housing Finance Ltd, Aditya Birla Money Ltd, and Aditya Birla Insurance Brokers Ltd.
Recent Developments (as of June 24, 2025):
Stock Performance: ABCL's stock reached a 52-week high of Rs. 269.5, gaining 4.75% over three days and trading above its 5-day, 20-day, 50-day, 100-day, and 200-day moving averages. It delivered a 12.64% return over the past year, outperforming the Sensex’s 6.85%. Morgan Stanley revised its price target for ABCL, reflecting a lower cost of equity due to declining government bond yields.
Block Deals: On June 11, 2025, Jomei Investments (linked to Advent International) sold a 1.4% stake (23.4 million shares) for Rs. 856 crore, and multiple institutional investors, including Motilal Oswal MF, Edelweiss MF, and BlackRock, bought a 1.8% stake for Rs. 1,136 crore. Despite expectations of a price correction, ABCL’s shares rose, trading at Rs. 249.90 on June 12.
Investment in Subsidiary: ABCL invested Rs. 249 crore in its wholly-owned subsidiary, Aditya Birla Housing Finance Ltd (ABHFL), to fund growth and improve its leverage ratio, following a Rs. 300 crore infusion via a rights issue.
Financial Performance: For Q4 FY25 (Jan-Mar 2025), ABCL reported a 31% decline in consolidated net profit to Rs. 864.60 crore from Rs. 1,245.41 crore year-on-year, though total income grew to Rs. 12,239 crore from Rs. 10,803 crore. Earlier quarters showed strong growth, with Q3 FY24 PAT up 39% YoY to Rs. 736 crore and Q4 FY24 PAT up 33% YoY to Rs. 812 crore. X posts highlight a Q2 FY25 EBITDA of Rs. 37.17 billion, a significant beat.
Market Position: ABCL’s market capitalization was Rs. 65,230 crore as of June 12, 2025, with a P/E ratio of 19.89. Its stock is near its 52-week high of Rs. 251. X posts note that despite sales growing 6.9x and net profit 4.93x from 2017 to 2025, the stock price remains at Rs. 255, suggesting potential undervaluation.
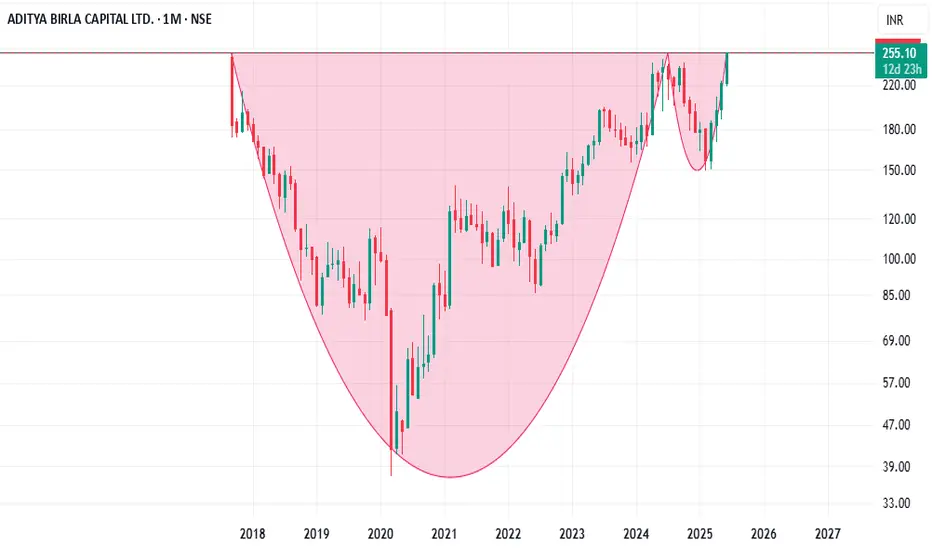
Analytical Views: A “Cup and Handle” breakout on the weekly chart, suggesting a multi-month uptrend toward Rs. 300-350 levels.

#ABCCAPITAL looking bullish on monthly & weekly timeframe#ABCCAPITAL has given a breakout at 260 on a weekly timeframe. Upside potential: 100%+. Stop loss: 238. A few things to note:
The stock has given a breakout on weekly level. Risk-averse traders can wait for June monthly close above 260
This stock will require immense patience as this could turn a multi-bagger
The volumes have been increasing over the last few months
This is not a buy/sell recommendation. Research carefully and invest at your own risk.
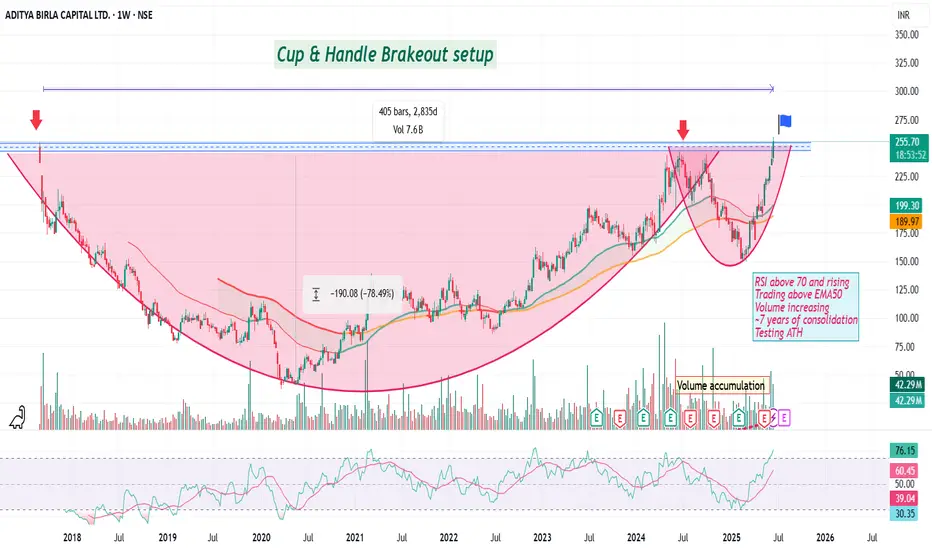
Multi-year breakout in AB CapitalAfter a long ~7 years of consolidation, Aditya Birla Capital is forming a Cup & Handle Breakout setup on Weekly Chart !
RSI > 70 and rising
Trading above EMA50
Volume surge
Testing All-Time High
📈 Price has already reclaimed the critical resistance zone (around ₹255).
Watch for breakout and Enter after confirmation
Disc: not a recommendation, DYOR.
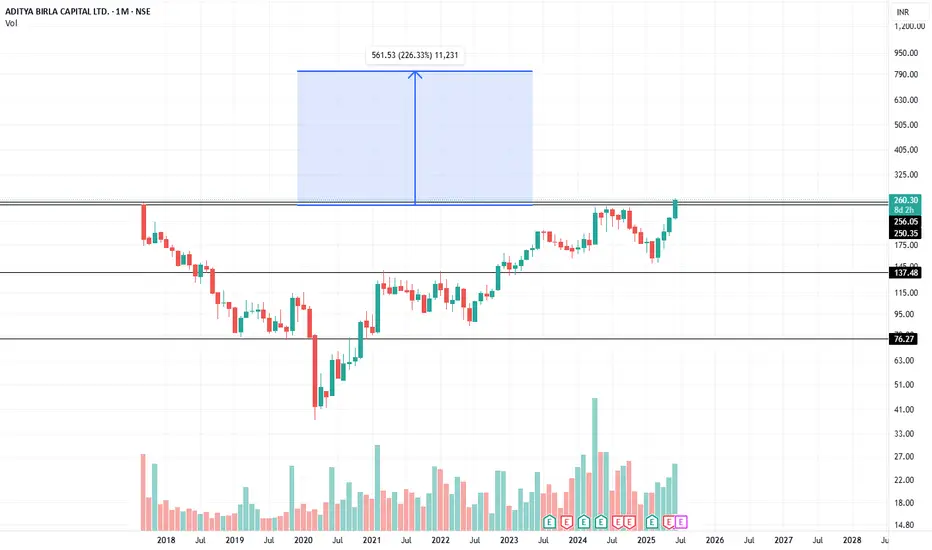
ABCAPITAL_CupNHandle Aditya Birla Capital Ltd. (monthly timeframe) shows a classic Cup and Handle pattern, which is typically considered a bullish continuation pattern.
The price is now testing the resistance zone around ₹255, the rim of the cup. A monthly close above ₹255 with volume would confirm a breakout.
Note : Above view shared for educational purpose only, no any buy or sell recommendations.
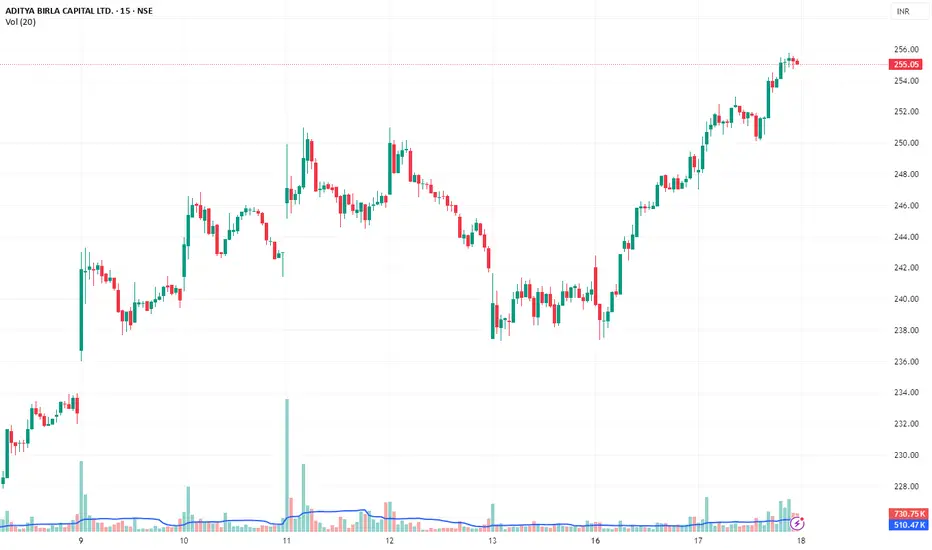
ABCAPITAL – Volume-backed Breakout with Momentum SetupABCAPITAL – Volume-backed Breakout with Momentum Setup | Short-Term Swing
🟢 CMP: ₹255.10
📆 Date: 17 June 2025
📊 Timeframe: 3–5 Days Positional Trade
🔍 Technical Analysis
✅ Strong rally from ₹243 to ₹255 with minimal retracement – signs of accumulation
✅ Sustained higher highs & higher lows forming a bullish structure
✅ Breakout from a minor consolidation seen around ₹250
✅ Price comfortably trading above key short-term EMAs (9 & 21)
✅ Volume spike on recent candles confirms breakout legitimacy
✅ RSI in the 60–65 zone, indicating momentum without overbought signs
🎯 Trade Plan
🔹 Parameter 🔹 Value
Buy Zone ₹252 – ₹256
Stop Loss ₹247.50 (below last swing)
Target 1 ₹262
Target 2 ₹268
Target 3 ₹274
Risk–Reward ~1:2.2
🔥 Conviction Score: 85%
💡 Backed by breakout structure + strong volume + short-term bullish sentiment
🧠 Watch for:
Price sustaining above ₹252 with healthy intraday volume
Caution if closes below ₹248 or market turns risk-off
#ABCAPITAL #BreakoutStock #MomentumTrade #VolumeAnalysis #SwingSetup #StockMarketIndia #NSEIndia #ShortTermTrading
Aditya Birla Capital Ltd – Powering Up for a Breakout Above ₹250📈Technical Analysis
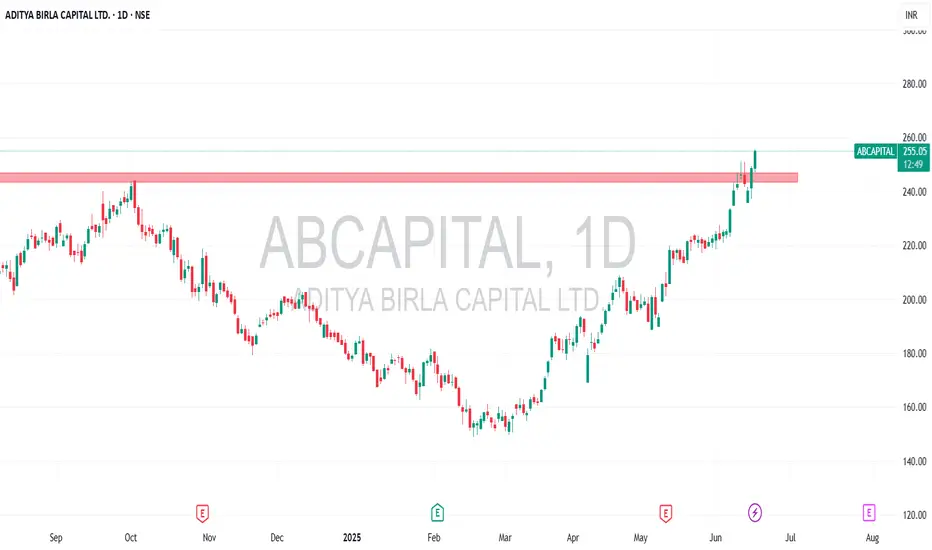
Crucial Resistance Zone: Since 2017 listing at ₹250–255, this level has repeatedly acted as major resistance throughout 2024–25.
Recent Pullback: After reaching ₹248 recently, stock remains locked under this key zone.
Breakout Prerequisite: For a genuine bullish move, the ₹250–255 resistance must be cleared with strong volume and retested successfully as support, confirmed by bullish candlestick patterns.
No Breakout = No Rally: Unless the zone flips to support, further gains are unlikely and a correction may occur.
💰Q4 FY24 Key Financial Highlights (vs Q3 FY24 & Q4 FY23)
Total Income: ₹12,214 Cr (vs ₹9,381 Cr; ₹10,780 Cr)
Total Expenses: ₹8,419 Cr (vs ₹5,876 Cr; ₹7,182 Cr)
Total Operating Profits: ₹3,795 Cr (vs ₹3,505 Cr; ₹3,598 Cr)
Profit Before Tax: ₹1,361 Cr (vs ₹1,030 Cr; ₹1,606 Cr)
Profit After Tax: ₹886 Cr (vs ₹724 Cr; ₹1,288 Cr)
Diluted Normalized EPS: ₹3.32 (vs ₹2.72; ₹4.79)
📌Q4 FY24 delivered healthy sequential growth, though YoY profit dipped — a result of higher expenses and one-off gains in the base quarter.
🔍Fundamental Insights
Revenue Growth: Consolidated income rose ~13–14% YoY to ₹12,214 Cr
Profit Adjusted: FY24 PAT (excluding one-offs) increased ~6% YoY to ₹865–886 Cr .
Lending Portfolio: Combined NBFC + HFC loans grew ~27% YoY to ₹1.57 L Cr
AUM & Premiums Up: Total AUM ₹5.11 L Cr (+17% YoY) and life/health premiums ₹25,579 Cr (+22% YoY)
Distribution Expansion: 1,623+ branches; digital platforms (ABCD, Udyog Plus) gaining traction
Fundraising Plans: Board approved NCD issuance up to ₹1.65 L Cr → expands financial flexibility
📌Conclusion
Aditya Birla Capital shows solid sequential performance, strong loan book and AUM growth, and expanding distribution reach. Technically, everything hinges on the ₹250–255 zone:
✅Breakout & Retest with volume → bullish scenario
⚠️Failure to hold → likely consolidation or pullback
Watching closely!
Disclaimer: lnkd.in
Aditya Birla Capital Ltd – Powering Up for a Breakout Above ₹250📈 Technical Analysis
Crucial Resistance Zone: Since 2017 listing at ₹250–255, this level has repeatedly acted as major resistance throughout 2024–25.
Recent Pullback: After reaching ₹248 recently, stock remains locked under this key zone.
Breakout Prerequisite: For a genuine bullish move, the ₹250–255 resistance must be cleared with strong volume and retested successfully as support, confirmed by bullish candlestick patterns.
No Breakout = No Rally: Unless the zone flips to support, further gains are unlikely and a correction may occur.
💰 Q4 FY24 Key Financial Highlights (vs Q3 FY24 & Q4 FY23)
Total Income: ₹12,214 Cr (vs ₹9,381 Cr; ₹10,780 Cr)
Total Expenses: ₹8,419 Cr (vs ₹5,876 Cr; ₹7,182 Cr)
Total Operating Profits: ₹3,795 Cr (vs ₹3,505 Cr; ₹3,598 Cr)
Profit Before Tax: ₹1,361 Cr (vs ₹1,030 Cr; ₹1,606 Cr)
Profit After Tax: ₹886 Cr (vs ₹724 Cr; ₹1,288 Cr)
Diluted Normalized EPS: ₹3.32 (vs ₹2.72; ₹4.79)
📌Q4 FY24 delivered healthy sequential growth, though YoY profit dipped — a result of higher expenses and one-off gains in the base quarter.
🔍 Fundamental Insights
Revenue Growth: Consolidated income rose ~13–14% YoY to ₹12,214 Cr
Profit Adjusted: FY24 PAT (excluding one-offs) increased ~6% YoY to ₹865–886 Cr .
Lending Portfolio: Combined NBFC + HFC loans grew ~27% YoY to ₹1.57 L Cr
AUM & Premiums Up: Total AUM ₹5.11 L Cr (+17% YoY) and life/health premiums ₹25,579 Cr (+22% YoY)
Distribution Expansion: 1,623+ branches; digital platforms (ABCD, Udyog Plus) gaining traction
Fundraising Plans: Board approved NCD issuance up to ₹1.65 L Cr → expands financial flexibility
📌 Conclusion
Aditya Birla Capital shows solid sequential performance, strong loan book and AUM growth, and expanding distribution reach. Technically, everything hinges on the ₹250–255 zone:
✅Breakout & Retest with volume → bullish scenario
⚠️Failure to hold → likely consolidation or pullback
Watching closely!
⚠️ Disclaimer
This is for informational purposes only and not investment advice. Investors should do their own research or consult a financial advisor before making decisions.

Aditya Birla CapitalDate 09.06.2025
AB Capital
Timeframe : Day Chart
Remarks:
1 Reached previous triple top zone
2 RSI reaching overbought zone
3 Pivot R3 at 247
4 Gap candle + open = high = 235
5 Below 235 is weak
Regards,
Ankur

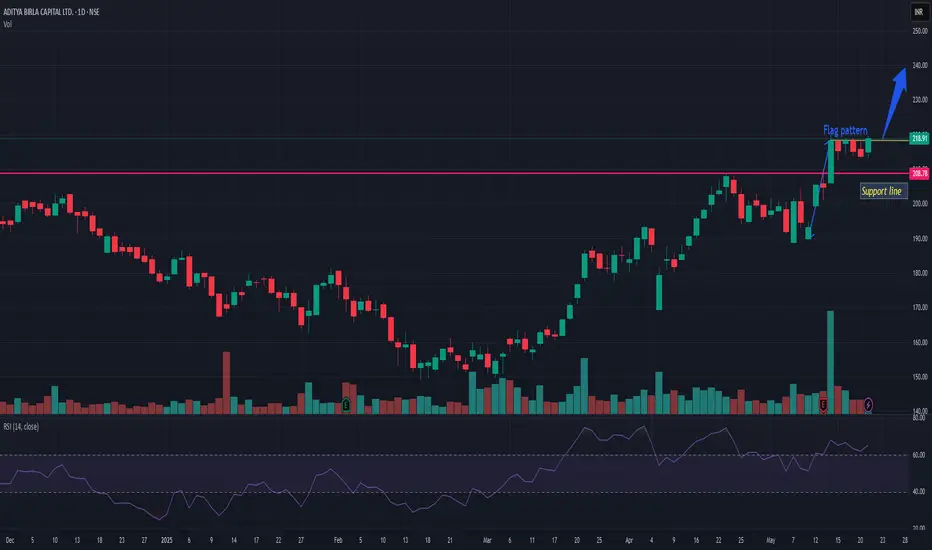
ABCAPITALABCAPITAL is getting stronger and giving short term flag pattern breakout. Only thing which is lacking is enough market participation. If it gets market participation than average then it can do wonders in short term. I would keep a closer look if it sustain above 220.
Ab capital Head and shoulder pattern break out
Also previous order block , if yesterday break that with strong candle maybe
It should move upside
7% risk
Just Today candle look interesting that why post

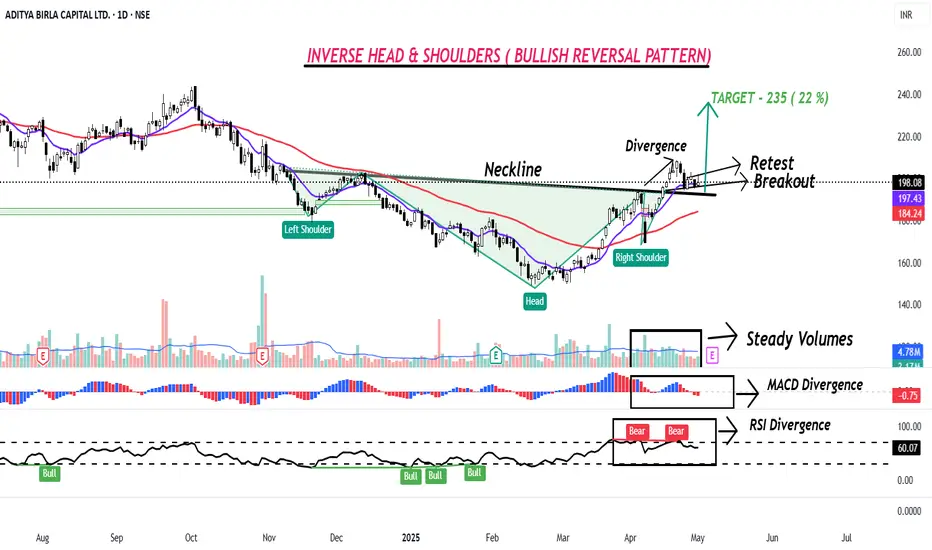
ADITYA BIRLA CAPITAL - Bullish Head & Shoulder Pattern formationAditya Birla Capital ( ABCAPITAL) has formed an Inverse Head & Shoulder Pattern on the Daily charts.
The inverse head and shoulders pattern is a bullish reversal pattern in technical analysis, indicating a potential shift from a downtrend to an uptrend. It's characterized by three consecutive troughs, with the middle trough (the "head") being the lowest, and the other two troughs (the "shoulders") forming higher lows. The neckline is a trendline connecting the highs of the shoulders and the head.
ABCAPITAL broke the neckline of Inverse Head & Shoulder Pattern, after breaking the neckline, bearish divergences were made on MACD AND RSI indicator and the stock fell and took support near the trendline and is probably back on its upward journey.
Divergences - RSI divergence occurs when the price of an asset moves in one direction, while the Relative Strength Index (RSI) moves in the opposite direction, suggesting a potential trend reversal or weakening momentum. Essentially, it's when the price and the RSI are not in sync, hinting at a potential change in the market's direction.
Indicators - On the Daily timeframe,the stock is trading above its 11 day EMA and 22 day EMA,and RSI is at 60 suggesting positive bias.
CMP - Rs. 198.
Target - Rs. 235
SL - Rs. 190
Disclaimer: This is not a Buy/Sell recommendation. For educational purpose only. Kindly consult your financial advisor before entering a trade.
ADITYA BIRLA CAPITAL LTD Company Name: Aditya Birla Capital Ltd (NSE: ABCAPITAL)
Sector: Financial Services
Market Cap: Large Cap | ~₹53,000 Cr
Headquarters: Mumbai, India
Parent Group: Aditya Birla Group
🧾 Business Overview:
Aditya Birla Capital is a diversified financial services player offering a wide range of solutions across:
Lending: Personal, SME, and housing loans through Aditya Birla Finance
Asset Management: One of India's top AMC players via joint venture with Sun Life
Insurance: Life and health insurance products
Wealth & Broking: Wealth management, equity broking, and portfolio management services
💼 Key Strengths:
Strong backing of Aditya Birla Group
Wide distribution network across India
Growing AUM and diversified revenue streams
Focus on digital and retail loan expansion
📊 Stock Insight:
NSE Symbol: ABCAPITAL
52-Week Range: ₹153 – ₹225
Trend: Medium-term bullish with support near ₹209
Support and Resistance Levels (Intraday – 15M):
Immediate Resistance: ₹215.50
(Price tested this level twice, indicating strong short-term selling pressure.)
Next Resistance: ₹218.20
(Gap-fill zone; breakout above this may trigger momentum buying.)
Immediate Support: ₹211.70
(Recent bounce zone and short-term base.)
Strong Support: ₹209.50
(Multiple rejections below this level; buyers likely to defend.)
Trend Insight:
Price is consolidating in a narrow range between ₹211.70 and ₹215.50. A breakout above or below this band may set the next directional move.
Amazing breakout on WEEKLY Timeframe - ABCAPITALCheckout an amazing breakout happened in the stock in Weekly timeframe, macroscopically seen in Daily timeframe. Having a great favor that the stock might be bullish expecting a staggering returns of minimum 25% TGT. IMPORTANT BREAKOUT LEVELS ARE ALWAYS RESPECTED!
NOTE for learners: Place the breakout levels as per the chart shared and track it yourself to get amazed!!
#No complicated chart patterns
#No big big indicators
#No Excel sheet or number magics
TRADE IDEA: WAIT FOR THE STOCK TO BREAKOUT IN WEEKLY TIMEFRAME ABOVE THIS LEVEL.
Checkout an amazing breakout happened in the stock in Weekly timeframe.
Breakouts happening in longer timeframe is way more powerful than the breakouts seen in Daily timeframe. You can blindly invest once the weekly candle closes above the breakout line and stay invested forever. Also these stocks breakouts are lifelong predictions, it means technically these breakouts happen giving more returns in the longer runs. Hence, even when the scrip makes a loss of 10% / 20% / 30% / 50%, the stock will regain and turn around. Once they again enter the same breakout level, they will flyyyyyyyyyyyy like a ROCKET if held in the portfolio in the longer run.
Time makes money, GREEDY & EGO will not make money.
Also, magically these breakouts tend to prove that the companies turn around and fundamentally becoming strong. Also the magic happens when more diversification is done in various sectors under various scripts with equal money invested in each N500 scripts.
The real deal is when to purchase and where to purchase the stock. That is where Breakout study comes into play.
LET'S PUMP IN SOME MONEY AND REVOLUTIONIZE THE NATION'S ECONOMY!
A B CAPITAL : Unfolding one more opportunityStock trying hard to consolidate and go up
But as we can see there lies an opportunity on the upside with Drop - Base - Drop range (168 - 172)
If stock reaches and pauses in the above mentioned area, It may be possibly give an sell opportunity in Lower Time Frame
Keep an eye
Sl will be above 175
Targets on the downside can be expected up to 150
Advance alerts and preparation gives sufficient time to prepare entry with peace of mind

Aditya Birla Capital LtdDate 11.03.2025
Aditya Birla Capital
Timeframe : Weekly
Technical Remarks :
1 Currently at ending phase of wave 4
2 If crosses above 61% of internal Wave C & 38% of Wave 4 which is 165, then strong upside
3 Right now at no trading zone, wait for it to cross above mentioned zones at point number 2
4 Once exceeds 165, target would be 200 or 200 + & keep swing low of 150 as initial stoploss & trail stoploss therefore
About Company
1 Company has delivered good profit growth of 32.7% CAGR over last 5 years
2 Trading at 1.4 times of book value which reasonable amid heated valuations across
3 Stock pe ratio at 11.13
Business Segments
1 Life Insurance 44%
2 NBFC 33%
3 Health Insurance 10%
4 Housing Finance 6%
5 Asset Management 4%
6 Other Businesses 3%
Operational Metrics: All Data of 9M FY25
Life Insurance
AUM (Rs. Cr): 97,286
Solvency Ratio: 194%
NBFC
AUM (Rs. Cr): 1,19,437
CRAR: 16.77%
Average Yield: 13.17%
NIM: 6.27%
GNP : 2.27%
AUM Mix:
Business Loans: 55%
Corporate & Mid-Market: 32%
Personal & Consumer Loans: 13%
Health Insurance 10%
Housing Finance
AUM (Rs. Cr): 26,714
Customers: 82,300
GNPA: 1%
PCR: 40.4%
Asset Management
Mutual Fund Closing AUM (Rs. Cr): 3,66,044
Individual MAAUM (Rs. Cr): 1,97,331
Regards,
Ankur

ABCPITAL 1HRINTRADAY TRADE
- EARN WITH ME DAILY 10K-20K –
ABCPITAL Looking good for Downside..
When it break level 168.47 and sustain.. it will go Downside...
SELL @ 168.47
Target
1st 165.62
2nd 163.81
FNO
ABCPITAL JAN FUT – LOT 9 (Qty-24300)
ABCPITAL JAN 1800 PE – LOT 9(Qty-24300)
Enjoy trading traders.. Keep add this STOCK in your watch list..
Big Investor are welcome..
Like this Post??? Hit like button..!!!
Follow me for FREE Educational Post and Alert.

13th jan ab capital for intradayab capital has shown highest prevolume in 7 days in intraday
stock is also moving in downward funnel channel trying to breakout
today index is down but this counter will perform
i am hoping OI data to reduce substantiall for good shortcovering
so buy ab capital in zone 168-172
with stop loss at 163
target will be 177 -180-184 intraday
forget the index focus on data, and data is highly positive here

ABCAPITALStock is in very near range to 52 Week Low as well as 0.5 Bat Pattern.
Expect a reversal around 165.45

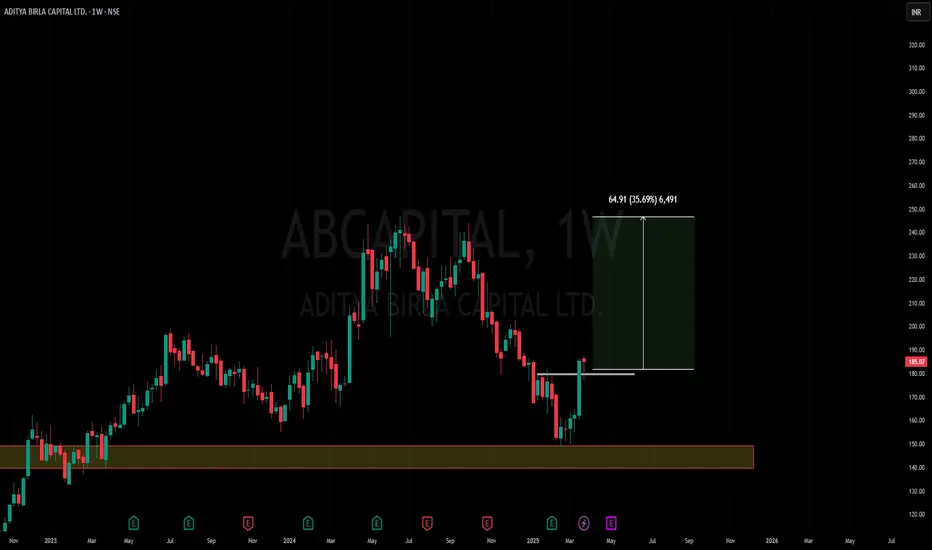
C&H BO in ABCAPITALC&H BO monthly chart with favourable RR.
As per the pattern target and SL mentioned on the chart.
Disc: DYOA before initiating any position.

