
Nasdaq buy at 21230 add more at 21070 sl 20920 Target 21730-780How to take trades using Harmonic pattern projection Trade setup is explained below :-
Entry : 1st D point : 0% is recent top or bottom.
Trailing SL: 11.4% is work as trailing SL of buy or sell trade if hit then we have to book profit
.If price goes below 21.4% then early traders can make fresh

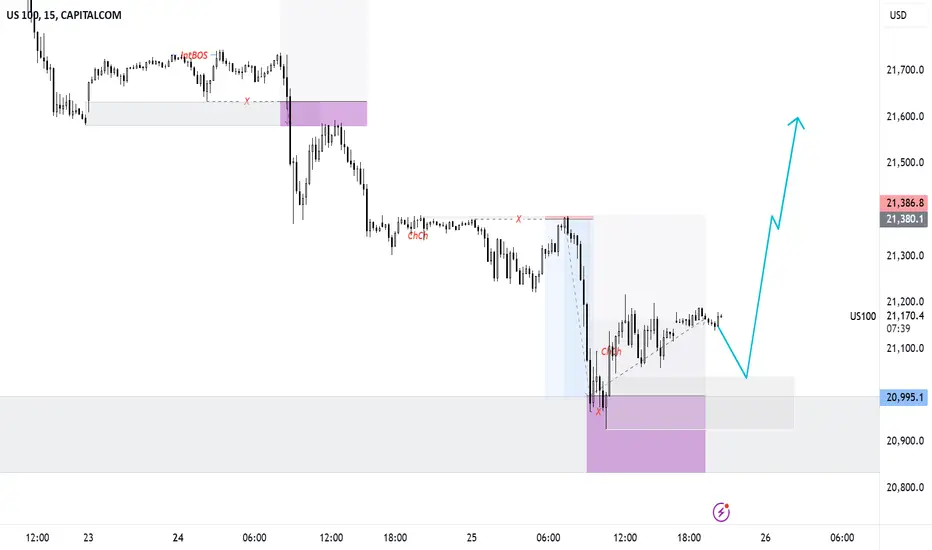
US100 View for feb last weekUS100 is reversing from the demand zone and waiting for the confirmation to enter buy side.
Here is the view for educational purposes
Buy zone is marked between 20926.5 - 21040.8. It will be the high probability area. So, wait for the confirmation before entry.
Trade with 1:3 RR and it might touc
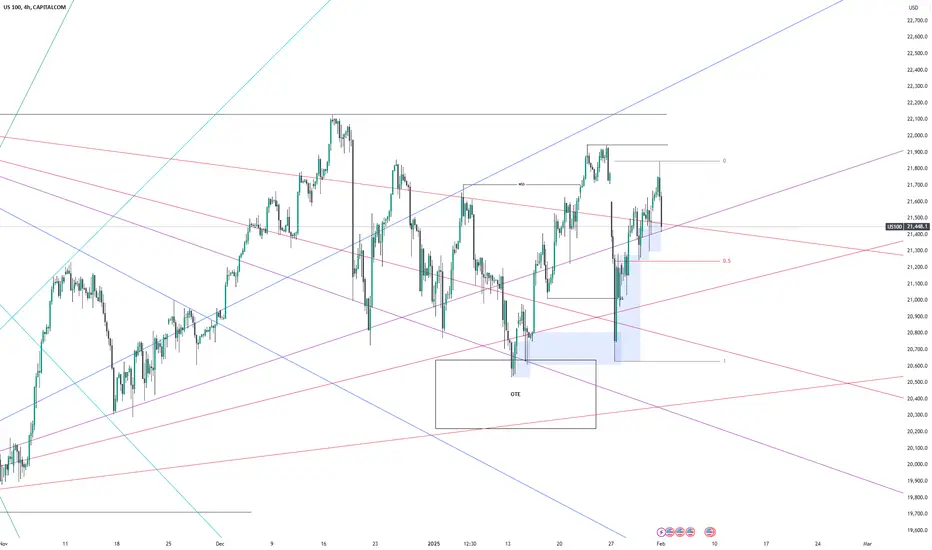
US100 Today's Market Overview US 100
Market reached the OTE Zone on January 13th, and has shown good Bullishness.
Later it moved into the discount by February 1st Week and a clear SMT.
Now expecting the market to move into the Inception Zone inside the Breaker and then a Buy towards 20 Day Liquidity, PMH.
The Dates where al

sell US100Trend: Uptrend. The final buyers push the price up when it touches the trendline but haven't taken profit yet.
On the H1 timeframe, a bearish signal appears → Sell one order first.
Wait for the candle to close for confirmation, then place one more sell order.

US100 Market Overview US 100 MARKET OVERVIEW
Price entered the Discount Array, specifically into the OTE level - 0.62 on January 13th.
After that we can see significant Bullishness
Talking abouth the IPDA Dealing Ranges, in the first 20 Days from January 1, market has swept liquidity of the previous 20 days thus mov
NASDAQ 100 all Set to Crash to 18300!Nasdaq 100 CFD Daily Chart Live 27th Jan 2025
#NDQ #NDQ100 TVC:NDQ
SHORT SIGNAL TRIGGERED🐻🚨 on the back of a BIG TECHNOLOGICAL DEVELOPMENT from China's DeepSeek AI putting all of American AI to Shame, being vastly Superior and Cost Efficient, this leads to Popping of the AI Bubble in US Market
P

Nasdaq Target 25 K Soon Good News For American Markets The Nasdaq Composite Index is a market capitalization-weighted index that encompasses nearly all common equities listed on the Nasdaq Stock Market, making it one of the most comprehensive indicators of the U.S. stock market's performance. ( (indexes.nasdaqomx.com))
**Composition and Weighting**
As

Short term correction We can expect short term correction
Identify the weak stock and over valued stock for short selling

NASDAQ 100 at a Crossroads : possible 25 5 correction aheadNASDAQ 100 at a Crossroads: Technical Reversal and Macroeconomic Storms Signal a 25% (from top) Correction Ahead
Technical Indicators:
Relative Strength Index (RSI):
The RSI on the monthly timeframe is approaching overbought territory (~70). A reversal from this level would provide further co

See all ideas
Displays a symbol's price movements over previous years to identify recurring trends.