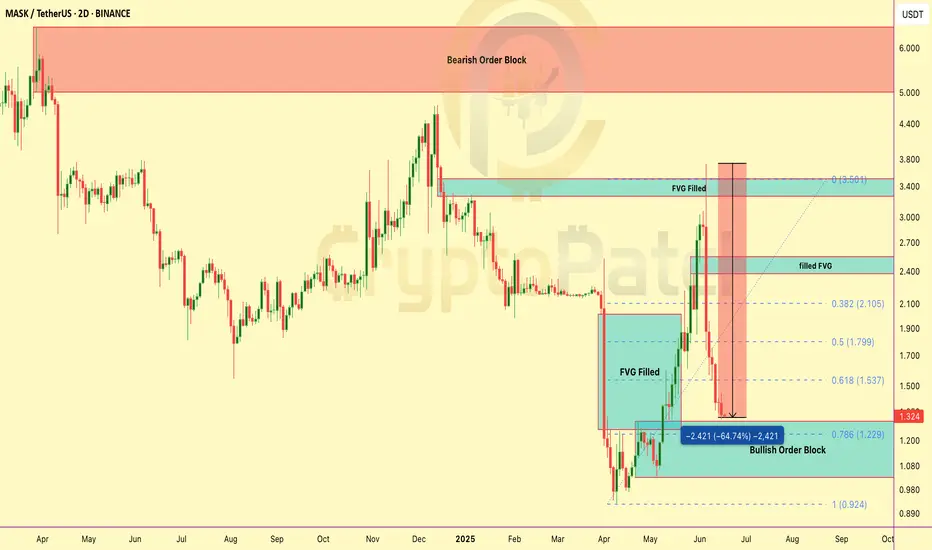
$MASK dropped 65% in 12 days — but I’m still buying, here’s why?NASDAQ:MASK Crashed 65% — I Sold at the Top, Buying at the Bottom, and Aiming for 10x
The NASDAQ:MASK token has crashed -65% in just 12 days — that’s a massive drop, and honestly, no one saw it coming. Even I didn’t expect this much of a dump.
But remember — no one can predict the market 100%.
Founder’s Wallet HACKED → $4M Gone → $MASK Crashes! Full Story IFounder’s Wallet HACKED → $4M Gone → NASDAQ:MASK Crashes! Full Story Inside
Dropped -51% in few hours! 😱
*Here’s the FULL story you need to know:*
🟥 Founder’s Wallet HACKED → $4M stolen!
🟥 Big WHALE dumped $2.1M worth of MASK on Binance!
🟥 Binance DELISTING rumors caused PANIC SELLING!
Result?

MASK 3.7x PUMP — Is a BIG DIP Coming?MASK 3.7x PUMP — Is a BIG DIP Coming?
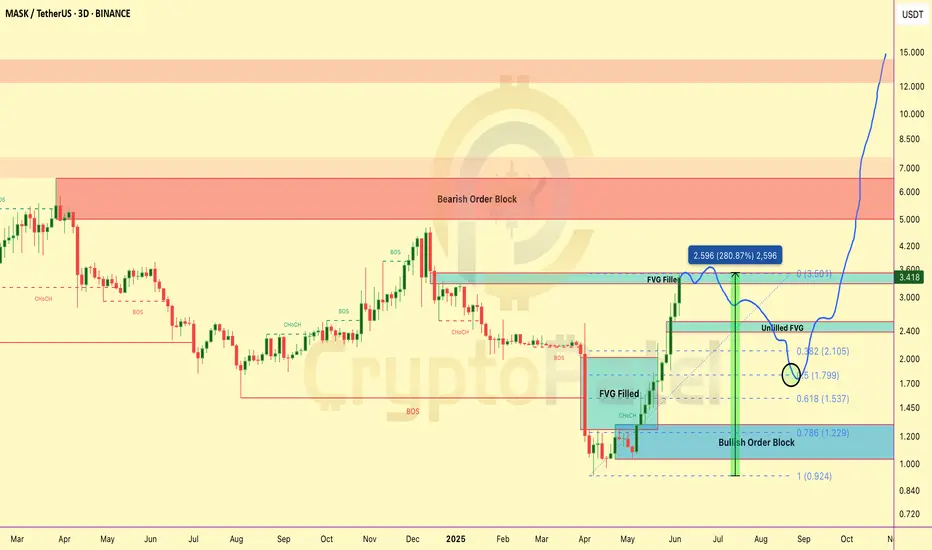
MASK just delivered a MASSIVE rally from the Bullish Order Block at $1.2–$1.3 — and filled the FVG around $3.5.
Here’s what’s next 👇
🟢 Short-Term Outlook:
👉 After pumping from $0.927 → $3.50 → that’s a 3.7x move WITHOUT any major retracement.
👉 High chances of
Mask Looks BearishHey Guys,
Mask is facing resistance, So don't take long here, Go for short..!!
See chart for more understanding...!!
Disclaimer: I am not financial Advisor; this is my opinion I am some guy on the Internet...!! Crypto market is highly volatile, do your own research and jump into the trade.

$MASK long setup to 7$- Lil Late to enter nowLonged MASK from the entry at 5.005 expecting the run till 7.2$ , it wont hit the stop loss, as i took the sharp entry, max SL would be around %4.97

$MASK LongSEED_DONKEYDAN_MARKET_CAP:MASK Network will start moving upward soon. #Altseason has not yet begun.
- Exciting developments in Web3 innovation.
- Social media platforms enabling cryptocurrency transactions.
- Rise of decentralized finance, decentralized storage.


MASKUSDT at the Bottom of a Triangle Pattern.💎 MaskUSDT is currently forming a triangle pattern, with the price consolidating near the pattern's lower boundary. The positioning of MaskUSDT at the bottom of the triangle pattern suggests a potential bullish breakout in the near future.Watch for a decisive breakout above the upper boundary of the

MASK-USDT :- intriguing scenario?The MASK-USDT chart reveals an intriguing scenario.
Currently, the token has broken a strong prevailing trendline and therefore attracting buying pressure/sentiments. However, it's crucial to note that sellers are also consolidating their positions, indicating a potential downside. Traders should

MASKUSDT is in uptrendwith a clear bullish divergence on rsi , the pair is looking to continue uptren
after breaking the previous high we can take entry , for safe side wait for closing a candle
above the trendline

See all ideas
Summarizing what the indicators are suggesting.
Oscillators
Neutral
SellBuy
Strong sellStrong buy
Strong sellSellNeutralBuyStrong buy
Oscillators
Neutral
SellBuy
Strong sellStrong buy
Strong sellSellNeutralBuyStrong buy
Summary
Neutral
SellBuy
Strong sellStrong buy
Strong sellSellNeutralBuyStrong buy
Summary
Neutral
SellBuy
Strong sellStrong buy
Strong sellSellNeutralBuyStrong buy
Summary
Neutral
SellBuy
Strong sellStrong buy
Strong sellSellNeutralBuyStrong buy
Moving Averages
Neutral
SellBuy
Strong sellStrong buy
Strong sellSellNeutralBuyStrong buy
Moving Averages
Neutral
SellBuy
Strong sellStrong buy
Strong sellSellNeutralBuyStrong buy
Displays a symbol's price movements over previous years to identify recurring trends.