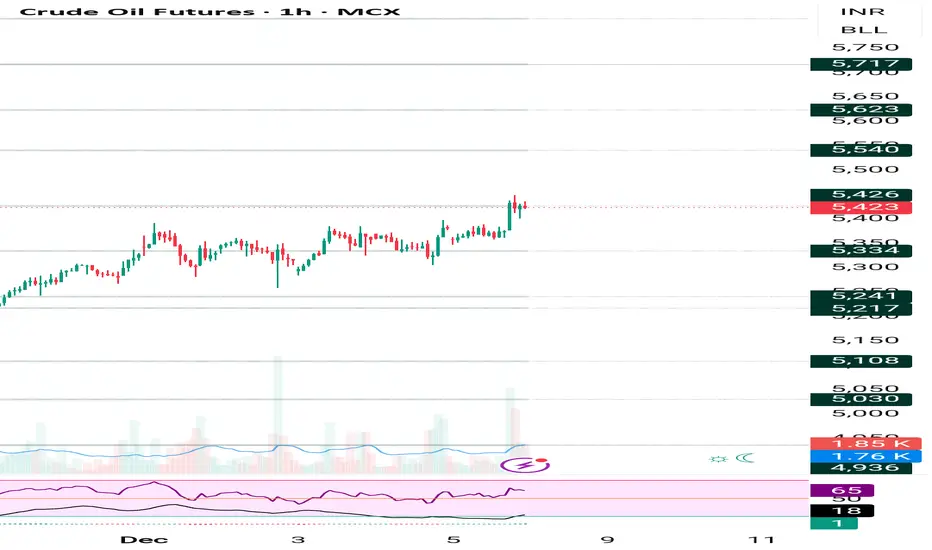
Crude oil mcx still in range buy on dip 5150 amd sell 5420-5450Parameter Data Data
Asset Name Crude Oil MCX Futures (Dec 2025)
Last Traded Price (LTP) 🟢 ₹5,423.00/BBL (Reference: Dec 8, 2025)
Price Movement 🟢 Positive (Approx. +0.74% from previous close)
Current Trade 🟢 Expansion Phase (Bullish Breakout) Active
SMC Structure 🟢 Short-term Bullish (Decisive Break
Oil Futures
No trades
Related commodities

Part 1 Supprot and Resistance What Are Options?
Options are derivative contracts that give the trader a right, but not an obligation, to buy or sell an underlying asset at a pre-defined price (called the strike price) before or on a specific date (called the expiry).
There are two main types of options:
Call Option – gives th

Crudeoil mcx AI tool data Analysis provided on description use Parameter Data
Asset Name Crude Oil MCX Futures (Dec 2025): ₹5,428/BBL (LTP: Dec 5, 2025 Close)
Price Movement Bullish momentum targeting and . Downside possible if is breached, targeting and .
Current Trade 🟨 Cautious BUY / T1: ₹5,480, T2: ₹5,550, T3: ₹5,620 / SL: ₹5,349
Risk Reward (R:R)
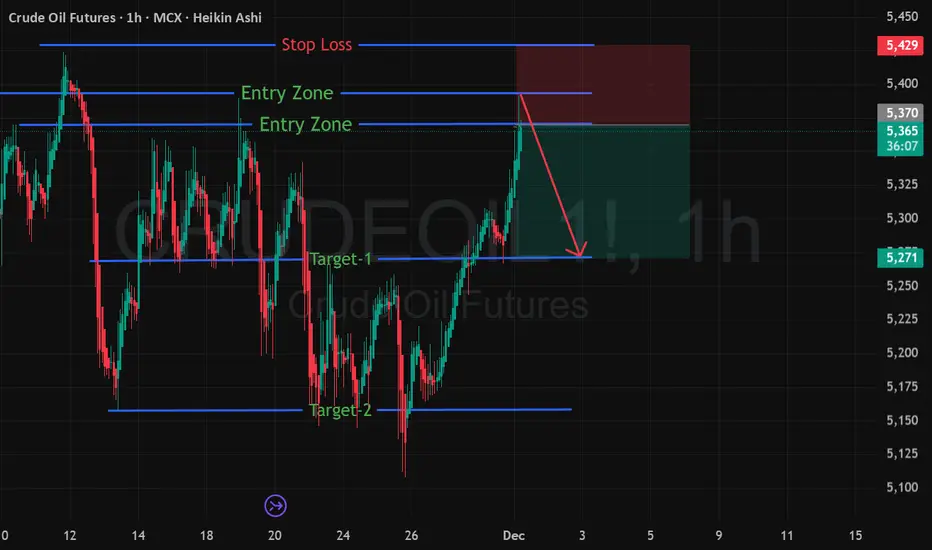
MCX CRUDE OIL (DEC-25) — Bullish Trend Setup IdentifiedA fresh Bullish Trend Entry Zone has been detected on MCX Crude Oil DEC-25, indicating a potential upside continuation from the demand zone.
📈 Trade Setup
🟢 Entry Range: 5370 – 5390
🔴 Stop Loss: 5430
🎯 Target 1: 5270
🎯 Target 2: 5170
📊 Chart Explanation
Crude Oil has recently shown strong acc
Crude Oil at Key Decision Zone”Crude Oil (MCX) currently testing a major decision zone.
Price has reached a confluence of:
Higher-timeframe falling trendline
1H supply zone
Previous structure resistance
Is zone se market do clear structure moves bana sakta hai:
✔ Bullish Scenario
Price cleanly breaks above the supply zone

Crude Oil Resistance Breakout – Retest & Buy OpportunityCrude Oil has broken above a key resistance zone, which had previously acted as a strong supply area multiple times. After the breakout, the price is now approaching the same zone for a potential retest.
If the retest holds as support and bullish candles appear, it can confirm buyer strength and pr

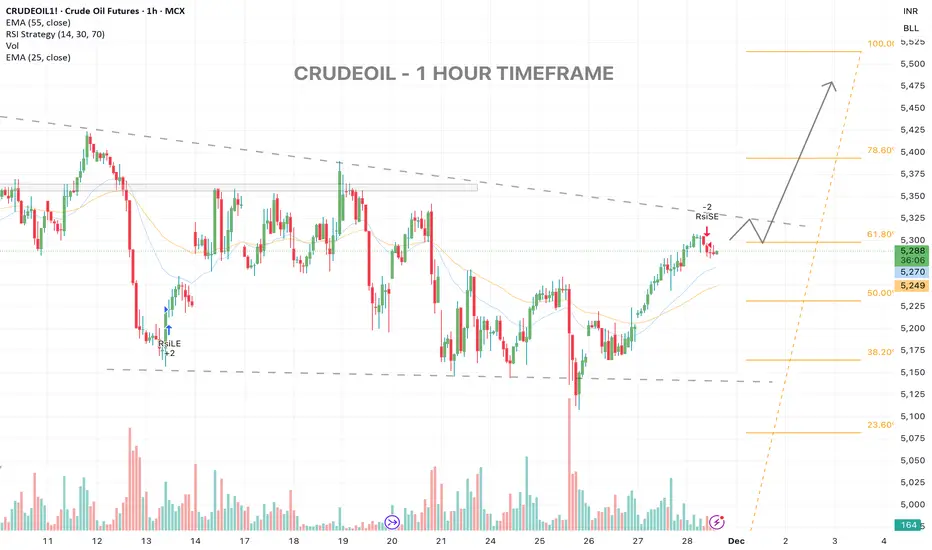
SOON BREAKOUT IN CRUDEOIL ?CRUDEOIL - 1 HOUR TIMEFRAME
Price is retesting the 61.8% zone right under the descending trendline.
A shallow pullback toward 5260–5275 can fuel the next leg toward 5335 / 5385 / 5450.
Overall, structure favors a continuation leg higher once the pullback stabilizes, remains bullish as long as 52
Event-Based Trading: A Comprehensive OverviewTypes of Events in Event-Based Trading
Event-based trading revolves around various types of events that can materially impact the value of securities. These events are generally categorized into corporate, economic, political, and market-wide events:
Corporate Events
These include events directly

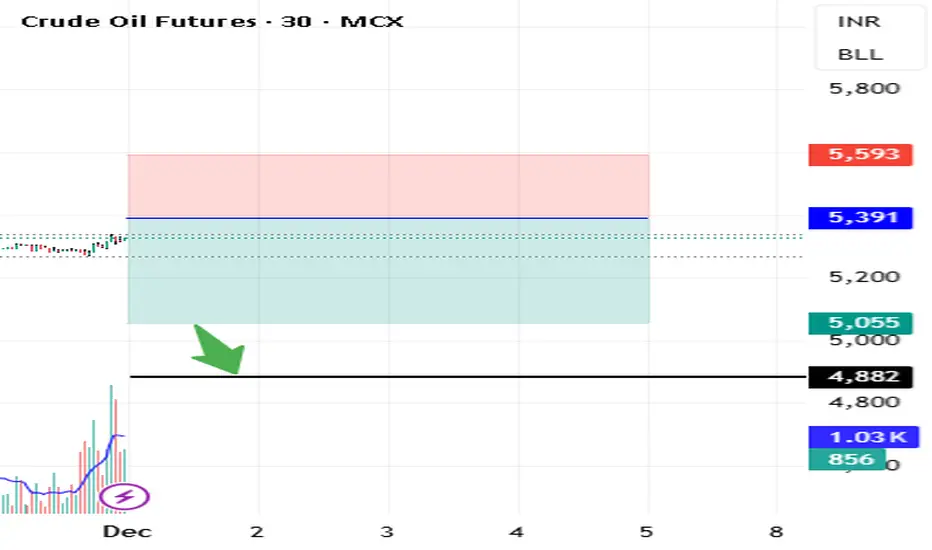
CRUDEOIL crudeoil sell zne 5390 to 5550.if there creat sell trend then bias 5050/4985,invalidation above 5590
Core Principles of Intraday Scalping Strategy1. Precision in Entry and Exit Timing
The heart of scalping lies in flawless timing. Since each trade aims to capture only a few ticks or points, even a slight delay can turn a winning trade into a losing one. Scalpers rely heavily on lower time frames such as the 1-minute, 3-minute, or 5-minute ch
See all ideas
Summarizing what the indicators are suggesting.
Neutral
SellBuy
Strong sellStrong buy
Strong sellSellNeutralBuyStrong buy
Neutral
SellBuy
Strong sellStrong buy
Strong sellSellNeutralBuyStrong buy
Neutral
SellBuy
Strong sellStrong buy
Strong sellSellNeutralBuyStrong buy
A representation of what an asset is worth today and what the market thinks it will be worth in the future.
Frequently Asked Questions
The current price of Oil Futures is 58.15 USD — it has fallen −0.36% in the past 24 hours. Watch Oil Futures price in more detail on the chart.
The volume of Oil Futures is 47.00. Track more important stats on the Oil Futures chart.
The nearest expiration date for Oil Futures is Mar 17, 2026.
Traders prefer to sell futures contracts when they've already made money on the investment, but still have plenty of time left before the expiration date. Thus, many consider it a good option to sell Oil Futures before Mar 17, 2026.
Open interest is the number of contracts held by traders in active positions — they're not closed or expired. For Oil Futures this number is 784.00. You can use it to track a prevailing market trend and adjust your own strategy: declining open interest for Oil Futures shows that traders are closing their positions, which means a weakening trend.
Buying or selling futures contracts depends on many factors: season, underlying commodity, your own trading strategy. So mostly it's up to you, but if you look for some certain calculations to take into account, you can study technical analysis for Oil Futures. Today its technical rating is sell, but remember that market conditions change all the time, so it's always crucial to do your own research. See more of Oil Futures technicals for a more comprehensive analysis.