Breakouts & Fakeouts in Trading🔹 Introduction
Financial markets are like living organisms – constantly moving, adjusting, and reacting to news, emotions, and liquidity. For traders, one of the most exciting moments is when a stock, currency pair, commodity, or cryptocurrency seems to break out of its range. Breakouts often lead to big, sharp moves, offering opportunities for quick profits.
But here’s the catch: not every breakout is real. Many are fakeouts (false breakouts) designed by market dynamics, liquidity hunters, or big players to trap traders. The difference between making money and losing money often lies in identifying whether a breakout is genuine or false.
This article dives into:
What breakouts are
Why fakeouts happen
Chart examples (conceptually explained)
Tools to confirm breakouts
Trading strategies to avoid traps
Risk management for breakout traders
🔹 Part 1: What is a Breakout?
A breakout occurs when the price of an asset moves outside a defined support or resistance level with increased momentum.
✅ Common Types of Breakouts
Resistance Breakout – Price moves above a previously strong ceiling.
Support Breakout – Price falls below a previously strong floor.
Trendline Breakout – Price breaks out of a rising or falling trendline.
Chart Pattern Breakout – Price escapes from patterns like triangles, flags, rectangles, or head & shoulders.
Volatility Breakout – When price explodes after a period of consolidation (Bollinger Band squeeze).
Why traders love breakouts?
They indicate a new trend may begin.
They provide clear entry and exit levels.
They often come with higher volume, confirming market interest.
Example: If Nifty is stuck between 19,500–20,000 for weeks and suddenly crosses 20,000 with heavy volume, that’s a bullish breakout.
🔹 Part 2: What is a Fakeout?
A fakeout (false breakout) happens when price temporarily breaks a level, lures traders into positions, but then reverses back into the range.
Fakeouts are dangerous because:
Traders enter aggressively expecting a trend, but get stopped out.
Big players use fakeouts to hunt stop-losses of retail traders.
They often happen during low liquidity or news events.
Example: Price breaks above 20,000, attracts buyers, but quickly reverses to 19,800. That’s a bull trap fakeout.
🔹 Part 3: Why Do Fakeouts Happen?
Fakeouts are not random; they are part of market psychology and structure.
Liquidity Hunting (Stop Loss Hunting)
Smart money knows retail traders place stop-losses above resistance or below support.
They push prices just beyond those levels, trigger stop-losses, then reverse.
Low Volume Breakouts
If breakout happens without strong participation, it’s usually unsustainable.
News & Events
A sudden announcement can cause sharp moves, but once news fades, price falls back.
Algorithmic Manipulation
High-frequency traders may push price beyond levels to create artificial breakouts.
Market Sentiment & Greed
Traders chase breakouts blindly, creating temporary momentum before exhaustion.
🔹 Part 4: Spotting Genuine Breakouts vs Fakeouts
✅ Clues for Real Breakouts
High Volume: Breakouts with above-average volume are stronger.
Retest of Levels: After breakout, price pulls back to test old support/resistance, then resumes trend.
Strong Candle Closes: Large body candles closing beyond the level.
Market Context: Aligns with larger trend or macroeconomic strength.
❌ Signs of Fakeouts
Breakout with low or declining volume.
Long wicks (shadows) beyond resistance/support but weak closes.
Breakouts during off-market hours or thin liquidity.
Price immediately snaps back into range after breakout.
🔹 Part 5: Chart Patterns & Fakeouts
Range Breakouts
Markets consolidate between two levels.
Breakouts beyond range are powerful but also prone to fakeouts.
Triangle Breakouts
Symmetrical/ascending/descending triangles show compression.
Fakeouts are common before the “real” breakout.
Head & Shoulders Pattern
A breakdown below the neckline should confirm trend reversal.
Many times, price breaks below neckline but quickly recovers.
Flag & Pennant Patterns
Strong continuation patterns, but fake breakouts happen if volume is missing.
🔹 Part 6: Strategies to Trade Breakouts & Avoid Fakeouts
1. Wait for Candle Close Confirmation
Don’t jump in immediately; wait for the candle to close above/below the level.
2. Use Volume as Filter
Only trade breakouts with above-average volume.
3. Retest Strategy
Enter on pullback to old support/resistance (safer entry).
4. Multi-Timeframe Confirmation
If breakout is visible on both 1-hour and daily charts, it’s stronger.
5. Combine with Indicators
RSI divergence can warn of false breakout.
Moving averages can confirm trend direction.
6. Avoid News-Driven Breakouts
Trade technical breakouts, not temporary news spikes.
🔹 Part 7: Risk Management in Breakout Trading
Even the best trader cannot avoid fakeouts completely. That’s why risk management is key.
Position Sizing: Risk only 1–2% of account per trade.
Stop Loss Placement:
For upside breakout: place SL below breakout level.
For downside breakout: place SL above breakdown level.
Use Partial Profits: Book some profit early, trail the rest.
Don’t Chase Breakouts: If you miss the first entry, don’t enter late.
🔹 Part 8: Real-Life Examples
Example 1: Stock Breakout
Stock consolidates between ₹500–₹520 for 2 weeks.
Breaks ₹520 with high volume, rallies to ₹550. (Real breakout)
Example 2: Crypto Fakeout
Bitcoin breaks $30,000 resistance but fails to sustain.
Falls back to $29,000 within hours. (Bull trap fakeout)
Example 3: Forex False Breakdown
EUR/USD breaks below 1.1000, triggering short trades.
Reverses sharply to 1.1050. (Bear trap fakeout)
🔹 Part 9: Psychology Behind Breakouts & Fakeouts
Retail Traders: Chase price blindly.
Institutions: Create liquidity zones by triggering retail stop-losses.
Fear & Greed: Traders either fear missing out (FOMO) or panic at reversals.
Patience vs Impulsiveness: Successful traders wait for confirmation, while impulsive ones fall for fakeouts.
🔹 Part 10: Advanced Tips for Professionals
Volume Profile Analysis
See if breakout aligns with high-volume nodes (strong support/resistance).
Order Flow Tools (Level II Data, Footprint Charts)
Helps spot whether breakout is supported by real buying/selling.
Breakout with Trend Alignment
Always trade in direction of higher-timeframe trend.
Market Timing
Breakouts during main sessions (like US market open) are more reliable.
🔹 Conclusion
Breakouts & fakeouts are two sides of the same coin. While real breakouts can deliver powerful moves, fakeouts are equally common and dangerous. The key lies in:
Confirming with volume, retests, and candle closes.
Avoiding emotional FOMO trades.
Protecting capital with risk management.
If you understand the psychology behind breakouts and fakeouts, use confirmation tools, and trade with patience, you can avoid traps and capture the big trend moves that follow genuine breakouts.
Gold Petal Futures
GOLDPETALG2025 trade ideas
Opportunities in PSU Stocks1. Historical Context of PSU Stocks in India
PSUs were originally created with the objective of building India’s industrial and economic base after independence. Since the private sector lacked resources and experience in heavy industries, the government stepped in to build enterprises in key sectors:
Oil & Gas: ONGC, IOC, HPCL, BPCL
Banking & Finance: SBI, PNB, BoB, LIC
Power & Energy: NTPC, NHPC, Power Grid, SJVN
Metals & Mining: Coal India, NMDC, Hindustan Copper
Engineering & Infrastructure: BHEL, NBCC, IRCON, RITES
Defense: HAL, BEL, BDL, Mazagon Dock
Initially, PSUs were seen as the backbone of the economy. Over time, inefficiencies, overstaffing, and political interference reduced their competitive edge. Private sector companies began to outperform them. This led to a long period where PSU stocks underperformed compared to private companies.
However, recent changes in government strategy, digital reforms, capital market participation, and global commodity cycles have shifted the outlook.
2. Why PSU Stocks are Back in Focus
Several factors have brought PSU stocks back into investor interest:
(a) Attractive Valuations
For many years, PSU stocks traded at low price-to-earnings (P/E) multiples compared to private peers. This made them undervalued despite strong fundamentals. Recent re-rating has unlocked opportunities.
(b) High Dividend Yields
PSUs are known for distributing high dividends, as the government is the largest shareholder and depends on dividend income. Some PSU stocks give 4%–10% annual dividend yield, making them attractive for long-term investors.
(c) Government Reforms & Disinvestment
The government has actively promoted disinvestment and privatization (e.g., Air India’s sale, BPCL privatization plans). This increases efficiency, improves market perception, and boosts stock prices.
(d) Revival in Core Sectors
Energy demand, infrastructure growth, and defense modernization are boosting PSU earnings. For example, Power Grid benefits from rising electricity demand, while HAL and BEL gain from India’s defense indigenization push.
(e) Improved Corporate Governance
Many PSUs have adopted better transparency, digital systems, and profit-focused strategies, reducing inefficiency and improving investor confidence.
3. Opportunities Across Different PSU Sectors
3.1. Banking & Financial PSUs
Key Players: SBI, PNB, BoB, Canara Bank, LIC, GIC, REC, PFC
Opportunity:
Public sector banks have cleaned up their balance sheets after years of bad loans (NPAs).
Credit growth is rising as the Indian economy expands.
SBI, the country’s largest bank, has become a strong wealth creator.
LIC, the insurance giant, is expanding beyond traditional markets and can benefit from India’s growing insurance penetration.
NBFCs like REC and PFC benefit from power sector financing demand.
Why Attractive: PSU banks trade at lower valuations than private banks but are witnessing strong earnings growth.
3.2. Oil & Gas PSUs
Key Players: ONGC, IOC, BPCL, HPCL, GAIL, Oil India
Opportunity:
India is heavily dependent on oil & gas imports, making PSUs critical players.
Rising energy demand ensures long-term growth.
GAIL’s gas distribution and pipeline network is expanding with the government’s push for a gas-based economy.
Strategic privatization of BPCL can unlock massive value.
Why Attractive: High dividend yields, global energy price cycles, and government support.
3.3. Power & Energy PSUs
Key Players: NTPC, NHPC, Power Grid, SJVN, Coal India
Opportunity:
India’s power demand is growing rapidly due to urbanization and industrialization.
NTPC is expanding into renewable energy.
Power Grid is a monopoly in transmission with stable cash flows.
Coal India benefits from being the largest coal producer in the world.
Why Attractive: Stable earnings, strong dividend payouts, and long-term demand visibility.
3.4. Defense PSUs
Key Players: HAL, BEL, BDL, Mazagon Dock, GRSE, Cochin Shipyard
Opportunity:
India is pushing for defense indigenization under the Atmanirbhar Bharat initiative.
Defense budget allocation is rising each year.
Export opportunities for Indian defense equipment are growing.
HAL and BEL are showing strong order books with multi-year growth visibility.
Why Attractive: Strategic importance, government support, and long-term contracts.
3.5. Infrastructure & Engineering PSUs
Key Players: BHEL, NBCC, IRCON, RITES, Engineers India
Opportunity:
India’s infrastructure push (roads, railways, housing, smart cities) benefits these companies.
IRCON and RITES are beneficiaries of railway modernization and export of rail technology.
NBCC plays a crucial role in government construction projects.
Why Attractive: Government-backed contracts, order book strength, and growth in infrastructure spending.
3.6. Metals & Mining PSUs
Key Players: NMDC, Hindustan Copper, MOIL, NALCO
Opportunity:
Commodity supercycles and rising demand for minerals (iron ore, copper, manganese, aluminum) benefit these PSUs.
NMDC is a low-cost iron ore producer, while NALCO is expanding aluminum production.
Electric vehicle (EV) growth increases demand for copper and aluminum.
Why Attractive: Global commodity upcycle, cost advantage, and strong government backing.
4. Key Strengths of PSU Stocks
Stable Business Models – Many PSUs enjoy monopolies or dominant positions in their industries.
Dividend Income – Attractive for long-term investors seeking passive income.
Government Support – Financial backing, bailout potential, and favorable policies.
Strategic Importance – PSUs play critical roles in defense, energy, and infrastructure.
Value Unlocking via Privatization – Upcoming privatizations can lead to stock re-rating.
5. Risks in PSU Stocks
While opportunities are strong, investors must be aware of risks:
Government Intervention – Policy decisions can affect profitability (e.g., fuel price controls for OMCs).
Competition from Private Sector – Private banks, energy companies, and defense startups pose challenges.
Global Commodity Price Volatility – Affects PSU metal, mining, and oil companies.
Disinvestment Delays – Political opposition or market conditions can slow privatization.
Efficiency Concerns – Despite improvements, some PSUs still face bureaucratic inefficiencies.
6. Investment Strategies in PSU Stocks
Dividend Investing – Focus on high-yield PSU stocks like Coal India, NTPC, Power Grid.
Value Investing – Buy undervalued PSUs trading at low P/E or P/B ratios.
Thematic Investing – Play sectors like defense indigenization (HAL, BEL) or renewable energy (NTPC, SJVN).
Disinvestment Opportunities – Monitor privatization candidates for potential re-rating.
Balanced Portfolio – Mix of stable dividend PSUs and growth-oriented defense/infra PSUs.
7. Outlook for PSU Stocks in India
The next decade could be transformational for PSU companies. Key trends driving growth:
India’s $5 trillion economy target will need massive energy, infrastructure, and defense spending.
Privatization push will unlock value and reduce inefficiencies.
Renewable energy expansion will benefit NTPC, NHPC, and SJVN.
Defense exports will grow as India becomes a global supplier.
Digitalization in PSU banks will improve competitiveness.
Foreign institutional investors (FIIs) and domestic investors are increasingly allocating capital to PSU stocks, indicating confidence in their long-term prospects.
Conclusion
PSU stocks in India are no longer “sleeping giants.” They have evolved into strong wealth-creating opportunities, backed by government reforms, improved efficiency, sectoral growth, and undervaluation compared to private peers.
Opportunities exist across multiple sectors: banking, energy, defense, infrastructure, and commodities. While risks remain in terms of government interference and competition, the overall outlook is positive.
For long-term investors, PSU stocks offer a unique combination of dividend income, stability, and growth potential. With India’s economic rise, PSU stocks can play a central role in wealth creation for investors who are willing to stay patient and selective.

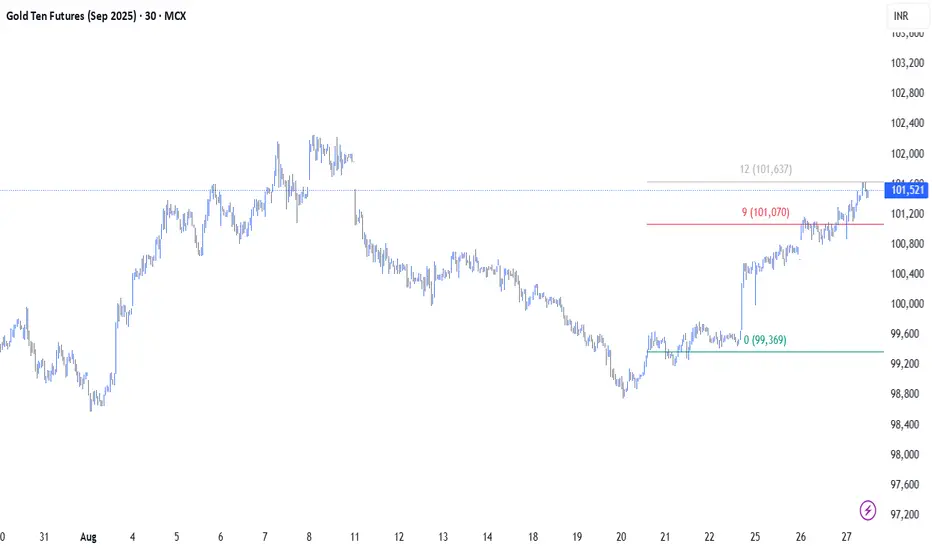
GOLDTENU2025 Trend Reversal CapturedRiding strength in MCX:GOLDTENU2025 since 20th August.
Entry clear, risk minimal.
Trend unfolding, stops trailing.
Discipline over impulse.
Protecting downside, letting upside breathe.
This is how winners compound.
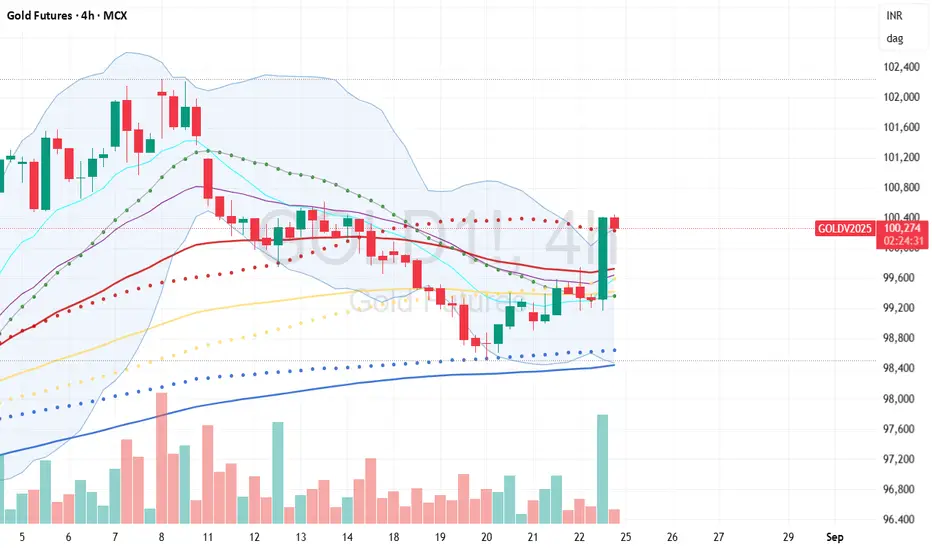
Sell Gold with SL 100800📌 MCX Gold Technical Outlook (₹/10g)
Context: Despite Jackson Hole and fresh rate-cut chatter, gold hasn’t managed a decisive breakout. The USD resistance near $3,390 is capping price; on MCX that maps to ₹100,800.
View
Bias tilts neutral-to-bearish unless price closes above ₹100,800. Failure to clear that cap keeps the door open for a pullback.
Key Levels (mapped with USD/INR = 87.20)
Resistance / Bull trigger: ₹100,800 (≈ $3,390)
Support 1 / First target on weakness: ₹99,100 (≈ $3,330)
Support 2 / Deeper target: ₹97,300 (≈ $3,270, approx)
Scenarios
Base case (bearish drift): Rejections below ₹100,800 → slip toward ₹99,100. If that breaks on a closing basis, extension toward ₹97,300 is likely.
Invalidation: A strong close above ₹100,800 flips momentum back up; then reassess for higher targets.
Tactics (example):
Look for retest + rejection near ₹100,800 for risk-defined shorts.
Stops just above the rejection high; targets ₹99,100 → ₹97,300 in steps.
If price bases at ₹99,100 and reclaims higher lows, consider trimming shorts or tightening risk.
Note: Levels are directly mapped from USD spot/futures anchors using your FX assumption (USD/INR 87.20):
$3,390 → ₹100,800 · $3,330 → ₹99,100 · $3,270 → ₹97,300 (approx).
Trading Master Class With ExpertsReal-Life Applications of Options
Options are not just trading tools; they have practical uses:
Insurance companies use options to hedge portfolios.
Exporters/Importers hedge currency risks using options.
Banks use interest rate options to manage risk.
Investors use protective puts to safeguard their stock portfolios.
Psychology of Options Trading
Trading options requires discipline. Many beginners blow up accounts because:
They buy cheap OTM options hoping for jackpots.
They ignore time decay.
They overtrade due to low cost of entry.
A successful option trader thinks like a risk manager first, profit seeker second.

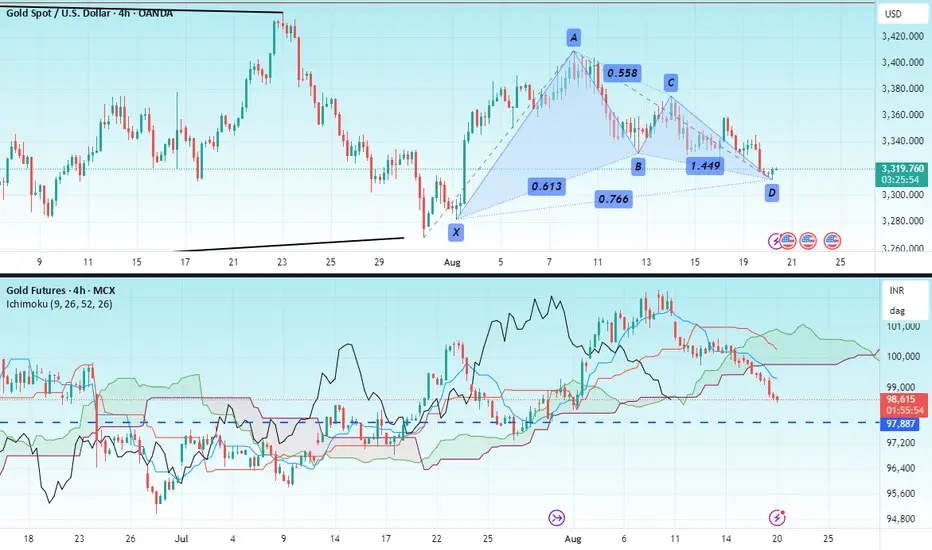
GOLDHello & welcome to this analysis
Gold at COMEX has formed a bullish Harmonic Gartley pattern in 4hr time frame suggesting a reversal in trend.
As long as it sustains above $3295 it could give a bounce/rally till $ 3345 - 3370 - 3400 - 3450.
Gold at MCX appears to be ending its pullback but due to INR $ fluctuations a bullish Harmonic pattern has not formed. One could look for bullish trades as long as its above 97900 for upside levels of 99400 - 100000 - 101000 - 102500. Keep in mind levels could alter due to forex changes
Overall GOLD is strong and has an upside triangle breakout target of $3700 open as long as it is above $3250 (refer to my earlier view published on Gold in the link)
All the best
GOLD trade ideaGOLD 100391 is in bullish trend and heading to 101738 with support Support 98898.. It expected to find resistance there and reverse to 96490.

Gold Futures hits monthly VWAP Gold futures (Dec) hits monthly VWAP and 3 standard deviations from weekly VWAP. Possible double top in play on daily. Confirmation for lower prices 3405.
Previous swing high 3423.8
Current High 3423.4
Note : 1.625 (5/8 level) =3309 Where we have old bottom of 3307.4

Rising Wedge in Gold
Bearish divergence visible in RSI & MACD
Volumes thinning out on rallies
Suggests safe-haven demand cooling
⚠️ Watch for breakdown below support — could trigger deeper correction.
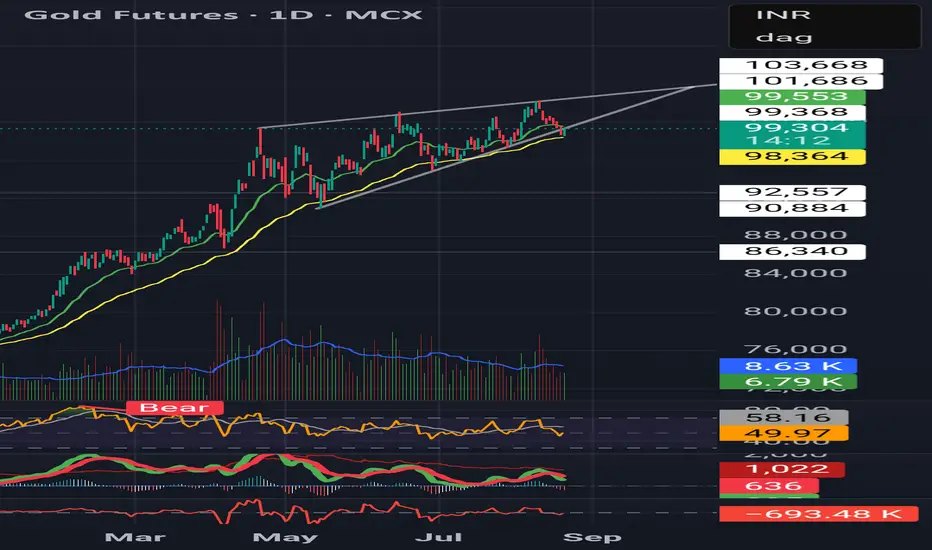
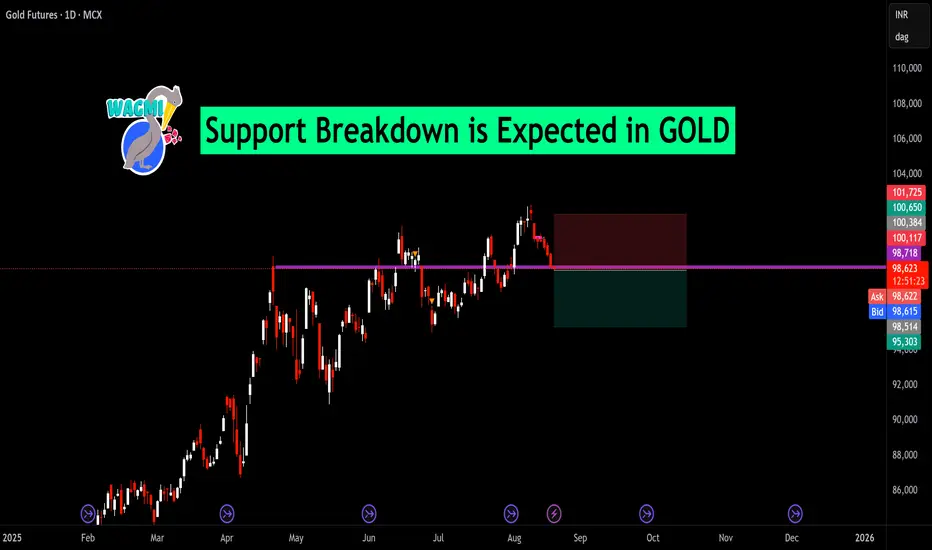
Gold Futures – Support Breakdown on the RadarGold Futures (MCX) is currently hovering near a critical support zone around ₹98,600. Price action shows repeated testing of this level, and the latest candles indicate weakening momentum. A decisive breakdown below this support could trigger further downside pressure.
📉 Technical View:
Key support: ₹98,600
Breakdown below this zone may open room towards ₹95,300–₹96,000 levels.
Resistance: ₹100,000–₹100,650 zone (selling pressure expected if price pulls back).
The highlighted range suggests that the market is at an inflection point, and traders should watch closely for confirmation of a support breakdown, which could accelerate bearish momentum in the coming sessions.
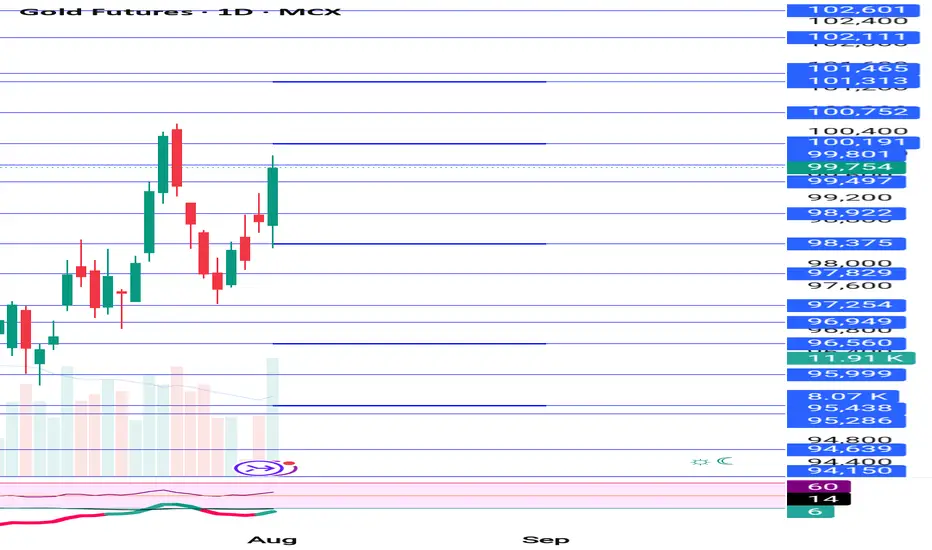
Gold Faces Resistance, Buyers Should Stay Alert near Key SupportGold Futures (MCX) Analysis: Key Points to Watch
Current Price Range: Gold Futures are trading around ₹98,700 to ₹98,750.
Resistance Zone: Gold has been repeatedly rejected near its high around ₹101,500, showing strong selling pressure at this level.
Trendline Broken: Recently, gold broke an important upward trendline that had acted as a reliable bounce-back support.
Key Support Emerging: After this break, a key support level has appeared around ₹97,700 to ₹97,750. This zone will be important to watch for potential price stabilization.
Additional Support Levels: The chart also highlights other support zones that could provide buying interest if prices decline further.
Trader Outlook: Buyers need to remain cautious and vigilant at these levels. The market shows signs of short-term weakness, and how gold behaves around these supports will be crucial for the next move.
Gold is at a critical juncture where it faces both selling pressure and key supports. Watching the reaction around ₹97,700-₹97,750 will help gauge whether bulls regain control or further correction unfolds. Stay alert and manage risk carefully.

Gold mcx down because of USDINR effect 3330 important on comex Gold mcx going down more compared to comex because of USDINR effect.
Gold mcx support area are:
98720-98550 , 97780 -97500, 96550-96410
Resistance area:
99500 , 100380 , 100550 , 101100-101280 ,
102200-102500
How My Harmonic pattern projection Indicator work is explained below :
Recent High or Low :
D-0% is our recent low or high
Profit booking zone ( Early / Risky entry) : D 11.8% -D 16.1 % is
range if break them profit booking start on uptrend or downtrend but only profit booking, trend not changed
SL reversal zone (Safe entry ) : SL 23% and SL 25% is reversal zone if break then trend reverse and we can take reverse trade
Target : T1, T2, T3, T4 and .
Are our Target zone
Any Upside or downside level will activate only if break 1st level then 2nd will be active if break 2nd then 3rd will be active.
Total we have 7 important level which are support and resistance area
Until , 16% not break uptrend will continue if break then profit booking will start.
If break 25% then fresh downtrend will start then T1, T2,T3 will activate
1,3,5,10,15,20 minutes are short term levels.
30 minutes 60 minutes , 2 hours,3 hours, ... 1 day and 1 week chart positional and long term levels

Gold - Bearish ? Double Top with RSI DivergenceGold was bullish only due to empty words from Trump saying no gold in US, its missing, no one audited for 40 years, no doors and no windows in the store house etc etc. He never took efforts to go and check it or ask for audit report. so in my view its empty words from Trump. It must have helped Russia to offload its tons and tons of Gold accumulated long before the war, Thats the biggest gift Trump given to Putin to book profits in Gold. It has formed double top with clear Bearish Divergence in RSI. In my view its a Sell now and many be buy at lower levels later. No war, no covid and why any one hold Gold at these very high price ?

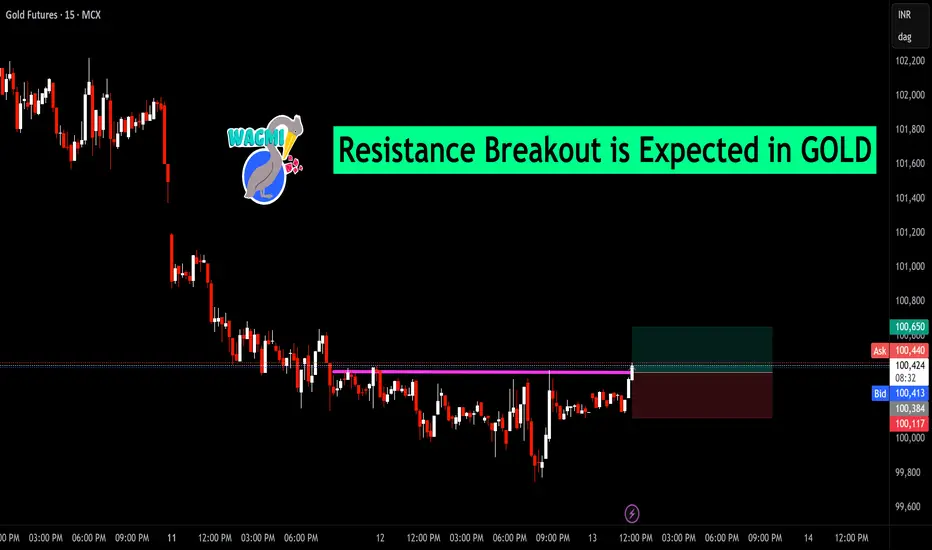
Resistance Breakout is Expected in GOLDGold prices are approaching a key resistance level around ₹100,400 after consolidating in a tight range. A breakout above this zone could trigger bullish momentum, supported by higher lows forming in the recent price action.
📈 Trade Setup:
Entry: ₹100,400 (Breakout Confirmation)
Stop Loss: ₹100,117 (Below recent swing low)
Target: ₹100,650 (Near-term resistance zone)
The price structure suggests growing buying interest, and a decisive close above resistance may open the path for further upside.
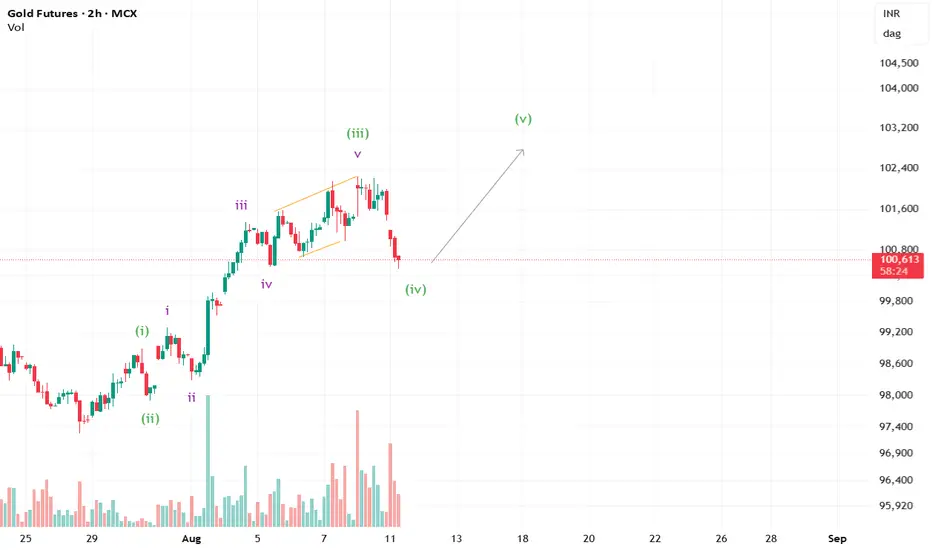
Bullish signs for Gold?Gold seems to have made a good corrective move for wave iv. We may see a new high in the coming sessions.
Gold sell recommended near 101600 , book profit nowGold sell recommended near 101600, better to book profit now ,
Gold updated levels given on chart better to take small trades and avoid overnight Market trading on news
Rate cuts geopolitical issues, tarrif will act both side move play safe

Part11 Trading Masterclass How Options Work
Let’s break this down with an example.
Call Option Example:
You buy a call option on Stock A with a strike price of ₹100, paying a premium of ₹5. If the stock price rises to ₹120, you can buy it for ₹100 and sell it for ₹120—earning a ₹20 profit per share, minus the ₹5 premium, netting ₹15.
If the stock stays below ₹100, you simply let the option expire. Your loss is limited to the ₹5 premium.
Put Option Example:
You buy a put option on Stock A with a strike price of ₹100, paying a ₹5 premium. If the stock falls to ₹80, you can sell it for ₹100—earning ₹20, minus ₹5 premium = ₹15 profit.
If the stock stays above ₹100, the option expires worthless. Again, your loss is limited to ₹5.
Why Trade Options?
A. Leverage
Options require a smaller initial investment compared to buying stocks, but they can offer significant returns.
B. Risk Management (Hedging)
Options can hedge against downside risk. For example, if you own shares, buying a put option can protect you against losses if the price falls.
C. Income Generation
Writing (selling) options like covered calls can generate consistent income.
D. Strategic Flexibility
You can profit in bullish, bearish, or neutral markets using different strategies.

Part11 Trading MasterclassTypes of Option Traders
1. Speculators
They aim to profit from market direction using options. Their goal is capital gain.
2. Hedgers
They use options to protect investments from unfavorable price movements.
3. Income Traders
They sell options to earn premium income.
Option Trading Strategies
1. Basic Strategies
A. Buying Calls (Bullish)
Used when you expect the stock to rise.
B. Buying Puts (Bearish)
Used when expecting a stock to fall.
C. Covered Call (Neutral to Bullish)
Own the stock and sell a call option. Earn premium while holding the stock.
D. Protective Put (Insurance)
Own the stock and buy a put option to limit losses.
2. Intermediate Strategies
A. Vertical Spreads
Buying and selling options of the same type (call or put) with different strike prices.
Bull Call Spread: Buy a lower strike call, sell a higher strike call.
Bear Put Spread: Buy a higher strike put, sell a lower strike put.
B. Iron Condor (Neutral)
Sell OTM put and call options, buy further OTM put and call to limit risk. Profit if the stock stays within a range.
C. Straddle (Volatility)
Buy a call and a put at the same strike price. Profits from big price movement in either direction.

GOLD LONGEntry- 101650-101600
SL- 101200
Target- 102700
Pattern- Gold is making a cup and handle pattern in 1hr TF and is also breaking out of an important resistance zone that 101550. Hence a long trade can be initiated in Gold.
Disclaimer- This is just for educational purpose please take advice before making any decision.
Jai Shree Ram.

Part6 Learn Institutional TradingAdvantages of Options Trading
Leverage: Small capital can control larger positions.
Risk Defined: Buyers know their maximum loss (premium).
Flexibility: Strategies for bullish, bearish, or neutral markets.
Income Generation: Selling options can earn premiums regularly.
Hedging Tool: Protect portfolios from downside risks.
Risks in Options Trading
Time Decay: OTM options lose value fast.
Volatility Crush: After events like earnings, implied volatility drops.
Assignment Risk: Sellers may be assigned if the option is ITM.
Liquidity Risk: Wider spreads in illiquid options lead to slippage.
Complexity: Advanced strategies require a deeper understanding.
Sellers have potentially unlimited risk, especially in naked option writing.

Gold start sell on rise again , upside limited Gold mcx today will more fall compared to Comex because of RBI policy action .
Good selll onnrise upside limited points.maximum negative on price

GOLDHello & welcome to this analysis
Comex GOLD appears to have completed its triangle and is now likely to give a breakout above 3439 for an upside target of 3750.
The triangle goes invalid if we witness a sell off from current levels and it breaks 3250 on the downside.
MCX Gold appears to have a Cup & Handle formation (similar to a triangle) and is now likely to confirm a breakout above 101075 for upside targets of 103750 - 106200 (will depend a lot on $:INR).
The Cup and Handle pattern goes invalid if we witness a sell off from current levels and breaks 99250 on the downside.
Overall use dips to add/trail, shorting (intra day would be a different scenario) overnight from here looks like a very risky trade.
All the best

Gold mcx next week updated levels currently at resistance area Gold updated levels for next week currently at resistance area, if break 3340 on comex then fall will start and go to previous week low also