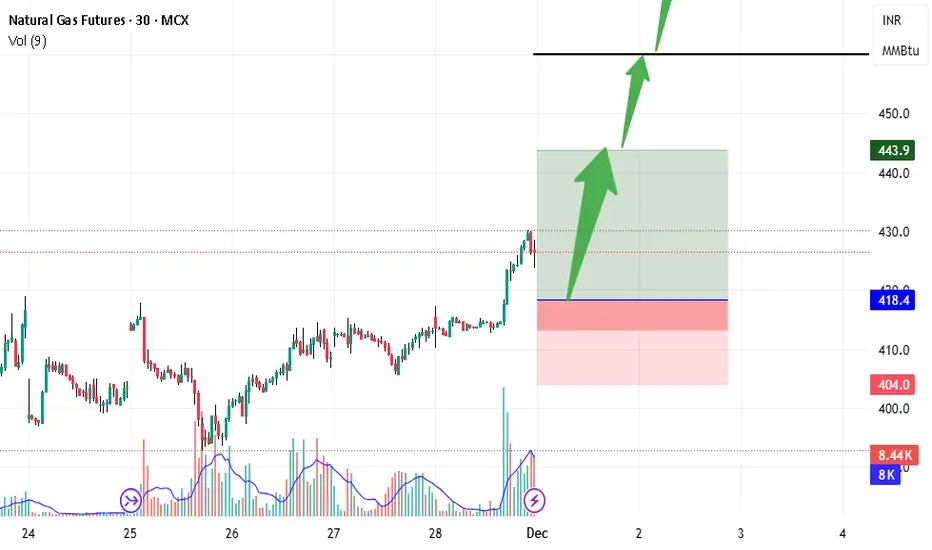
Long NaturalgasNatural gas is looking good in current scenario.
If it will do breakout from 430 zone then we can see 432 and 468
1st Dec is date for 432 and 24 dec 468
This is as per my sqroot calculation from previous top formation.
For downside you must hedge the trade by buying Bullish Put spread or bullish ca
Sorry, this is only available to registered users
MCX provides data to our registered users only, so to get it you'll need to sign up for a TradingView account.
Related commodities

Unlock India’s Derivatives Power1. The Rise of Derivatives in India
Derivatives—such as futures, options, and swaps—derive their value from underlying assets like stocks, indices, commodities, currencies, and interest rates. India’s derivatives journey began in the early 2000s when SEBI introduced index derivatives to modernize c

PCR Trading Strategies How Option Prices Move (Option Greeks)
Option premiums move because of time, volatility, and market direction. The Greeks explain this movement.
1. Delta – Direction Sensitivity
Delta shows how much premium changes with a ₹1 move in the underlying.
Call delta: +0.3 to +1.0
Put delta: –0.3 to –1

Advantages of Algorithmic Trading for Retail InvestorsIntroduction
In the modern financial markets, technology has revolutionized trading, making it more accessible, efficient, and sophisticated. Algorithmic trading, often referred to as algo-trading or automated trading, is a prime example of this transformation. It involves using computer algorithms
NG profit booking ossible above 415-418, avoid buy trade AI dataParameters Data
Asset Name Natural Gas MCX
Reason 🟩 Strong breakout above ₹400 level, supported by colder weather forecasts in the US and high LNG demand.
R:R 🟩 1:1.50 (T3 target ke liye favorable. SL 400 ke major support ke niche rakha gaya hai.) / Threshold: Breakout above - & Breakdown below

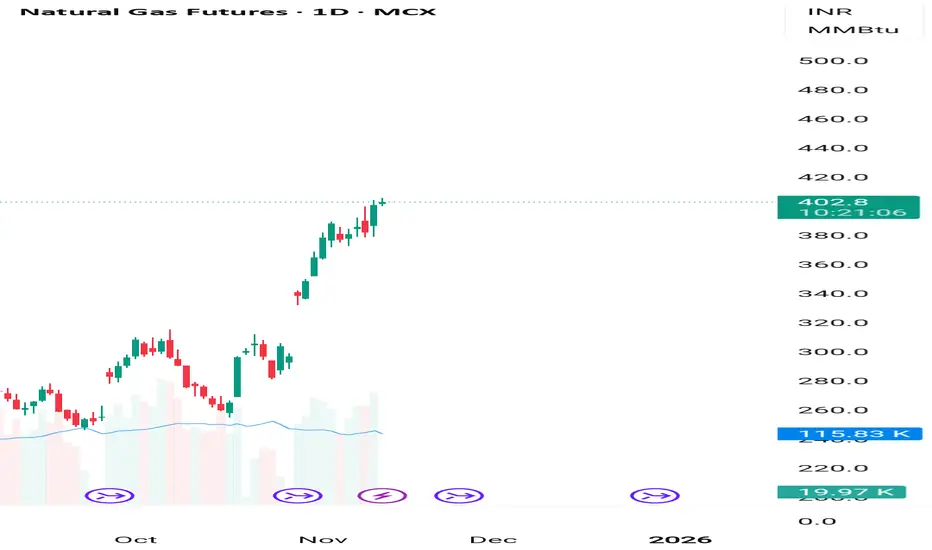
NATURAL GASVnatural gas december contract best one 418.50to 413 invalidation beloe 404 upside bias 444/460/477
mcx natural gas update blwin daily chart or weekly chart looks some smart breakout yes eyes on 420 if mkt sustain abv or close abv 2 days than looks 454---80--500+++ support find 405@
trading ideas---- buy mkt ya any dips 420--15 sl 405 close base tgt given in report

Naturalgas 395 to 405 range trade after breaking 🔑 Key Highlights
- Price Action: Natural Gas trading at ₹400, holding above ₹395 support.
- Trend: Active Long Build‑Up confirmed.
- Supports: ₹395 / ₹388 / ₹382.
- Resistances: ₹405 / ₹412 / ₹420.
- Bias: Bullish continuation if above ₹395; corrective pullback risk below ₹388.

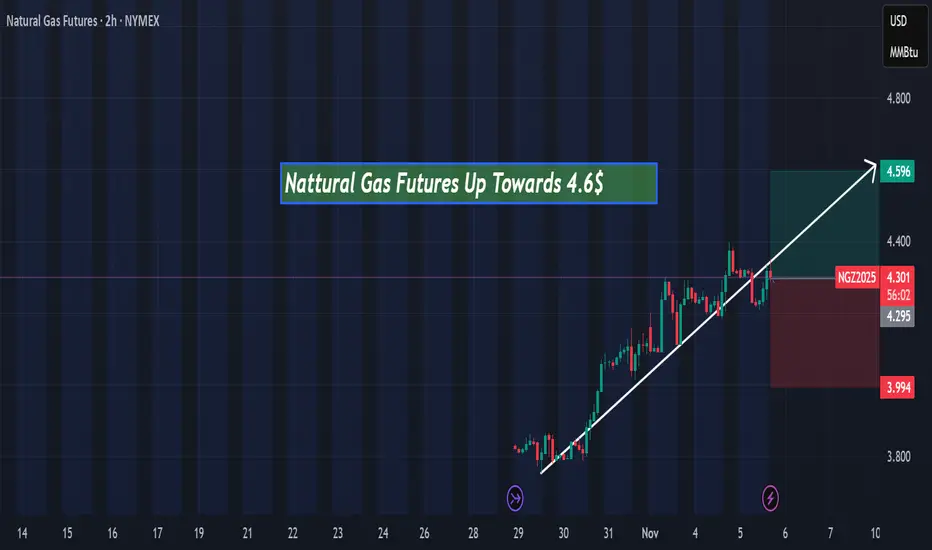
Natural Gas Futures Up towards 4.6$Hi everyone, today Natural Gas Futures is expected to rise toward $4.60 in the next few hours according to my technical analysis.
AITool showing Natural gas 395 until not break upmove continue 🔑 Key Highlights
- Price Action: Natural Gas is holding steady above ₹402, showing mild bullish momentum.
- Trend: Long Build‑Up (Price↑ + OI↑), suggesting fresh long positions.
- Supports: ₹399 / ₹395 / ₹389.
- Resistances: ₹406 / ₹412 / ₹420.
- Bias: Bullish continuation if ₹399 holds; cor
See all ideas
A representation of what an asset is worth today and what the market thinks it will be worth in the future.
Sorry, this is only available to registered users
MCX provides data to our registered users only, so to get it you'll need to sign up for a TradingView account.
Displays a symbol's price movements over previous years to identify recurring trends.