Natural gas - Matches the exact moves, posted on 24th AugNatural gas - Matches the exact moves, posted on 24th. August
Points gained- 229.5 to 264.8 = 35.3 points
1 Point = ₹1000 (35.3*1000= ₹35300.0)
Holding it, next is 300 & 320 target🎯
Natural Gas Futures
Sorry, this is only available to registered users
MCX provides data to our registered users only, so to get it you'll need to sign up for a TradingView account.
Contract highlights
Related commodities
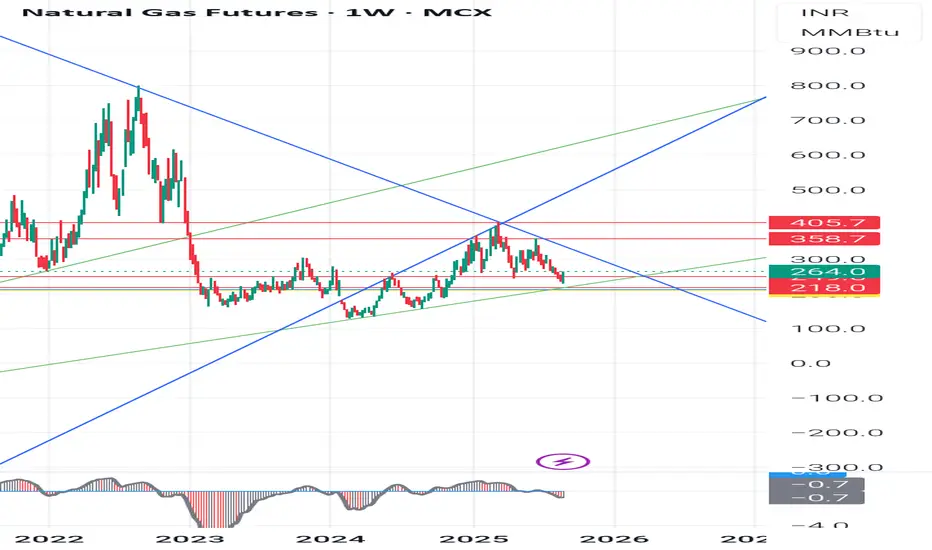
Natural Gas Futures (INR) Weekly Chart pattern analysisNatural Gas Futures (INR) Weekly Chart pattern analysis.
For the students, We will include chart structure, patterns, demand-supply zones, and precise support/resistance levels based on what is seen on the charts :
- Chart OverviewTimeframe: Weekly (1W)Current Price: 244.7 (down -5.30%)Price is near
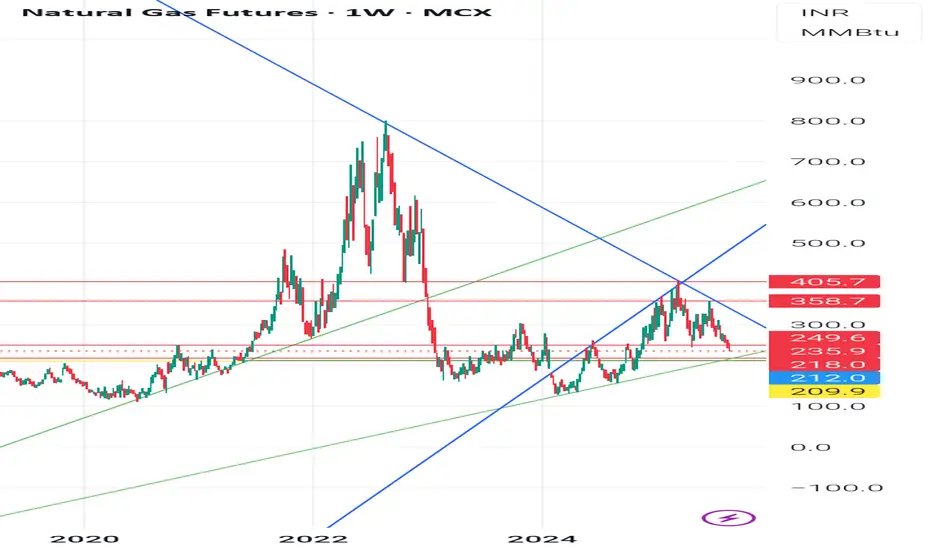

short natural gasNATURAL gas looks weak if breaks 230 then 160 possible .until u can play short upto 240 with sl of 275.
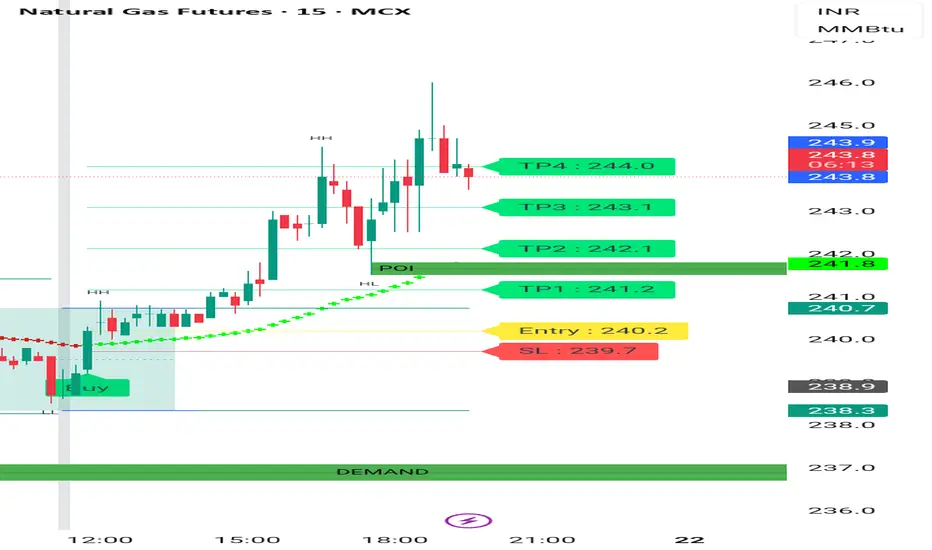
Natural gas 15 min Chart Natural gas 15 min Chart shows good strength. It's moving up with demand zone . Cmp 243. It may move further up . No buy sell Reccomendation. It's for educational purposes only. Consult your financial advisor before making any position in stock market. Stock market is risky .
Volume Profile & Market Structure AnalysisIntroduction
In modern financial markets, traders and investors rely on both price and volume to make informed decisions. While traditional technical analysis focuses heavily on price charts, patterns, and indicators, volume profile analysis introduces a powerful dimension: it shows not just where
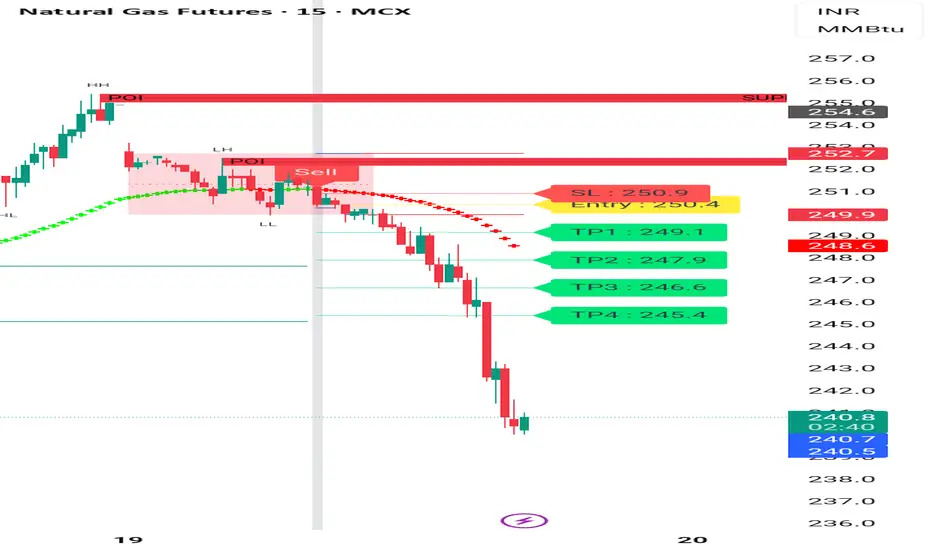
Ng shoryed with indicator at 250 . Now 240 Ng shoryed with indicator at 250 . Now 240 . natural followed our set up. And good opportunity to sell at 250 with set up .
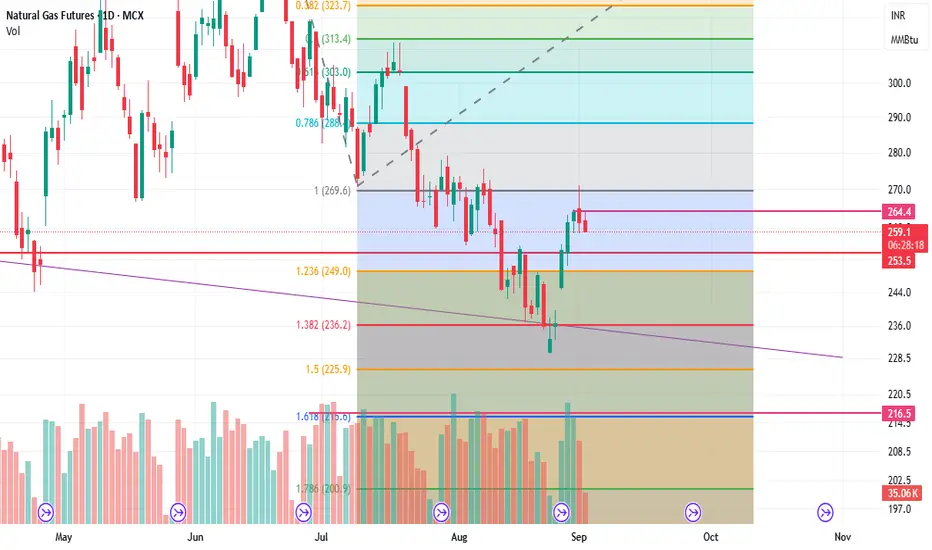
Natural gas buy given near 240-243 , ng bottom formation almost Natural gas buy given near 243-240 , bottom formation almost done. If break 258-260 resistance area then fresh uptrend will start
Upside resistance 258-260, then 268-271 , 277-279
Support 243-240 then 232-230
How My Harmonic pattern projection Indicator work is explained below :
Recent High o

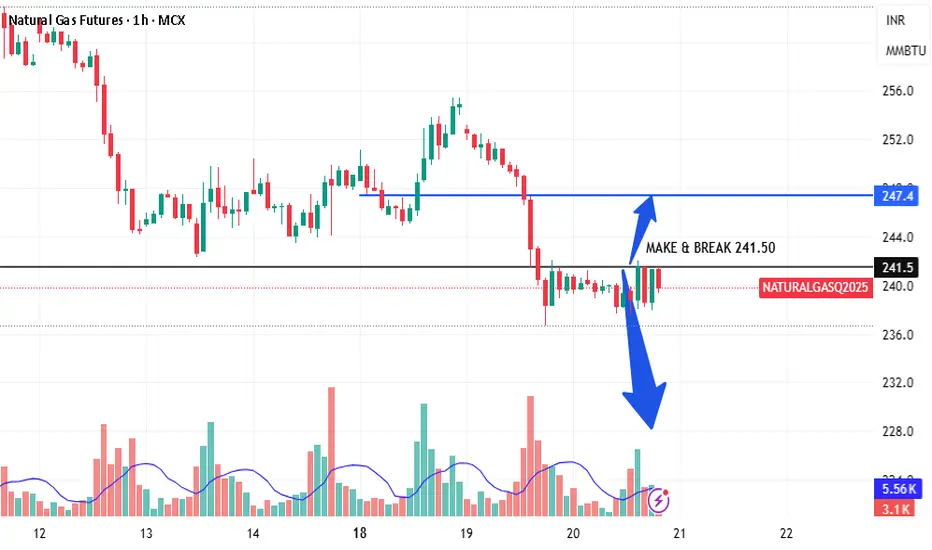
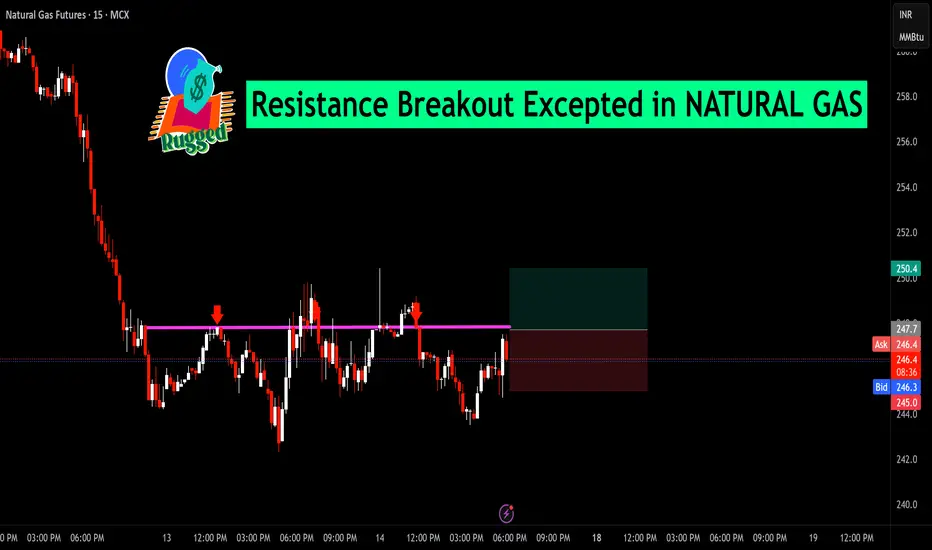
Resistance Breakout Excepted in NATURAL GASNatural Gas has been consolidating just below a key resistance level around ₹247–₹248, with multiple rejection points in recent sessions (marked by red arrows). The current price action shows renewed buying pressure, with candles testing the resistance zone once again.
Technical View:
The horizont
See all ideas
Summarizing what the indicators are suggesting.
Neutral
SellBuy
Strong sellStrong buy
Strong sellSellNeutralBuyStrong buy
Neutral
SellBuy
Strong sellStrong buy
Strong sellSellNeutralBuyStrong buy
Neutral
SellBuy
Strong sellStrong buy
Strong sellSellNeutralBuyStrong buy
A representation of what an asset is worth today and what the market thinks it will be worth in the future.
Sorry, this is only available to registered users
MCX provides data to our registered users only, so to get it you'll need to sign up for a TradingView account.
Frequently Asked Questions
The nearest expiration date for Natural Gas Futures is Sep 25, 2025.
Traders prefer to sell futures contracts when they've already made money on the investment, but still have plenty of time left before the expiration date. Thus, many consider it a good option to sell Natural Gas Futures before Sep 25, 2025.
Open interest is the number of contracts held by traders in active positions — they're not closed or expired. For Natural Gas Futures this number is 27.89 K. You can use it to track a prevailing market trend and adjust your own strategy: declining open interest for Natural Gas Futures shows that traders are closing their positions, which means a weakening trend.
Buying or selling futures contracts depends on many factors: season, underlying commodity, your own trading strategy. So mostly it's up to you, but if you look for some certain calculations to take into account, you can study technical analysis for Natural Gas Futures. Today its technical rating is neutral, but remember that market conditions change all the time, so it's always crucial to do your own research. See more of Natural Gas Futures technicals for a more comprehensive analysis.