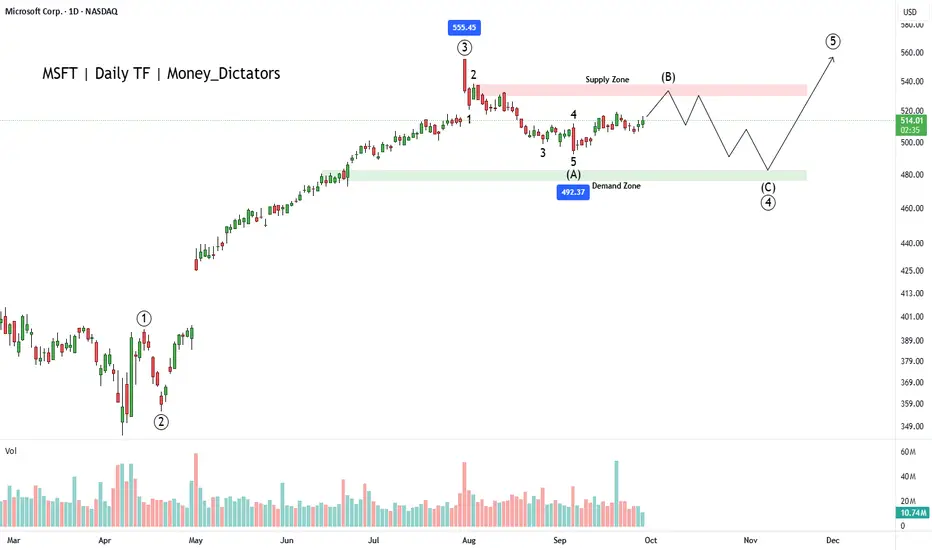
MSFT will hit 625-630MSFT is almost completed correction in 4th wave, and is eying for 625-630 run in coming months.
At the moment base seem to have created, any daily close above 520 will be bullish !
Microsoft Corporation
No trades
Trade ideas

Why MSFT Could Be a Smart Pick in 2025?MSFT has bullish signals from the multiple moving averages, RSI and volume analysis. However, wave principle asks evidence from the buyers. The wave count suggests that the corrective wave (B) is ongoing, and bears will control the final wave of the primary wave 3.
Wave C will start falling nearby the supply zone and high of the 2nd wave of wave intermediate wave A. Wave C can fall up to 476 which will be the strength for wave primary wave 5. As per the chart, breakout above 540 will be a good signal for bulls to take charge back.
Zones:
Supply zone: 538 - 528
Demand zone: 482 - 476
I will update the chart and details shortly.
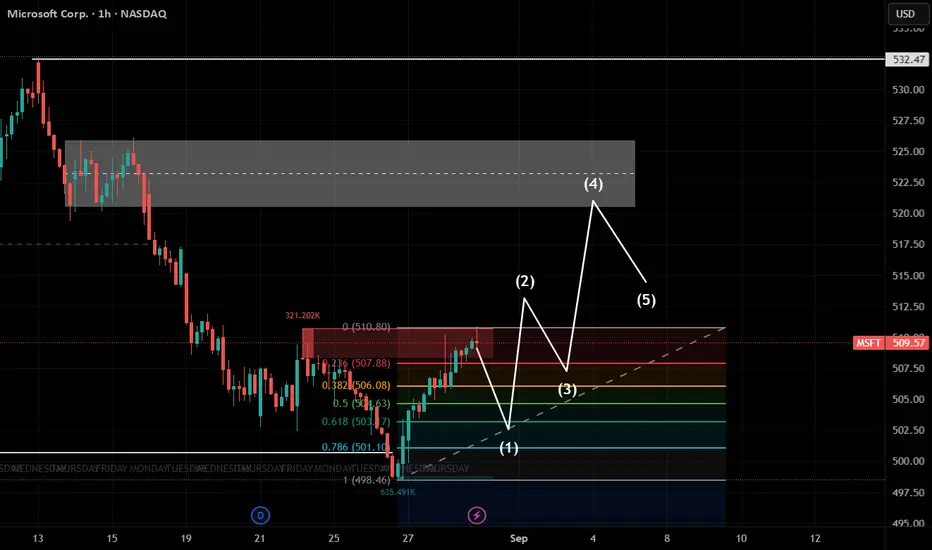
microsoft stock updatemicrosoft stock grab previous liquidity 501$. stock in demand zone aera.to take long position wait for retracement area and take. premium(resistance)area is 520$ to 532$
1st target = 520$
2nd target = 532 $
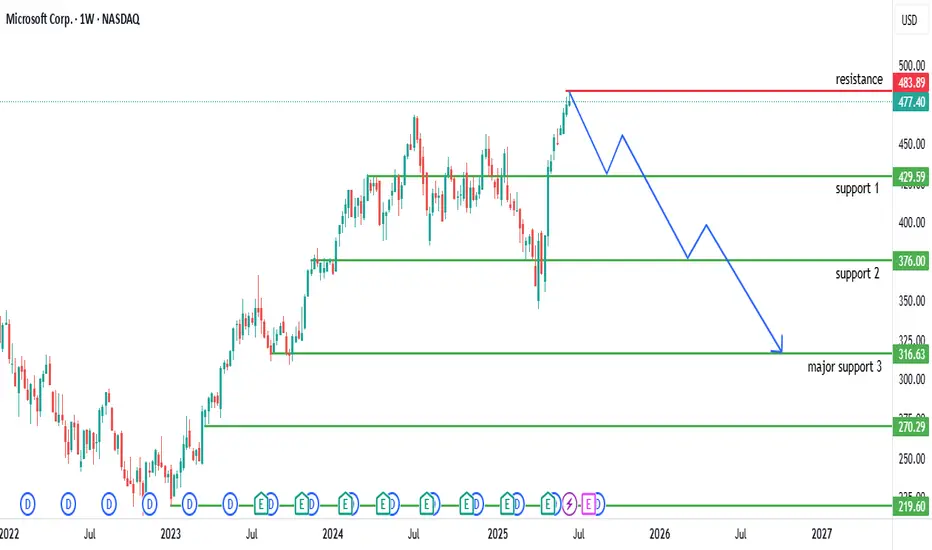
Analysis of Microsoft Corp. (MSFT) Weekly ChartHistorical Trend: The chart illustrates Microsoft Corp.'s stock price on a weekly timeframe from 2022 to mid-2025. The stock showed a steady upward trend from 2022 to early 2025, reflecting strong growth driven by its dominance in software and cloud computing.
Key Levels:
Resistance: The $483.89-$477.40 range (red line) has acted as a significant resistance level. The price recently tested this zone and appears to have faced rejection.
Support Levels:
Support 1: $425.59 (green line) served as a mid-range support during recent corrections.
Support 2: $376.00 (green line) acted as a stronger support level during prior consolidations.
Major Support 3: $316.63 (green line) represents a critical long-term support zone, tested during deeper pullbacks.
Recent Price Action: After approaching the resistance at $483.89, the stock experienced a sharp decline, forming a descending pattern (blue line). This suggests a potential bearish reversal or correction following the rejection at resistance.
Projected Movement: The downward projection indicates the stock could decline toward the $316.63 major support level if the bearish momentum continues. A break below $376.00 would confirm this trend, while a bounce from $425.59 could signal a potential recovery.
Volume and Indicators: The chart includes Bollinger Bands (O475.21 H483.46 L474.08 C477.40) with a -2.44 (-0.51%) change, indicating moderate volatility. The recent drop suggests selling pressure, though specific volume data is not detailed.
Outlook: The stock is currently in a bearish phase after failing to break above $483.89. Watch for a potential test of $425.59 or $376.00 supports. A recovery above $477.40 would indicate a resumption of the bullish trend, while a drop below $316.63 could signal a deeper correction.
Market bubbles are for real !MSFT vs CAT returns after the peak of 2000’s, The Dot Com Bubble! CAT has outperformed to the date. For a rough idea MSFT has given 800% vs CAT has given 1500% since 2000’s.
This does not mean the same will happen in the next 25 years. This ratio chart of MSFT/CAT shows that market bubbles are for real, at least in this case.

MSFT Support on Weekly MA20, $515 Price TargetMSFT hasn't missed an earnings since before 2024.
Weekly chart looks strong. On the 1 hour you can see they went low for a last liquidity grab.
ER tonight if positive reaction can make the stock go to 480-500
This feels all around bullish to me and they are also to announce partnership progress in AI projects.
NFA - I went with August contracts.
Good luck


Microsoft (MSFT) Trade Setup: Swing TradeCurrent Price: $431.97
Risk-Reward Setup: Risk $10 to potentially gain $40.
Entry Point:
The price is currently hovering at $431.97. This level seems to be consolidating after a recent upward move, likely providing a decent entry point if the market remains bullish.
Stop Loss:
Stop Loss Set at: $422
This is a $10 risk from the current price. Strategically place it below the current support zone (around $422), where a key moving average or recent price low may provide support. If the price breaks below, it signifies a bearish signal and triggers the exit.
Target Profit:
Target: $471
With a $40 upside target, this aligns with the next key resistance level. Given the current bullish momentum and based on the volume, reaching this level is feasible if the uptrend
continues.
Risk-Reward Ratio:
Ratio: 4:1 (For every $1 risked, you're targeting $4 in profit).
This is a solid ratio, especially for swing trades or medium-term holds.
NOTE : The setup looks promising for a swing trade with a high probability of success if the market sentiment remains positive. As always, ensure to monitor for any sudden market shifts or macroeconomic events that could affect the overall trend.

Breakout stock-Microsoft corporationStock has been analyzed based on my trendline analysis. Please note that levels given are for training and educational purpose only. Please do consult your financial advisor before investing in the stock

Microsoft CorporationIf the technicals of this stock are really respected by the market, there is easily 10% safe upside for this stock.It came down because of the Japanese Interest rates increase, but that is already factored into the market. Even the first support level is very well respected by the stock
Let's see if we would be able to see 10% upside in this stock in coming few days.

Microsoft - Blessing in disguiseLooks like it may come true wen they say Buy Fear - Sell Greed
Stock coming at strong Demand Zone
As it also is a Flip Zone
All the selling pressure have been absorbed can be seen
If sustains the current area may go on to touch new highs in coming days
Risk to reward most favorable at current levels

Microsoft Target Minimum in 500$This is the one of the Learder in the currently in the AI Space company Microsoft this company weekly chart formation in the cup & handle pattern.
If your are Previous view after the complet cup & handle pattern price move in in the Depth of the cup 1X to 2X my View this is the 2X Move.


Microsot Time to Play AIIn current time the price of the MSFT is ggod level for buy in the long term, Price is after correction looking good

MSFT looks bullish from here. This is based off my opinion, and the fact that I don't bet against Bill Gates. I don't care for him either, just a trade idea. Not financial advice, stock is very high.

Microsoft fallMicrosoft looks like has formed a ascending wedge and has gone up recently following the santa rally but will eventually fall

$NASDAQ:MSFT Everyone is doing the SIP the Wrong way...NASDAQ:MSFT Everyone is doing the SIP the Wrong way...
Follow the "SIP Smartly" Indicator to do it Right.
We should do the SIP when others are fearful.
Do your research to pick the quality stock and add "SIP Smartly" Indicator and keep SIPping when you get a Buy alert for your stocks and sit back and enjoy. And let magic of compounding generate wealth for you.
Do your own research before investing or trading in any stock or indices.
Disclaimer:
This is not a financial, investment or trade advice. Its only for educational purpose.

microsofty buy 315.30 stop 310 target 328....13 pointsstrong upside from here 13 points
315 to 328++
my view only
educational purpose only

Microsoft🌟 buy above only 317.50 stop 315 tgt👇👇Tgt1 319.50
Tgt2 321.50
Tgt3 324++
My view upside only above 317.50
Educational purpose only


microsoft buy mode 332.50 stop 330 target 336 next 338.50++downside over ...
upside start from here 332.50 to 336 next 338.50++
my view only
educational purpose only

Microsoft sell Below 327.50 stop 331 tgt 325 next 322 next 316Sell mode start only below 327.50
All tgts possible....
Then my 2nd call active ..👇👇

Microsoft 🌟 sell below 319 only Downside👇👇Sell below only 319 stop loss 324.30
Target price 1 ⭐ 314.20
Target price 2 ⭐ 303
Above this levels possible 👍
