Is $MONAD Bullish? Technical Structure Suggests 10x PotentialPrice is Consolidating in a range-bound Structure Between Well-Defined Support and Resistance, indicating active Accumulation.
🟦 Demand Zone: $0.020–$0.022
🟥 Supply Zone: $0.025–$0.027
A Confirmed Breakout and close above Resistance Would signal a Bullish Structure Shift and Continuation of the Uptrend.
Trend Remains Bullish above $0.016, the recent swing low. A breakdown below invalidates the setup.
Based on Structure and Expansion Potential, 10x Upside is possible in a Strong Altseason.
Volatility remains High, Risk Management is Mandatory.
NFA & DYOR
What traders are saying

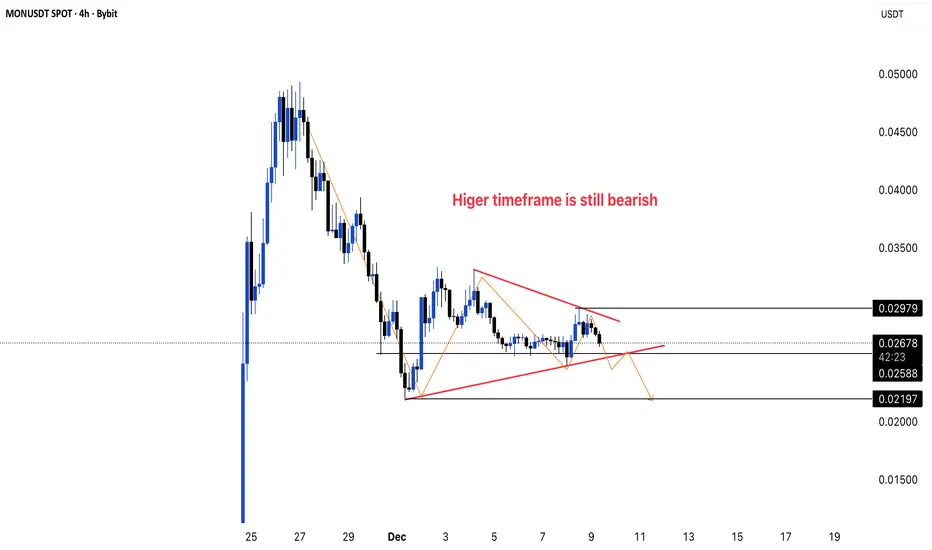
MONUSDT BEARISH FLAG ?🔥 1. Why This Chart Matters Now
MONUSDT 1H is compressing inside a wedge while the higher timeframe remains bearish.
This next break from consolidation could decide whether we get one more leg down or a sharp short-term squeeze.
📌 2. Pattern Overview
Price is trading inside a contracting wedge / triangle after a strong sell-off.
Sellers are defending lower highs, buyers are holding slightly higher lows – classic compression before a larger move.
In a bearish higher-timeframe context, this pattern often acts as a continuation, where liquidity builds on both sides and one strong move clears trapped traders.
📉 3. Key Levels
Support
0.0259–0.0258 – Mid-range support inside the wedge; if lost, consolidation turns into distribution.
0.0220–0.02197 – Major range low / demand. A break here opens room towards the 0.0200 liquidity pocket.
Resistance
0.0275–0.0280 – Wedge resistance and local lower-high zone where sellers have been active.
0.0298–0.0300 – Top of the box / key supply. Reclaiming this would start to challenge the broader bearish structure.
📈 4. Market Outlook
Bias: Tilted bearish while price trades below 0.0298–0.0300 and under wedge resistance.
Momentum shift: A clean 1H close above 0.0298 with follow-through and acceptance would be the first sign that buyers are taking control.
Smart money view: Institutions are likely waiting either for
a stop-hunt above 0.028–0.030 to reload shorts, or
a decisive breakdown below 0.0259 to add to positions in the direction of the higher-timeframe trend.
🧭 5. Trade Scenarios
🟢 Bullish Scenario
Entry trigger: 1H candle close above 0.0298, followed by a successful retest of 0.0298–0.0290 as support.
First target: 0.0320
Second target: 0.0350
Reasoning: A confirmed breakout above wedge resistance and key supply forces shorts to cover and attracts breakout buyers, creating a squeeze higher.
🔻 Bearish Scenario
Breakdown trigger: 1H close below 0.0259 and wedge support, or a retest of 0.0259 from below that gets rejected.
Target: First into 0.0220–0.02197, with possible extension towards 0.0200 if selling accelerates.
Why: A breakdown confirms the wedge as a bearish continuation pattern, with late buyers trapped and exiting into a move aligned with the higher-timeframe downtrend.
⚠️ 6. Final Note
Don’t chase every wick inside this wedge – wait for a clear candle close and retest before committing risk.
If you want more structured chart breakdowns like this, follow me on TradingView for daily, multi-timeframe analysis.