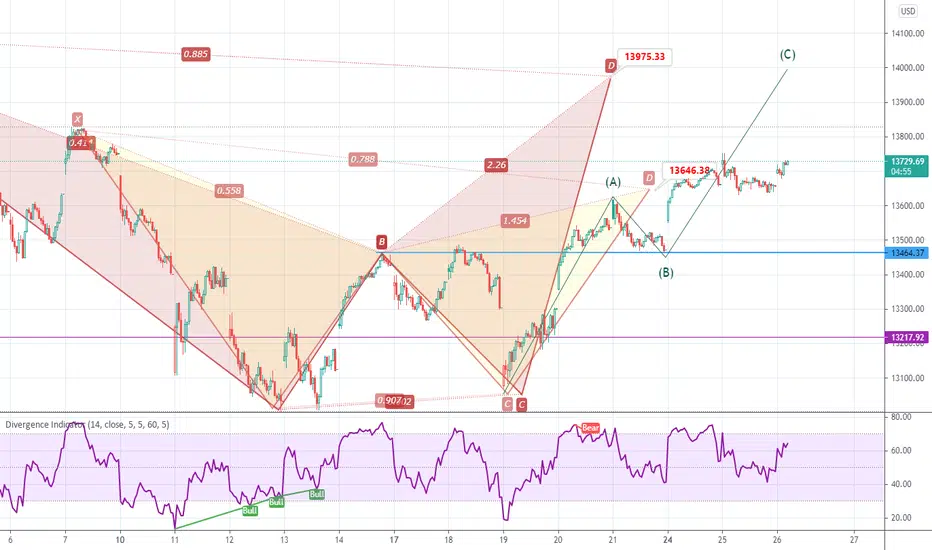
IXIC (June 15, 2021) SignalsCould be an end of Bull Run?
Indicators are Recommending the Price Action to move Down.
IXIC is getting extreme momentum which is too dangerous for Nasdaq at this level.
Sudden Increase in Volume, Volatility, Momentum, Liquidity is dangerous for NASAQ health.
RSI is Almost at an Overbought level.
Stochastic RSI is at Overbought Level.
CCI is on its way ahead to crack the overbought level.
Extremely Bearish Strength for June 15, 2021. NASDAQ:IXIC
Expecting a 53 Points Down from the Opening.
Thanks for using your Valuable time. Leave a like which helps me to do better. Follow me for Daily Signals,
Get updates on, FOREX, Stocks, INDICES, Crypto, #--CFD's to be expected soon. (Share to your Market Friends)
Trade ideas

NASDAQ COMPOSITE (Signals) [June 14]IXIC to the Ground
IXIC is making a Momentum to maintain the Volatility
Candle Stick patterns shows that there are more buyers in the market. Large Body Candles.
There are some levels marked in the chart.
These levels are considered as Pivot Points and S&R.
14,072 and 14,009 and 14,016 and 14,048. The Crucial Levels for June 14 mark it on your chart.
The Overall Strength is Bearish.
Expecting a +17 Points Up from the Opening and -39 Points Down from +17 Points.
Thanks for using your Valuable time. Leave a like which helps me to do better. Follow me for Daily Signals,
Get updates on, FOREX, Stocks, INDICES, Crypto, #--CFD's to be expected soon. (Share to your Market Friends)


WILL NASDAQ fall lead to Indian index correction ? NASDAQ after re-testing its ATH countered a profit booking in the last week, Indian markets also remained volatile looking for directions from global markets
Now that NASDAQ has broken its trend line, support zone and expected to fall at least for a couple of days, How would Indian markets react
the movement of NASDAQ happens outside of Indian trading hours, so any downside in NASDAQ is usually factored as GAP DOWNS or GAP UPS.
GAP DOWN expected, and one more GAP DOWN Tomorrow can't be ruled out looking at price action of NASDAQ
This is curtailed week for Indian trading, so expect volatility and premiums would be vaporised like anything if you are an option buyer and caught on the wrong side.
selling NIFTY OTM CE would be a safer option
Trade Safe

nasdaq clearly broken H&S necklinenasdaq broken from the neckline of H&S clearly and indicating weakness.
with this index have broken long term rising channel.

Nasdaq - CautionH&S chart on the daily charts..If it breaks in the next day or 2 it could hurt our markets too. This was the index which was leading American markets over the last couple years with the FAANG stocks + Microsoft + Tesla.
Watch this space closely to dictate the direction of global markets. So far the Dow Jones is holding its own and out performing the Nasdaq but we need to keep a close eye on this space.

#NASDAQ#NASDAQ Index :-
Weekly ( 22-26 Feb 2021 ) Important Sup & Res Levels.
we have shared this week's #NASDAQ Index important levels where it can take a support and face resistance.

Nasdaq CompositeTVC:IXIC Should keep surviving above the pink line.. .Below that e, it may be teased by bears.


Nasdaq Composite IXIC Analysis 04-12-2020Nasdaq Composite INDEXNASDAQ: .IXIC Looking Bearish Go For Short-Selling

Nasdaq Composite Analysis 03/12/2020Nasdaq Composite INDEXNASDAQ: .IXIC Looking Bullish Go For Buy Trade

Nasdaq Composite Analysis :- 02-12-2020Nasdaq Composite INDEXNASDAQ: .IXIC Looking Bearish on 02-12-2020 Go For Short-Selling.


US market analysis
//@version=2
//supertrend strategy multitimeframe analysis...
strategy("TTK TOOL", overlay=true, default_qty_value=100)
res = input(title="Main SuperTrend Time Frame", type=resolution, defval="720")
Factor=input(2, minval=1,maxval = 100)
Pd=input(10, minval=1,maxval = 100)
tp = input(500,title="Take Profit")
sl = input(400,title="Stop Loss")
Up=hl2-(Factor*atr(Pd))
Dn=hl2+(Factor*atr(Pd))
MUp=security(tickerid,res,hl2-(Factor*atr(Pd)))
MDn=security(tickerid,res,hl2+(Factor*atr(Pd)))
Mclose=security(tickerid,res,close)
TrendUp=close >TrendUp ? max(Up,TrendUp ) : Up
TrendDown=close MTrendUp ? max(MUp,MTrendUp ) : MUp
MTrendDown=Mclose TrendDown ? 1: close< TrendUp ? -1: nz(Trend ,1)
Tsl = Trend==1? TrendUp: TrendDown
MTrend = Mclose > MTrendDown ? 1: Mclose< MTrendUp ? -1: nz(MTrend ,1)
MTsl = MTrend==1? MTrendUp: MTrendDown
linecolor = Trend == 1 ? green: red
plot(Tsl, color = linecolor , style = line , linewidth = 4,title = "SuperTrend")
Mlinecolor = MTrend == 1 ? black : red
plot(MTsl, color = Mlinecolor , style = line , linewidth = 4,title = "Main SuperTrend")
plotshape(cross(close,Tsl) and close>Tsl , "Up Arrow", shape.triangleup,location.belowbar,black,0,0)
plotshape(cross(Tsl,close) and close

NASDAQ | Expecting a W pattern 260 points NASDAQ looks W pattern. Expecting 250+ points rally if worked good news for NIFTY gap up :)
CMP : 11490


NASDAQ next market change days finding - ContinuosOm Namah Shivay
Trying to find out in NASDAQ, If it is possible to get the next small/big trend change dates continuously by simple WDG logic. Stopped after some try. The results are amazing. Looks it is possible and accurary could be above 80. The finding of such things, manually, is time consuming. If can be automated, it should be worthy.
This is a continuation from previous 1-2 days work. If someone wants to know the previous work, can check the links.
Om Namah Shivay
Question : Who Am I ? Ans : I am a Soul. Question : Who are my parents ? Ans : He is the Supreme Soul, the most beautiful Shiva.


Nasdaq - Melt UPGot to be honest i didnt expect the Nasdaq to move the way it has during covid times..
But then thinking whats the max this excess liquidty can take it..my guess would be 10650. (Fibo resistance but also a major long term channel top)
So if the markets dont correct from here that would be the key key level at which my caution meter would be sky high..
Keep this on your watch list and watch this space as best you can...
No trade here but this might decide the direction of global markets going ahead..
Ps: Had posted the same chart yest but by mistake referred to it is DJI... #apologies.

Dow Jones - Melt upGot to be honest i didnt expect the DJI to move the way it has during covid times..
But then thinking whats the max this excess liquidty can take it..my guess would be 10650. (Fibo resistance but also a major long term channel top)
So if the markets dont correct from here that would be the key key level at which my caution meter would be sky high..
Keep this on your watch list and watch this space as best you can...
No trade here but this might decide the direction of global markets going ahead..
