Trend analysis for natural gas by happening Market Trend analysis for natural gas by happening Market !
9 may to 10 May!
NATGAS trade ideas

Natural Gas - Live Market Analysis
Please read the notes as mentioned on the chart.
4-18-24 4:25 AM
4-18-24 8:52 AM
4-18-24 1:18 PM
4-18-24 5:44 PM
4-18-24 10:11 PM
4-19-24 2:37 AM
11:59 p.m. candle was pivotal last night.
Disclaimer: I am not a registered analyst with any of the National or International agency and it is only for educational purposes. Please consult your financial advisor before making any decision. I will not be responsible for any of your profits or losses.
Thank you

Natural Gas - Live Market Analysis 15-04-2024
Please read the notes as mentioned on the chart. Time candles for today are
4-15-24 12:58 AM
4-15-24 5:24 AM
4-15-24 9:50 AM
4-15-24 2:17 PM (Pivotal)
4-15-24 6:43 PM
4-15-24 11:09 PM
Pivotal candle will decide the future course of action.
Disclaimer: I am not a registered analyst with any of the National/International Agency and it is only for educational purposes. Please consult your financial advisor before making any decision, I will not be responsible for any of your profits/losses.

Natural Gas - Live Market Analysis
Please read the notes as mentioned on the chart.
12:37 candle is pivotal.
Disclaimer: I am not a Registered Analyst with any of the National or International Agency and it is only for educational purposes. Please consult your financial advisor before making any decision.

Natural Gas - How to Trade - Live Market Analysis
Please read the notes as mentioned on the chart and act accordingly.
Disclaimer: I am not a registered analyst with any of the National/International agency and it is only for educational purpose. Please consult your financial advisor before making any decision.
Let you grow. May! I follow you.
Thank you

Natural Gas TechnicalNG is showing strength at weekly demand zone, if breaks 2.07 Daily SZ, will rally towards 2.8 quickly. My two cents

Natural Gas - How to trade tomorrow
Please read the notes as mentioned on the chart. Time candles for tomorrow are 4-8-24 9:10 AM (Pivotal)
4-8-24 1:36 PM
4-8-24 6:03 PM
4-8-24 10:29 PM
4-9-24 2:55 AM
Top most candle is pivotal and will decide the future trend in the evening session.
10:29 p.m. candle is pivotal for evening session.
Disclaimer: I am not a SEBI Registered Analyst. It is only for educational purposes. I will not be responsible for any of your profits or losses.
Thank you

Natural Gas - How to trade today - Live Market Analysis
Please read the notes on the chart.
Today's time candles are
4-4-24 7:31 AM
4-4-24 11:57 AM
4-4-24 4:24 PM (Pivotal) Going to decide the future trend
4-4-24 8:50 PM
4-5-24 1:16 AM
Disclaimer: I am not a registered analyst with any National/International Authority and it is only for the educational purposes. Please consult your financial advisor before making any decision. I will not be responsible for any of your profits/losses
Thank you

Natural Gas - How to trade on Monday
Please read the notes as mentioned on the chart. Time candles have also been mentioned on the chart out of them candle for 5:23 p.m. is pivotal which will decide the future trend.
Disclaimer: I am not a registered analyst with any of the National/ Internatonal agency and it is only for educational purposes. Please consult your financial advisor before making any decision. I will not be responsible for any of your profits/losses.
Thank you

Natural Gas - Live Market Analysis
Marked is an arrow and a faded circle on a candle so that it is visible to every one. This is the area where from swing started way back in 2020 and after analyzing years of data I have marked it but not shown for the purpose of ease of depiction.
Buy above it and forget but remember it can take another week to give you the results. Check points are high of 29th February 2024 and 18th March 2024.
Disclaimer: I am not a Registered Analyst with any of the National/International agency and it is only for educational purposes. Please consult your financial advisor before making any decision.
Thank you

Natural Gas - Live Market Analysis
Please read the notes as mentioned on the chart and act accordingly. Be ware of the Pivotal candle.
Disclaimer: I am not a registered analyst with any of the National or International agency and it is only for educational purposes. Please consult your financial advisor before making any decision. I will not be responsible for any of your profits or losses.

Natural Gas - Live Market update
Buy NG with Strick SL of 1.7990. Please do not put SL but keep in mind and if price goes below it immediately come out of the trade and reenter when it crosses 1.8. Target open. If price goes above high of 18th March 2024; do not worry at all.
Disclaimer: I am not a registered Analyst with any of the National/International agency and it is only for educational purpose. I will not be responsible for any of your profits/losses.

Natural Gas - How to trade on next working day
Please read the geometric presentation and notes on 1D Chart and act accordingly.
Disclaimer: I am not a SEBI Registered Analyst and it is only for educatonal purposes. PLease consult your financial advisor before making any decision. I will not be responsible for any of your profits/losses.
Let you grow. May! I follow you.
Thank you

Natural Gas - Live Market update
Please read the notes on the chart and act accordingly.
Adhere to the time candles.
This candle is pivotal and will decide the future trend. 3-22-24 8:51 AM
Disclaimer: I am not a SEBI Registered Analyst. Please consult your financial advisor before making any decision. I will not be responsible for any of your profits/losses. This is only for educational purposes.
Let you grow. May! I follow you.

Natural Gas - Open Market Analysis
Please read the notes as mentioned on the chart.
Time candles which will make waves today
3-21-24 6:14 AM
3-21-24 10:40 AM
3-21-24 3:06 PM (Pivotal)
3-21-24 7:33 PM
Out of the above 3:06 PM candle is pivotal and will decide future trend.
Disclaimer:
I am not a Registered Analyst with any of the National/International agency and it is only for educational purposes. Please consult your financial advisor before making any decision. I will not be responsible for any of your profits or losses.

Natural Gas - Bullish live market analysis
Presented is the Elliot wave structure of commodity concerned.
Bullish above 1.8 USD and 144 in INR.
Disclaimer:
I am not a registered analyst with any of the National/International agency. It is only for educational purposes.

Natural Gas - Live Market Analysis
Please read the notes as mentioned on the chart/
Time candles for today morning session are
3-19-24 12:59 AM
3-19-24 5:25 AM
3-19-24 9:51 AM (Pivotal) Buy above and sell below
3-19-24 2:18 PM
Disclaimer:
I am not a Registered Analyst with any of the National/International agency and it is only for educational purposes. Please consult your financial advisor before making any decision. I will not be responsible for any of your profits or losses.

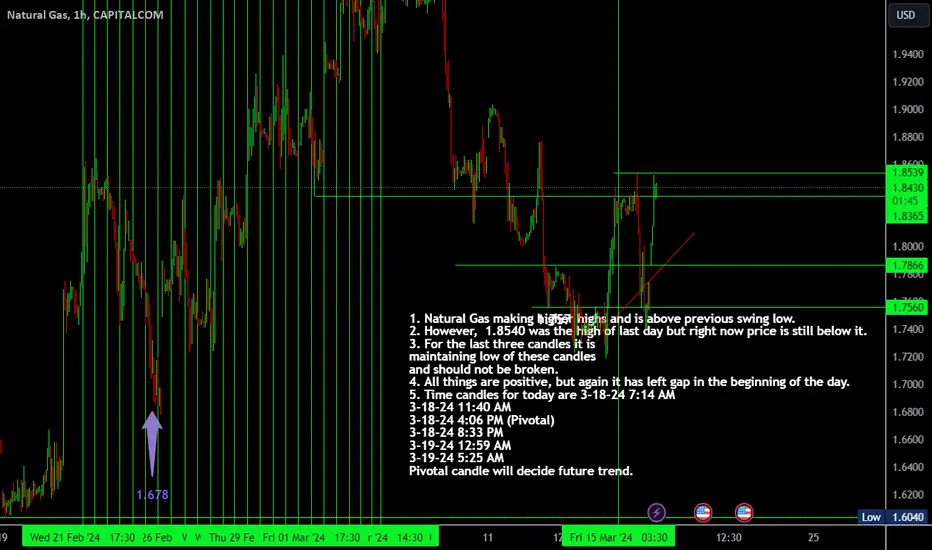
Natural Gas - Live Market Analysis1. Natural Gas making higher highs and is above previous swing low.
2. However, 1.8540 was the high of last day but right now price is still below it.
3. For the last three candles it is maintaining low of these candles and should not be broken.
4. All things are positive, but again it has left gap in the beginning of the day.
5. Time candles for today are 3-18-24 7:14 AM
3-18-24 11:40 AM
3-18-24 4:06 PM (Pivotal)
3-18-24 8:33 PM
3-19-24 12:59 AM
3-19-24 5:25 AM
Pivotal candle will decide future trend.
Conclusion: Previous day high should be broken and pivotal candle's high should be watche.
Disclaimer:
I am not a Registered Analyst with any of the National/International agency and it is only for educational purposes. Please consult your financial advisor before making any decision. I will not be responsible for any of your profits or losses.
Let you grow. May! I follow you.

#XNGUSD #NaturalGas update || 15 Mar
🕓TimeFrame: 1 hour
Technically: Natural gas found support at 1.740 and rose post-inventory data. Currently moving above the 100EMA, indicating a positive outlook in the 1-hour timeframe. If manage to sustain above 1.889 we will see further upside levels
As per the news:
🔸Nat-gas prices surged after a larger-than-expected inventory drawdown of -9 bcf.
🔸Cooler weather forecasts and short-covering also contributed to the price rally.
🔸However, abundant supplies and reduced LNG exports due to a terminal closure in Texas are still pressuring prices

Natural Gas update - Bullish
As informed earlier, Natural Gas has turned bullish above 1.792 marked by the horizontal line. Do not short Natural Gas any more.
Time candles for tomorrow are
3-15-24 8:14 AM
3-15-24 12:40 PM
3-15-24 5:06 PM (Pivotal) - Will decide the future trend for the commodity.
3-15-24 9:33 PM
3-16-24 1:59 AM
Disclaimer:
I am not a Registered Analyst with any of the National/International agency and it is only for educational purposes. Please consult your financial advisor before making any decision. I will not be responsible for any of your profits or losses.

Natural Gas - update
Please read the notes on the chart. It is in the consolidation mode and will be fully bullish above 1.792. So, have patience and watch for atleast 8 hours today and reversal from 18th March 2024 only.
Disclaimer: I am not a SEBI registered analyst with any of the National/international agency and it is only for educational purposes. Please consult your financial advisor before making any decision. I will not be responsible for any of your profits or losses.

Is Natural gas stagging reversal? 1-2 1-2 wave patterns seen and gap up opening given today. The gap need to sustain and it shouldn't break invalidation level to continue upside momentum.
Disclaimer: There is no guarantee of profits nor exceptions from losses in world of stock Market.
FnO Trading is Highly Risky business you can loose more that your trading capital.
This chart is solely the personal views of my research and development of market it can go wrong as well.
Do your own study or ask your financial advisors before investing/trading blindly.
