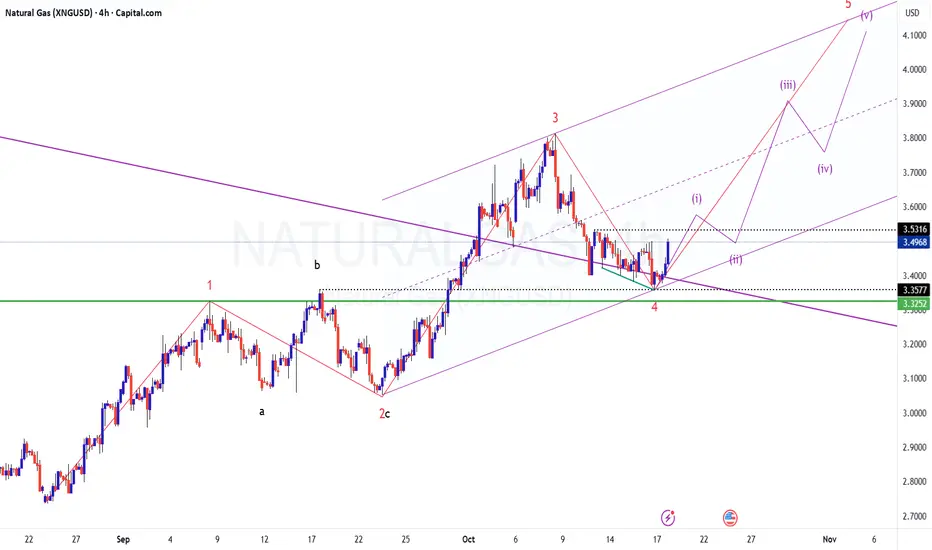
NATURALGAS - Getting Ready for the next impulse?
CMP: 3.4970
TF: 4 Hours
The script seems to have ended it's correction and ready to move up higher.
wave counts are marked herein for better understanding.
Break of 3.5320 will be the initial confirmation/validation.
This view becomes invalid if we start to trade below 3.3252
On Pitchfork,
NG Price (FOREXCOM) Outlook: Potential Drop Toward 3.400–3.300Natural gas surged to 3.682 (FOREXCOM CFD), supported by yesterday’s inventory drop and the short-term cold weather forecast.
However, in the short term, if weather conditions normalize, we may see downward pressure on NG prices, with potential retracements to 3.400 and further to 3.300 levels.
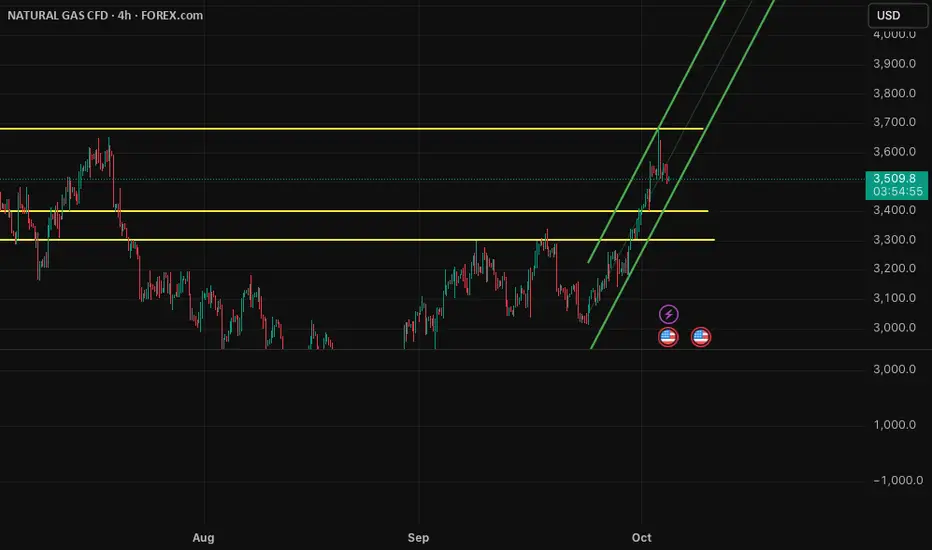
The Euphoria Before the FallThe recent price action in Natural Gas is a textbook example of short-term optimism divorced from underlying fundamentals. While traders celebrate minor weather-related demand forecasts, the broader structure tells a different story — one of excess positioning and complacency.
1. Technical Overexte
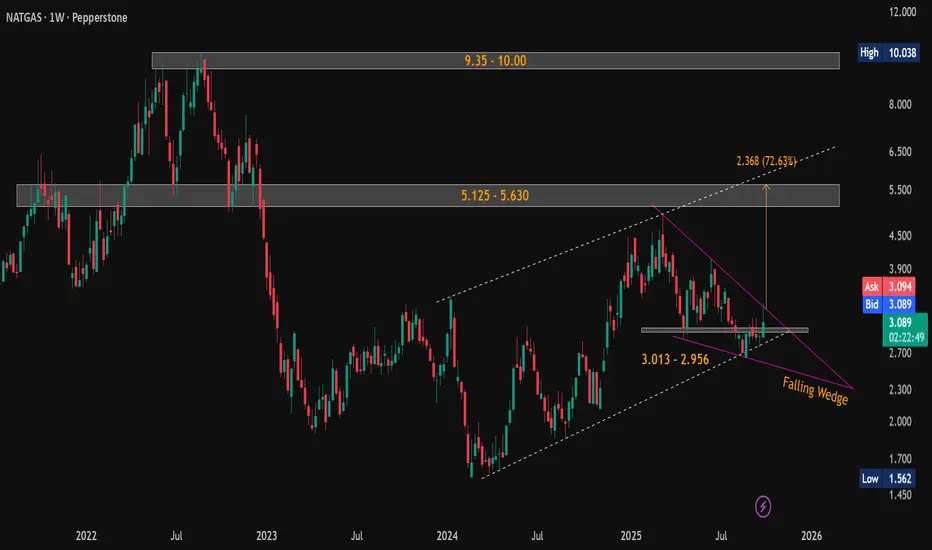
Natural Gas (NG) Weekly Breakout Brewing — 80% Upside Potential!Current Price: $3.090
Technical View (Weekly Timeframe):
Natural Gas has formed a classic falling wedge pattern on the weekly chart - a strong bullish reversal setup. Price action is currently on the verge of breakout , with increasing volume and narrowing range suggesting imminent movement.
Natural Gas (15M) Buy Setup
Price is showing a strong support around 3.190 zone after the recent pullback.
I expect a bounce towards 3.330 (previous resistance).
✅ Entry: Near 3.190 – 3.200
🎯 Target: 3.330

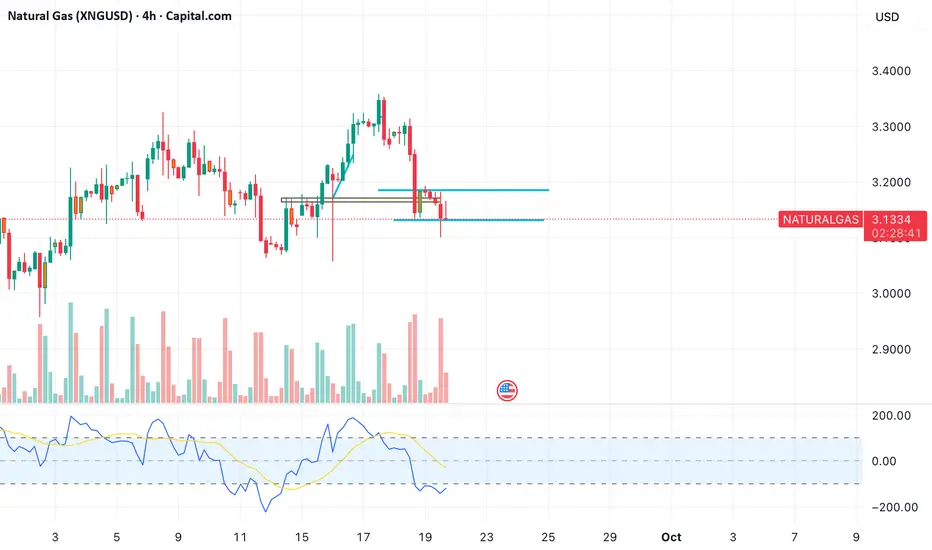
Gas fuelling in for an expiry rally!
Observations:
• Price broke down below the horizontal support zone (~$3.12–$3.13), but the candles show strong rejection wicks which indicats sign of bear trap.
• Bears tried to push below support, but volume did not confirm sustained selling.
• RSI (bottom panel) is in a deeply oversold region

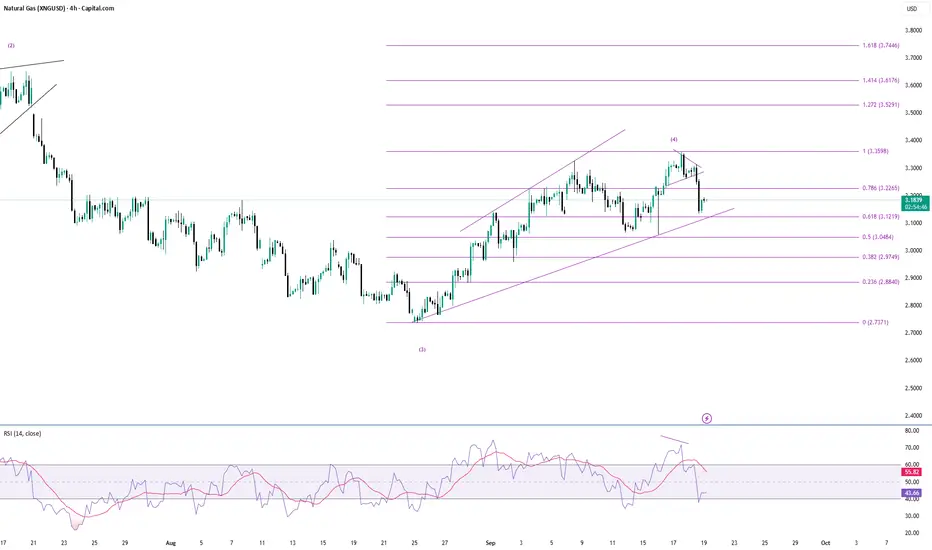
Natural Gas another leg of correction?Looks like natural gas is taking support at the 0.618 level of the previous swing. If this level (3.1228) is broken, we can expect a big move on the down side.
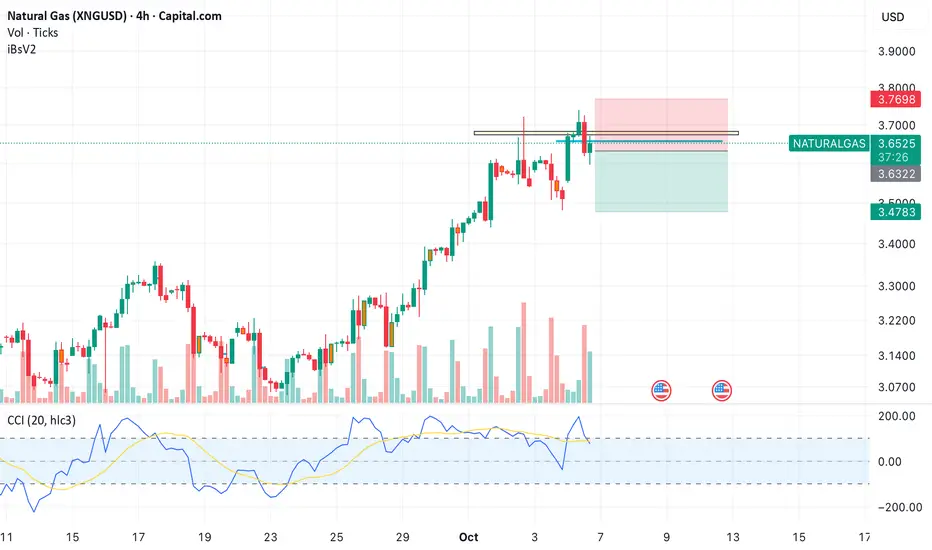
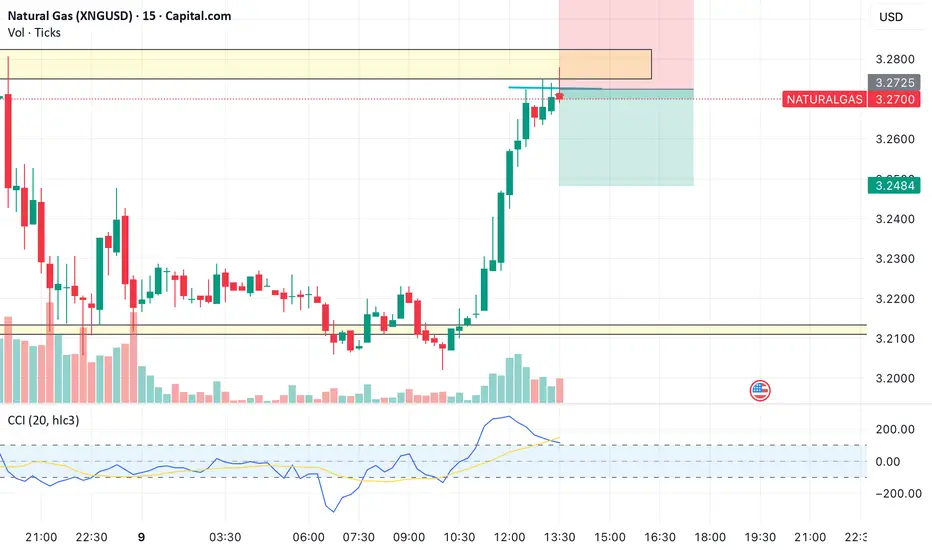
Scalp Shorting opportunity in NG (Risk Appetite High)
• Price: $3.2725 is retesting previous swing high resistance zone (highlighted box).
• Candles: Strong impulsive green candles led price into resistance.
• Volume: Spike during the breakout push, now slowing showing possible exhaustion.
• CCI (20): Was above +100 (overbought) and now rolling do
NG : A FALLING WEDGE BREAKOUT WITH 1:7.5 RR• NG was in downtrend and in a falling wedge for last 2 months
• Today It successfully retest the upper trend line of the wedge and confirming the BO
• A trade with 1:7.5 RR
• SL and the T1 and T2 mentioned in chart.
• Educational purpose only. Happy trading.

See all ideas
Displays a symbol's price movements over previous years to identify recurring trends.