
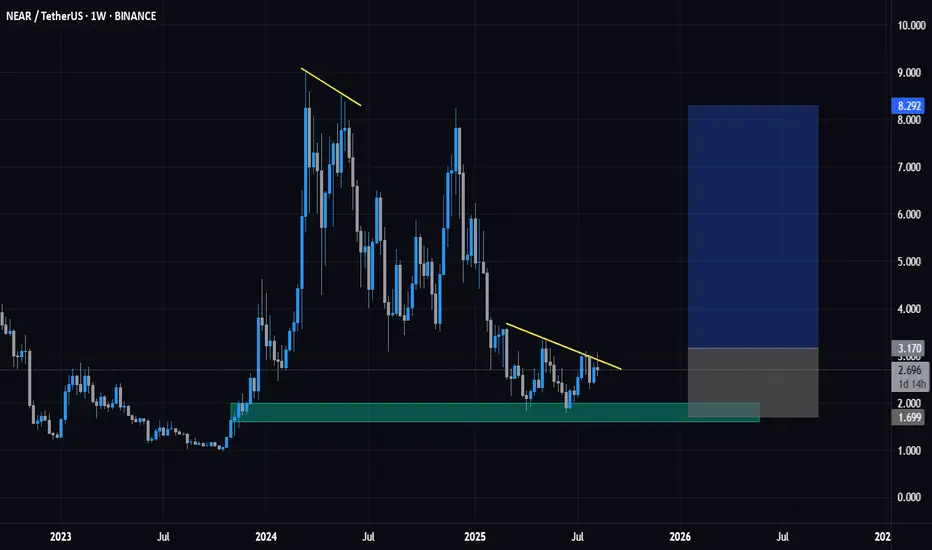
Near Coin ! Weekly Order block + Liquidity sweep ! BreakoutMarket is sitting at a Weekly Order Block
Recently swept liquidity → now showing slow selling pressure
Price is forming a double bottom structure
Best approach:
Enter in 2 parts → 40% position at breakout of Levels-3.200 USDT
60% position on retest
SL - 1.795
Wait for confirmation before ad
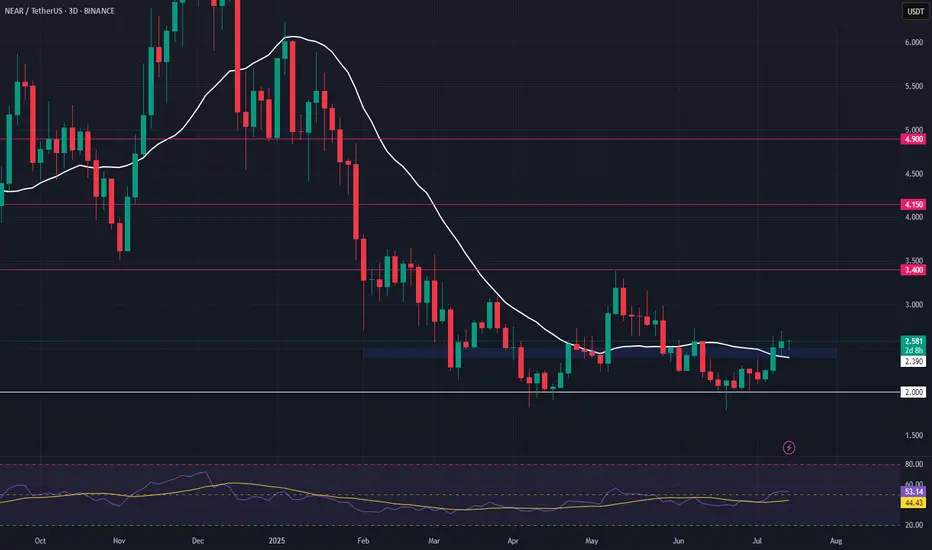
NEAR – High-Timeframe Double Bottom & Bullish DivergenceNEAR is showing strong signs of support, forming a high-timeframe double bottom with bullish divergence after a clean sweep of the $1.80 level. Price has now reclaimed the 20-day SMA, adding confidence to the setup.
📌 Trade Setup:
• Entry Zone: $2.40 – $2.50
• Take Profit Targets:
o 🥇 $3.40
o 🥈 $4
If $NEAR hits $50, will you regret not buying at $2?🚨 NEAR/USDT Weekly Chart Update 🚨
NEAR has bounced from a strong weekly support level inside a multi-year triangle. This bounce looks powerful and could be the start of a major move.
🔹 Current Price: $2.51
🔹 Entry Zone: $2.00–$2.50
🔻 Invalidation Level: Below $1.80 (if price drops here, the setup

Big Triangle Forming on $NEAR — Massive Breakout Ahead!Big Triangle Forming on CBOE:NEAR — Massive Breakout Ahead!
CBOE:NEAR is showing strong bullish structure on the HTF – it's forming a large symmetrical triangle pattern, which often signals an explosive breakout move.
Technical Analysis Overview:
▶️ Best Accumulation Zone: $2.90 – $2.10
▶️ Tar

Three day setupSimilar price action. Did not go to day low. Sometimes you need to have patience and be willing totake profits when it doesn't go all the way

Free Ca$h Friday Day 1 false break out at the high of the day
Day 2 extends the range
Day 3 pump and dumps set up. Entry on 15m close under Ema. One bar stop. Target range expansion. Position management.
Free Ca NYSE:H Friday

near longNEAR is the chain abstraction stack, empowering builders to create apps that scale to billions of users and across all blockchains.

Near Protocol Swing Update - Near Protocol is currently trading at 5.3$
- Near printed 52% from my previous call out and now I believe the time has come when we can see it retracing back to the Bullish Fair Value Gap drawn
- The pump and the move were quite impulsive and if you didn't catch it at its base there is no point

Near Protocol Swing Trade Setup- Near Protocol is currently trading at 4.5$
- Near can soon purge 6$ and above if you have a decent time horizon
- Near Protocol can present a very good entry if we see it retracing back to 4$
- Bullish Oblock present at 4-4.1$
- Refine your entry location and see the change in your trading
-

See all ideas
Summarizing what the indicators are suggesting.
Oscillators
Neutral
SellBuy
Strong sellStrong buy
Strong sellSellNeutralBuyStrong buy
Oscillators
Neutral
SellBuy
Strong sellStrong buy
Strong sellSellNeutralBuyStrong buy
Summary
Neutral
SellBuy
Strong sellStrong buy
Strong sellSellNeutralBuyStrong buy
Summary
Neutral
SellBuy
Strong sellStrong buy
Strong sellSellNeutralBuyStrong buy
Summary
Neutral
SellBuy
Strong sellStrong buy
Strong sellSellNeutralBuyStrong buy
Moving Averages
Neutral
SellBuy
Strong sellStrong buy
Strong sellSellNeutralBuyStrong buy
Moving Averages
Neutral
SellBuy
Strong sellStrong buy
Strong sellSellNeutralBuyStrong buy
Displays a symbol's price movements over previous years to identify recurring trends.
Curated watchlists where NEARUST.P is featured.

Gen 3 crypto: A new day dawns…
25 No. of Symbols

Smart contracts: Make the smart decision
36 No. of Symbols
See all sparks