NG : A FALLING WEDGE BREAKOUT WITH 1:7.5 RR• NG was in downtrend and in a falling wedge for last 2 months
• Today It successfully retest the upper trend line of the wedge and confirming the BO
• A trade with 1:7.5 RR
• SL and the T1 and T2 mentioned in chart.
• Educational purpose only. Happy trading.
NGAS.F trade ideas

Natural gas analysis Monthly Time frameNatural gas markets are influenced by a complex interplay of supply, demand, weather, geopolitical events, and technical factors. Below is a concise analysis based on recent trends and data as of August 24, 2025, covering key aspects of the natural gas market
Price Trends and Market Dynamics
Spot and Futures Prices: The Henry Hub spot price recently fell from $2.92/MMBtu to $2.81/MMBtu, and the September 2025 NYMEX futures contract dropped from $2.828/MMBtu to $2.752/MMBtu. The 12-month futures strip (September 2025–August 2026) averaged $3.501/MMBtu, reflecting a bearish near-term outlook but expectations of tighter balances later.
Supply and DemandSupply: U.S. natural gas production has risen, with a 3% increase in marketed production in 2025, particularly from the Permian (2 Bcf/d), Haynesville, and Appalachia (0.9 Bcf/d each). However, production is expected to stabilize in 2026 as associated gas from oil declines.
Storage: U.S. storage inventories are projected to reach 3,927 Bcf by October 31, 2025, 174 Bcf above the five-year average, due to higher-than-average injections (20% above the five-year average). This surplus is pressuring prices downward.
Demand: Cool weather forecasts for August 2025, potentially the coolest in 50 years, have reduced demand, contributing to bearish price sentiment. However, LNG exports are rebounding, with Freeport LNG operations resuming, providing some support.
LNG Exports: Maintenance at U.S. LNG terminals earlier in 2025 reduced exports, but recovery and new contracts (e.g., ConocoPhillips’ 4 Mt/y from Port Arthur LNG Phase 2) signal growing export potential.
Technical AnalysisBearish Signals: Technical indicators suggest a "strong sell" for Natural Gas Futures across multiple timeframes (daily, weekly, monthly), driven by a head-and-shoulders pattern with prices breaking below the $3.050 neckline, targeting $2.220–$2.000.
Indicators: RSI, MACD, and stochastic oscillators indicate oversold conditions, but negative momentum persists below key resistance levels like $3.100–$3.320. Pivot points and moving averages reinforce bearish trends, with potential support at $2.200.
Geopolitical and Structural FactorsEurope: The 2022–2023 Russian supply shock shifted Europe to rely on LNG, increasing price volatility. Market reforms have boosted trading volumes (7,300 bcm in 2024, 15x demand), but derivatives trading by physical players dominates, limiting speculative impacts.
Weather Impact: Cooling in the Midwest and Northeast (highs of 60s–80s°F) contrasts with hotter conditions elsewhere (80s–100s°F), driving regional demand differences. Weather models (ECMWF, GFS) forecast continued impacts on heating and cooling degree days, affecting prices.
Energy Transition: Natural gas is increasingly vital for electricity generation as coal phases out, linking gas and power markets and amplifying price sensitivity to weather and demand.
Forecast and OutlookShort-Term (1–6 Weeks): Bearish due to high storage, weak demand from cool weather, and technical indicators. Prices may test support at $2.220–$2.080,
Long-Term: Growing U.S. electricity demand (31% over 15 years) and constrained global supply (e.g., limited OPEC spare capacity) suggest bullish prospects for natural gas as a reliable fuel.
Trading ConsiderationsRisks: High volatility, weather-driven demand shifts, and geopolitical uncertainties (e.g., Russia-Ukraine tensions) pose risks.
Strategies: Traders may consider short positions targeting $2.80, but oversold conditions suggest caution for potential reversals. Long-term investors might accumulate near support zones ($2.220–$2.080) for 2026 upside.
Data Tools: Monitor EIA storage reports, weather forecasts (NatGasWeather.com), and technical indicators (RSI, MACD) for real-time insights.
Note: Trading involves high risks, and past performance does not guarantee future results. Always conduct your own research.
Gas shorting Opportunity again Initiating a short position on Natural Gas (XNGUSD) at $2.919 after a clean breakdown from the rising trendline. Price has slipped below intraday support and is now testing the 50-period anchored VWAP.
Entry: $2.919
Stop Loss: $2.931 (above resistance zone)
Target: $2.883 (near next support)
Bearish momentum building as buyers fail to reclaim trendline. Trade sized for controlled risk.

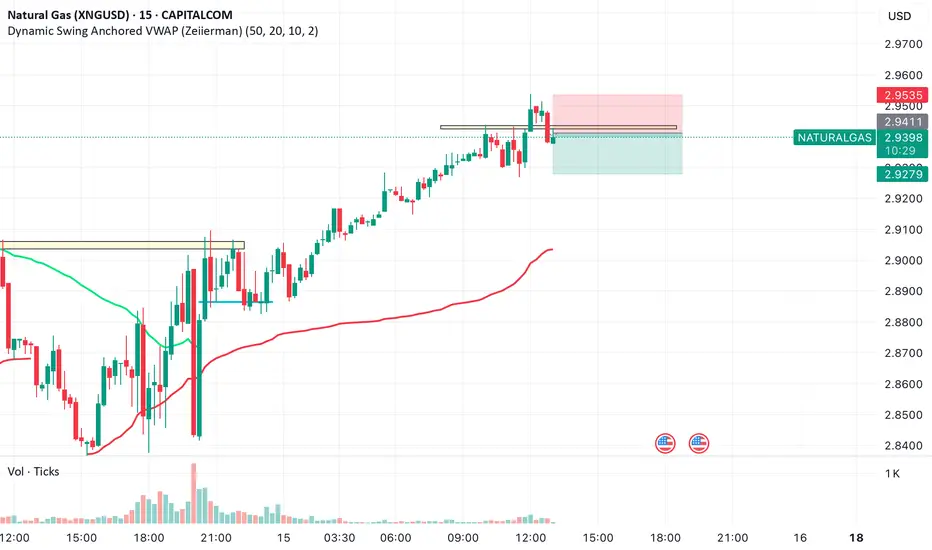
Scalp in Gas
Scalp Short Plan:
• Entry: Below 2.9390 (confirmation candle close)
• Stop Loss: 2.9465 (above the rejection wick)
• Target 1: 2.9320
• Target 2: 2.9280 (close scalp here unless strong momentum continues)
Since this is a scalp, the idea is quick in-and-out, preferably within 3–5 candles, to avoid getting caught if bulls defend the VWAP which is still far.
Natural Gas Poised for Upside — Target 3.303Natural gas is showing strong buying momentum in the daily trend, and we expect a potential upside in the coming sessions with a short-term target of 3.303."
NATGAS:SELL?1. Last week body low broke.
2. Last week low not yet broken.
3. Keep current week high as SL and make entry
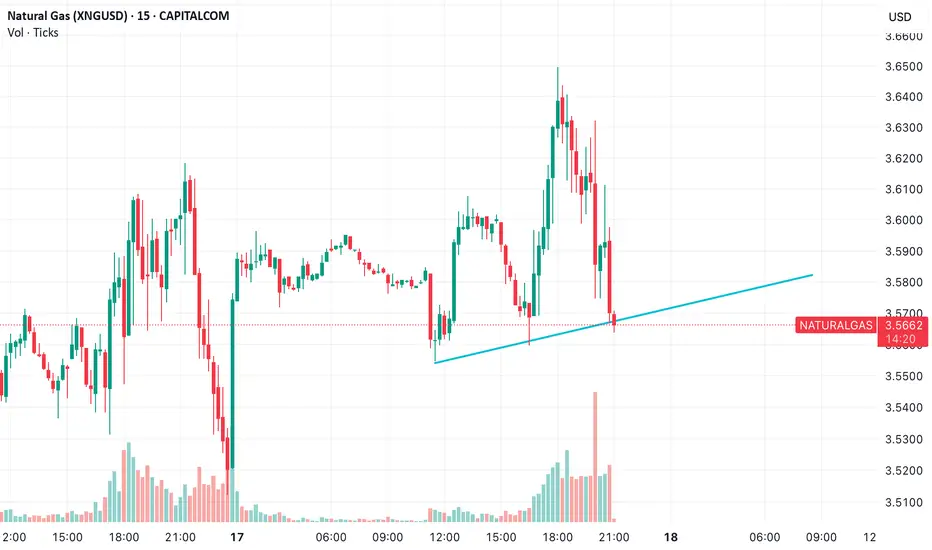
Gas in the Tank
Trade View: Natural Gas (XNGUSD) — Buy
CMP: $3.5722
Stop Loss: $3.51
Target 1: $3.68
Target 2: $3.74
Duration: 3–5 sessions
Risk–Reward: ~1:2
Rationale
1. Price Structure — Trendline Respect
Natural Gas is respecting a rising trendline with a clear series of higher lows on the 15-min chart. These are not fluke bounces — they are coordinated pullbacks with rising volume toward the end, suggesting smart money accumulation. THe market respects levels when there’s underlying belief in the story, not just chart patterns. Here, price isn’t violating trendlines despite volatility.
2. Macro Tailwinds
• US heatwave in key regions like Texas and California is expected to increase demand for power generation GENERALLY a bullish driver for NG due to AC loads and cooling demand.
• Inventories have been tight with draws exceeding expectations in recent weeks (EIA data). Markets are slowly pricing in tighter forward supply.
• Geopolitics in Russia/Ukraine and LNG export updates continue to keep upside optionality alive.
3. Positioning & Sentiment
• Sentiment is still mixed, with many retail participants shorting around resistance. This creates the perfect fuel for a short squeeze if price pushes above $3.60 again.
• Commitment of Traders (CoT) data shows moderate long build-up from managed money, not extreme — indicating a measured rally, not frothy euphoria.
“If the story is good and the price structure is right, you don’t wait for perfection ,you size the trade sensibly and ride the wave." This is one such setup. We’re not trying to call the bottom we’re simply stepping in where the downside risk is limited, and the narrative has legs.

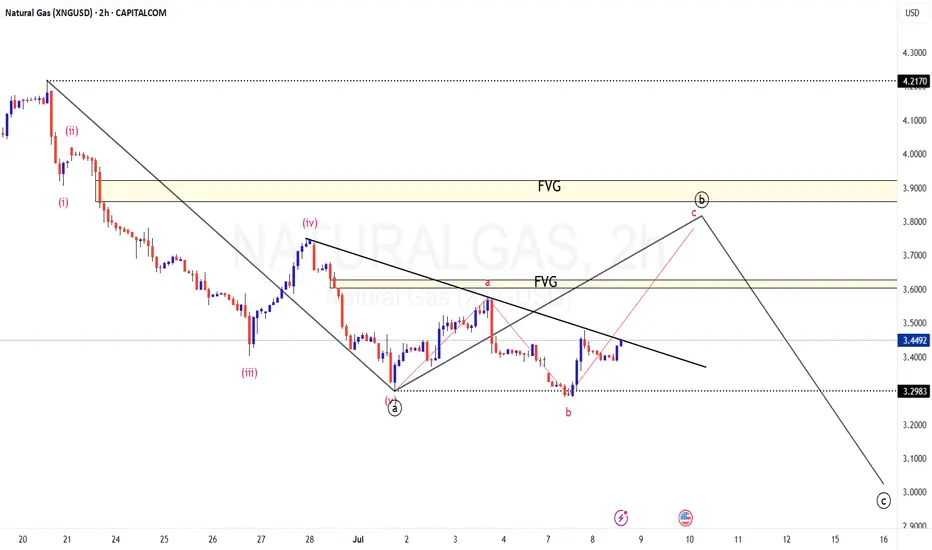
NATURALGAS - Corrective Rise in action?
TF: 120 minutes
Primary View is that the first leg of correction from 4.2170 has ended at 3.2983 in a 5 wave impulse on the downside and the price is moving higher (in corrective rise) to complete the B wave.
Internal counts are marked in this chart.
The ALT view is that, the A wave isn't complete yet and we are at the last leg of the A wave (by forming an abcde diagonal) and make one more low and then move up (This view negates if we trade above 3.5745)
Chart for this ALT view is here
In either case, A FVG (Fair Value GAP) is left at 3.9 and the price could potentially test that zone before resuming the move on the downside.
For the Primary view (Bullish bias C of B in play), SL is at 3.386
Disclaimer: I am not a SEBI registered Analyst and this is not a trading advise. Views are personal and for educational purpose only. Please consult your Financial Advisor for any investment decisions. Please consider my views only to get a different perspective (FOR or AGAINST your views). Please don't trade FNO based on my views. If you like my analysis and learnt something from it, please give a BOOST. Feel free to express your thoughts and questions in the comments section.
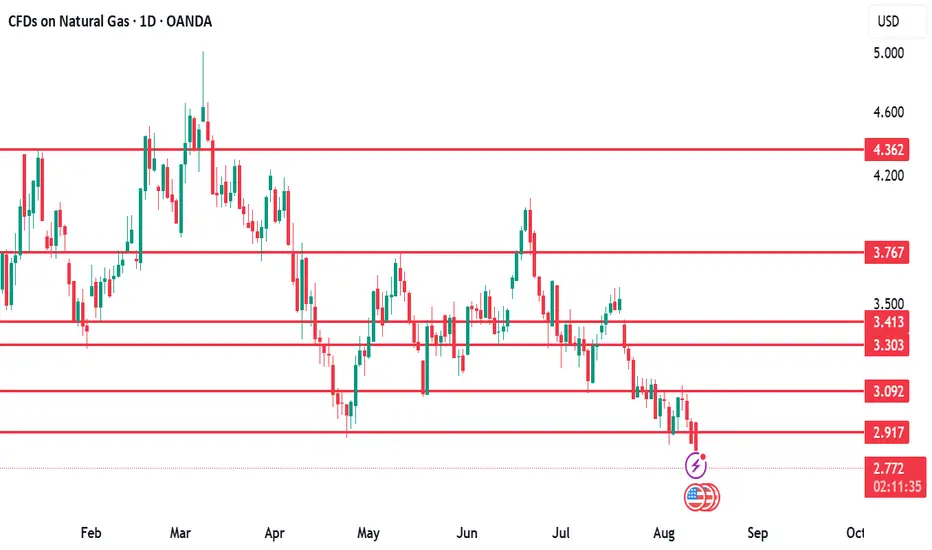
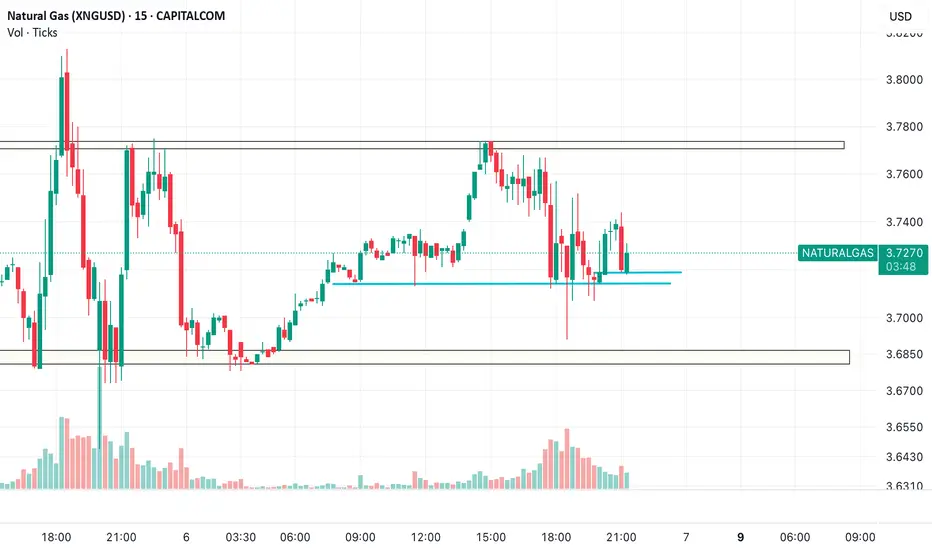
Natural Gas CFDs! Natural gas looks to be in a consolidation zone for now and the support and resistances have been drawn out on the above chart! Please feel free to correct me if I am wrong!
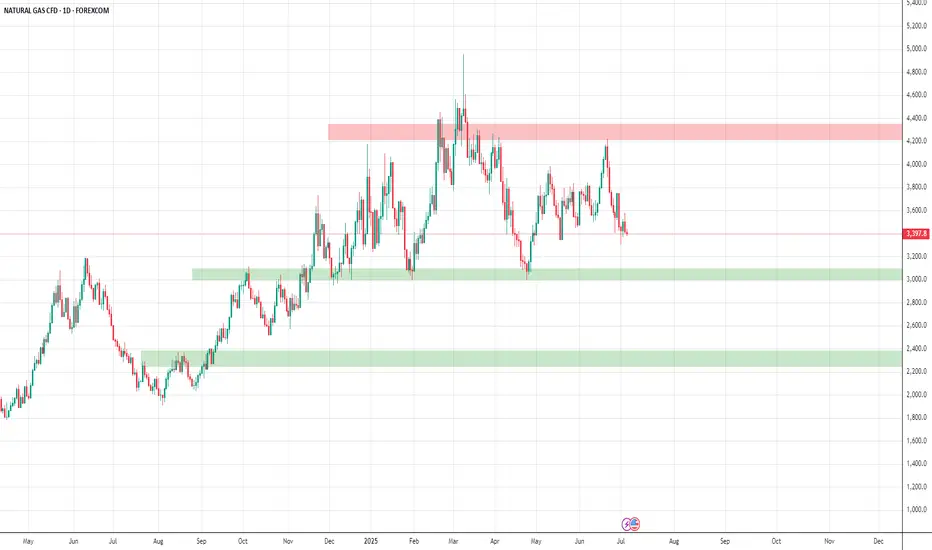
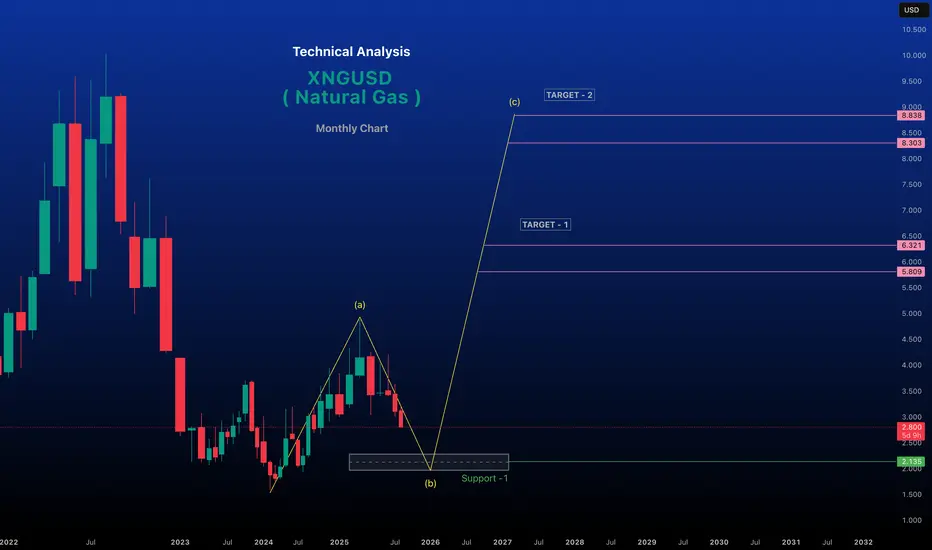
XNGUSD / NATURAL GAS / NG MONTHLY ANALYSIS 01-JUL-2025 @ 3.39LTP: 3.39
Supports: 3.045/2.89/1.93/1.528
Res: 4.217/4.707
As long as 3.045/2.89 holds support, we can see 4.5 again and further 4.75-5.12
Ultimate targets: 5.64/6.119-6.73
Extensions: 7.7-8.7-11.64

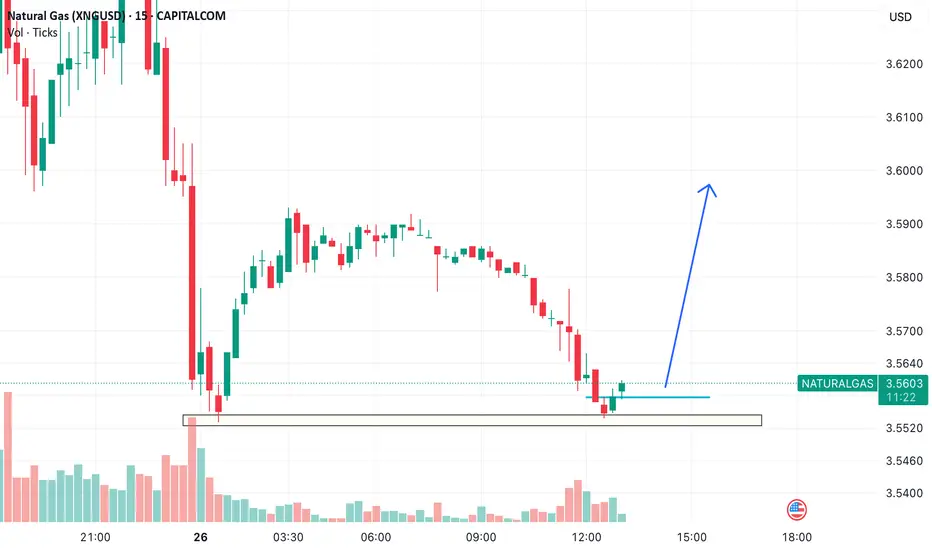
When the Market Yawns at a Breakdown — It’s Time to Look? Bullish Positional Setup Emerging
Despite relentless downward pressure, Natural Gas has landed into a previous demand pocket, holding the lows with surgical precision. A textbook case of seller exhaustion paired with invisible buying interest is unfolding on the 15-minute chart.
⸻
Structure Observation:
• Rejection from Key Demand Zone: The $3.55–$3.545 range has been tested twice and is being defended with volume.
• Volume Divergence: Notice the increasing red bars met with dry-up in follow-through selling — indicating distribution is likely over.
• Liquidity Sweep Setup: We’ve likely witnessed a liquidity grab under the prior support zone, shaking out weak hands before a move higher.
• Tight Accumulation: Price is stabilizing in a tight band — a typical precursor to vertical expansion if sustained above $3.56.
• Micro Timeframe Reversal: Subtle shift in market character. From lower highs/lows to possible higher low confirmation here.
⸻
The Trade – Stealthy Long
• Entry Zone: $3.56–$3.565 (as price reclaims structure)
• Stop Loss: Below $3.542 (just under demand)
• Target 1: $3.60 (supply shelf)
• Target 2: $3.625–$3.63 (gap-fill zone + fib confluence)
• Risk-Reward: ~1:2.5 to 1:3 — excellent reward-to-risk if the zone holds
⸻
This is the kind of setup where the market doesn’t scream; it whispers. The price doesn’t need to show fireworks — it just needs to stop bleeding, consolidate, and start climbing while everyone’s looking elsewhere. If this isn’t smart money accumulation, it’s doing a very good job pretending to be.
This is not about catching the bottom. It’s about understanding when the odds shift quietly in your favor.
⸻
Let it play out.
Let others react late.
You just needed to observe — and position early.
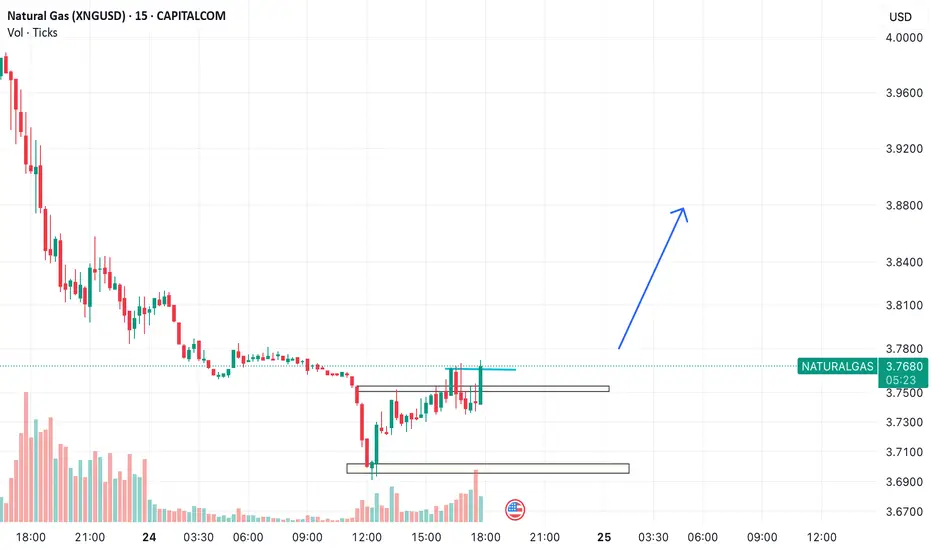
Natural Gas: Coiling for a Pop
After a steep downtrend, Natural Gas is showing early signs of a trend reversal. Price has formed a rounded base with volume pickup and a clean breakout attempt over intraday supply.
⸻
Technical Rationale:
• Base Formation: Price consolidating in a tight range after exhaustion selling – classic accumulation zone.
• Resistance Flip: Immediate resistance at $3.77 being tested multiple times. Sustained break may trigger momentum buying.
• Volume Confirmation: Gradual increase in volume on green candles suggests demand is building up.
• Support Zone: Strong base formed between $3.69–3.71, acting as a cushion for longs.
• Momentum Setup: Bullish structure on 15-min forming higher lows – potential to scale into swing long.
⸻
Trade Plan:
• Buy Above: $3.775 (on candle close above zone)
• Stop Loss: $3.695 (below support zone)
• Target 1: $3.88 (gap-fill + previous support)
• Target 2: $3.97 (supply zone)
• Risk-Reward: ~1:2.5 — favourable setup for positional long
⸻
Why Now?
After panic unwinding, smart money often steps in quietly. This pattern fits the Wyckoff Accumulation Phase B, where price fakes out on downside and reclaims value area — now pushing toward Phase C markup.
⸻
Bias: Bullish
Trade Type: Positional (1–4 days horizon)
Catalyst: Breakout + volume surge + price acceptance above $3.775
Let the gas ignite the move.
Natural Gas – Blow-Off Exhaustion Meets Supply Wall
⸻
Trade Details:
• Sell Entry: 4.045–4.050 (current zone)
• Stop Loss: Above 4.065 (recent high and breakout wick)
• Target 1: 3.980 (minor support and first structure break)
• Target 2: 3.940 (gap-fill and prior consolidation)
• Target 3: 3.910 (trendline retest area)
⸻
Thesis:
1. False Breakout: Price attempted to break above resistance at 4.06 but failed to close above it. Rejection candles suggest buyers were absorbed and trapped.
2. Volume Confirmation: Breakout occurred on declining volume, indicating lack of conviction from buyers.
3. Bearish Price Action: Lower high and a bearish engulfing candle near resistance suggest a shift in momentum.
4. Support Breach: Minor intraday support near 4.040 has been broken, confirming short-term weakness.
⸻
Risk Management:
• Maintain a risk-reward ratio of at least 1:2.
• Re-evaluate the position if price reclaims and sustains above 4.065 on strong volume.

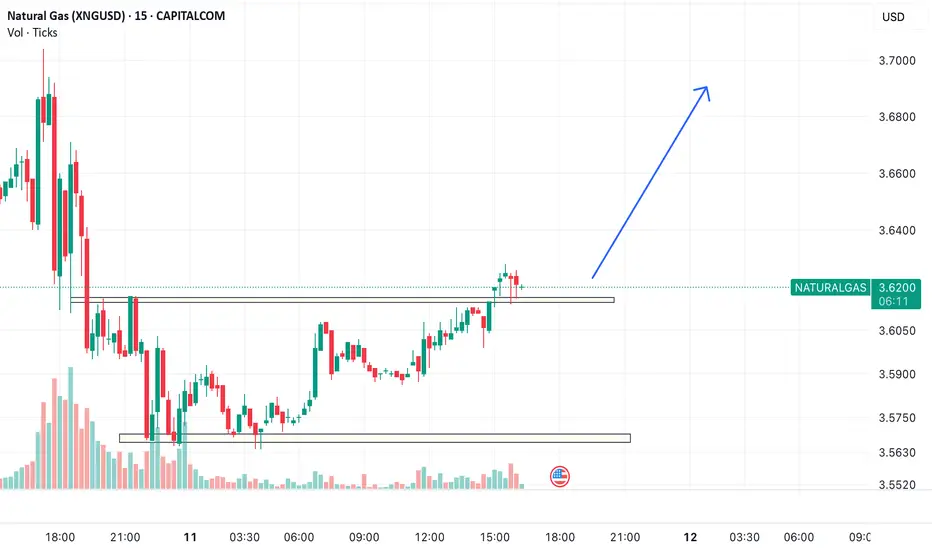
Tactical Breakout Play on NG
Before diving into the setup:
It’s important to acknowledge that recent long trades on Natural Gas have underperformed, largely due to:
• Muted global demand amid mild temperatures
• Weak industrial offtake
• Limited U.S. LNG export activity, despite geopolitical tensions
This has translated into a persistent bearish bias and fading upside momentum on every rally. However, the current technical structure warrants a tactical long trade with well-defined risk.
⸻
Technical Thesis – 15-Min Chart Analysis
1. Breakout from Tight Consolidation
Price has broken out of a narrow consolidation band (range: $3.600–$3.615) with a strong bullish candle and follow-through. The break above horizontal resistance is supported by steady volume expansion.
2. Higher Lows Formation
The chart shows a sequence of higher lows, indicating buyers defending key support zones, especially around the $3.565–$3.570 level.
3. Retest & Hold of Breakout Zone
After the breakout, price is currently retesting the zone around $3.615, holding it well. This is a textbook breakout-retest continuation setup, which allows a long entry with limited risk.
4. Momentum Shift
The previous downtrend was halted and reversed over several hours, showing signs of buyer re-emergence. If this move sustains, it may mark the beginning of a short-term uptrend.
⸻
Trade Plan
• Entry: Buy above $3.625
• Stop Loss: Below $3.605
• Target 1: $3.68
• Target 2: $3.72
• Time Frame: Intraday to 24 hours
Reward to Risk: > 2:1
Trade Type: Tactical, not positional. Close if $3.605 is breached.
⸻
Caveats & Strategy Note
This is not a conviction long on fundamental grounds — LNG demand remains subdued, and seasonality is not favorable yet. This is purely a technical trade based on price action and pattern structure.
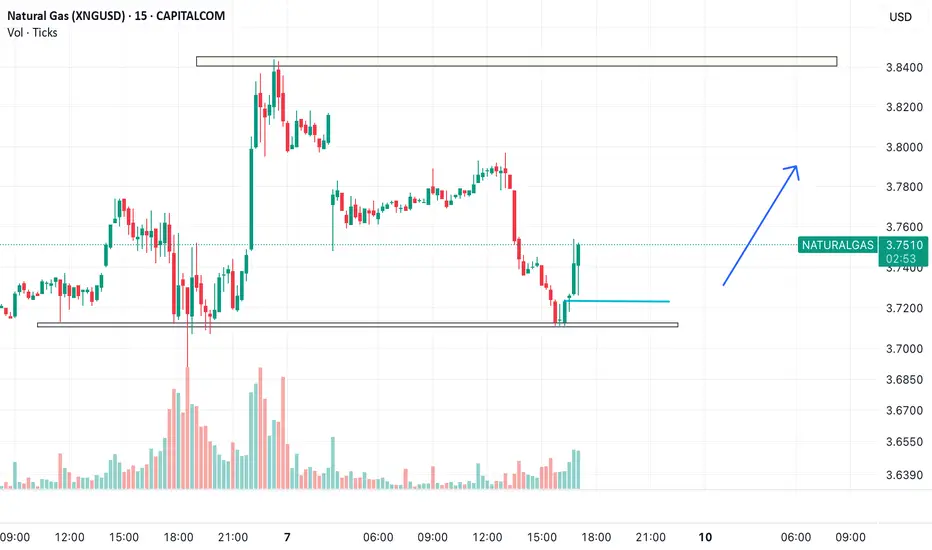
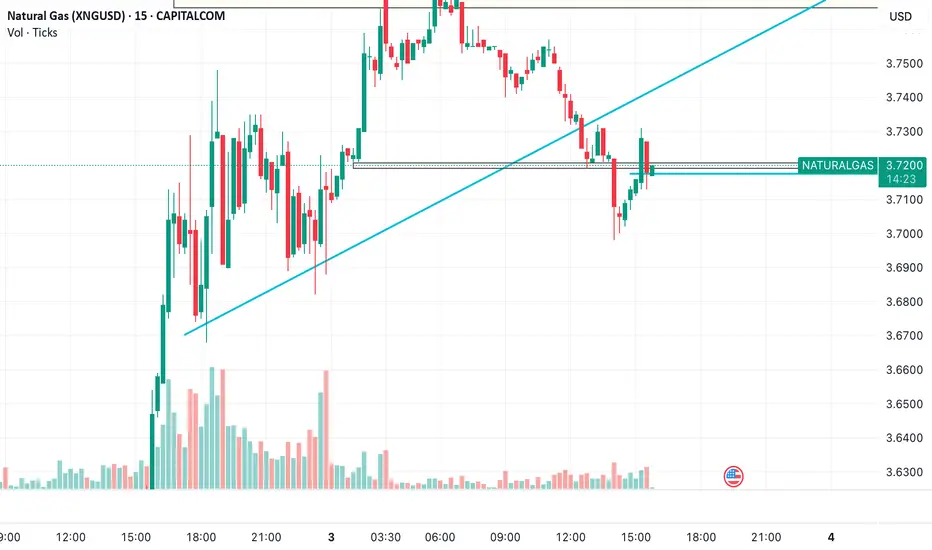
Time to Light the Fuse Again
Entry Zone: 3.740-3.744
Target: 3.80
Stop Loss: 3.715
Rationale:
• Strong bounce off demand zone near 3.715 confirms buyer interest.
• Double bottom setup suggests reversal from intraday lows.
• Increasing volume on recovery candles adds conviction.
• Clear path toward the next resistance zone around 3.80.
This is a momentum-backed bounce with limited downside and a clean upside target.
Gas It Up Before It Blows UpCMP: $3.728
Direction: BUY
Target: $3.78
Stop Loss: $3.71
Rationale:
• Strong support retested around $3.718–$3.720 with buyers stepping in.
• Multiple wicks rejecting downside hint at accumulation.
• Volume picking up on green candles—momentum building.
Trade Plan:
• Buy between $3.725–$3.730
• TP: $3.78 (resistance zone)
• SL: $3.71 (below support)
Risk-Reward: ~1:2.5 — worth the spark.
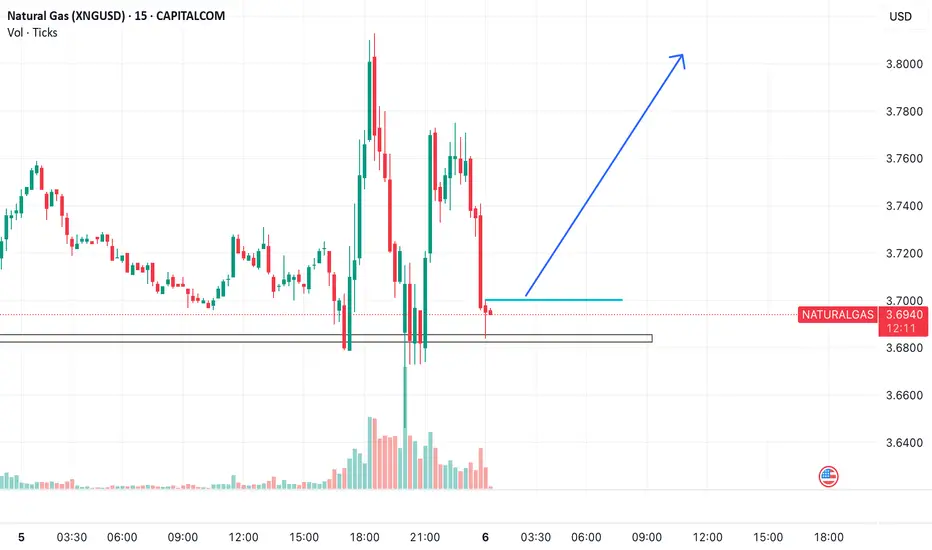
Gas It Up: Ready to Explode Above $3.70
Trade Setup:
Buy above: $3.705 (breakout confirmation above minor resistance marked in blue)
CMP: $3.697 (awaiting breakout confirmation)
Target Levels (Upside potential):
• T1: $3.735 – minor resistance from recent wick top
• T2: $3.765 – swing high from the previous impulse
• T3: $3.795 – high of the breakout candle before major drop
Stop-Loss:
• SL: $3.678 (below the recent demand zone & wick support area)
Rationale:
• Strong volume seen at lows around $3.67–3.68 indicating absorption and buying interest.
• Price is consolidating above the support box and just under breakout level – a bullish flag/pennant structure.
• MACD crossover likely if breakout occurs, confirming upward momentum.
Risk-Reward (from entry $3.705):
• T1: ~1:1
• T2: ~1.8:1
• T3: ~3:1
Wait for a candle close above $3.705 with volume for confirmation before entering.
Trail SL once T1 is hit to secure partial profits.
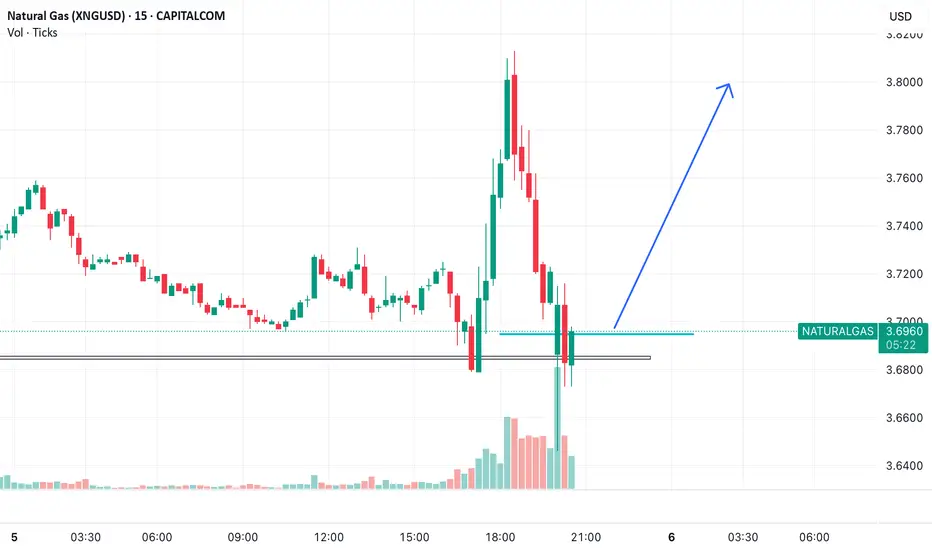
Fueling the Rebound: Natural Gas Ready to Ignite from the Dip!Observatiions:
• Support Zone: Around $3.67–$3.68, tested multiple times with good volume absorption.
• Price Action: Strong bullish recovery candle after a sharp fall, forming a potential bear trap / demand absorption setup.
• Volume Spike: High volume near lows indicating possible smart money buying.
Short-Term Positional Buy – Natural Gas (XNGUSD)
CMP: $3.694
Buy Zone: Between $3.68–$3.695
Targets:
• Target 1: $3.73
• Target 2: $3.76
• Target 3: $3.80 (only if momentum sustains)
Stop Loss: $3.65 (strict close basis, below support)
Holding Period: 1–3 sessions
Risk-Reward Outlook
• Risk: ~$0.04
• Reward: $0.06–$0.10
• R:R Ratio: 1:1.5 to 1:2.5
Short on NG AgainDespite earlier false starts, Natural Gas is once again showing clear signs of rejection near recent highs, with price action around $3.76 indicating seller dominance and exhaustion in upward momentum.
A strong rejection wick coupled with declining volumes and bearish divergence on intraday indicators strengthens the case for a short setup with a clean risk-reward profile.
Entry: Short at $3.76
Targets:
• T1: $3.68 – near-term support
• T2: $3.669 – demand zone base
• T3: $3.61 – swing target on deeper retracement
Stop-Loss: Above $3.80 (clear invalidation above resistance zone)
Bias: Bearish reversal from resistance
Conviction: Medium-High (based on price action and rejection structure)
Timeframe: Intraday to short swing (1–3 days)
This presents an opportunity to fade the recent strength with a controlled downside play, especially if $3.76 continues to act as a ceiling.

Natural Gas Shorting Opportunity AgainTrade Setup: Short Natural Gas (XNGUSD)
Natural Gas is approaching a key overhead resistance near 3.7176, a level that has previously acted as a supply zone. Price action shows weak bullish momentum with lower highs on intraday charts, suggesting potential exhaustion.
Volumes are thinning on the recent upmove, hinting at lack of conviction from buyers. If price fails to convincingly break above 3.7176, a mean-reversion trade becomes favorable.
🔽 Short Entry: Below 3.7176 (ideal trigger confirmation with rejection candle or bearish engulfing)
🎯 Targets:
• T1: 3.680 – minor intraday support
• T2: 3.669 – base of previous demand zone
• T3: 3.610 – stronger structural support
🛑 Stop-Loss: Above 3.74 (tight risk placement above resistance)
Bias: Bearish rejection near resistance
Conviction: Medium-High (confirmation preferred with price action)
Timeframe: Intraday to short swing
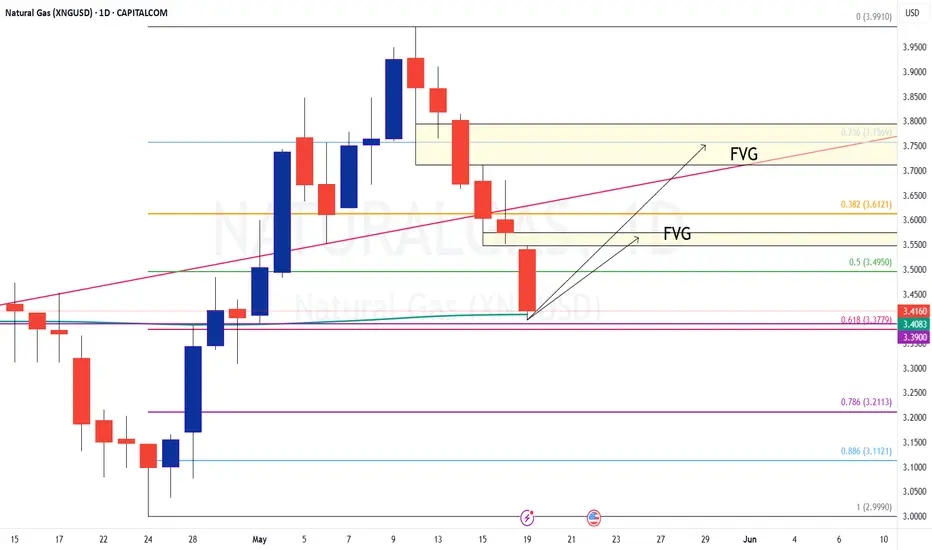
NATURALGAS - Time to Move up?CMP: 3.4020
Price is trading closer to the 0.618 fib retracement (3.3780)
AVWAP (On Daily TF) from the swing lows is placed at 3.4083
Price has been declining non stop without any meaningful pullback and I believe that the price will halt and reverse from here.
On Daily TF, it has left 2 FVGs at the top. Price most likely to be pulled up to these levels before going down (if the trend is to go down).
In my view, it is not a good idea to short at current levels of 3.4.
Actually, it is a LRHR set up in the making for long trades.
Daily chart with AVWAP
Disclaimer: I am not a SEBI registered Analyst and this is not a trading advise. Views are personal and for educational purpose only. Please consult your Financial Advisor for any investment decisions. Please consider my views only to get a different perspective (FOR or AGAINST your views). Please don't trade FNO based on my views. If you like my analysis and learnt something from it, please give a BOOST. Feel free to express your thoughts and questions in the comments section.
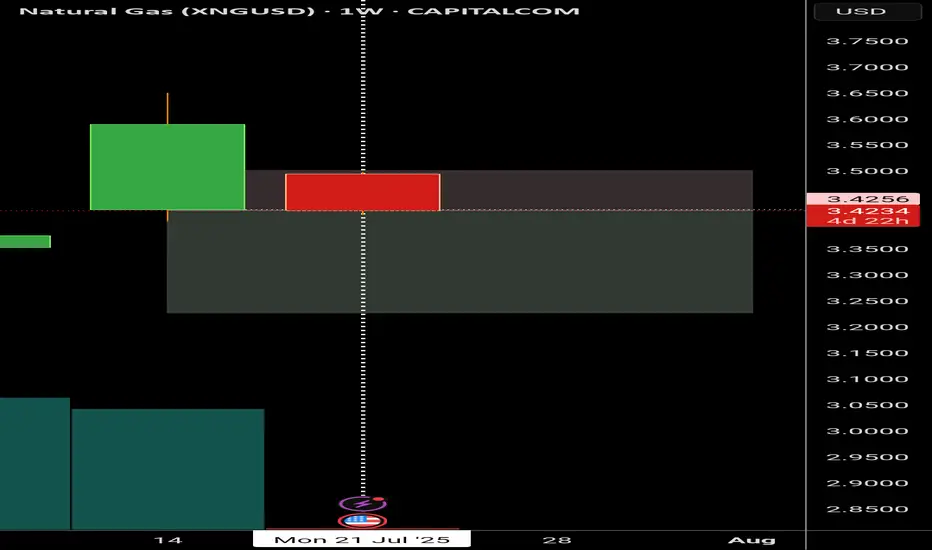
Natural gasBreakout waiting
Trying to Break weekly Resistance.
Entering after BO can give a good move
If BO can touch 4$
