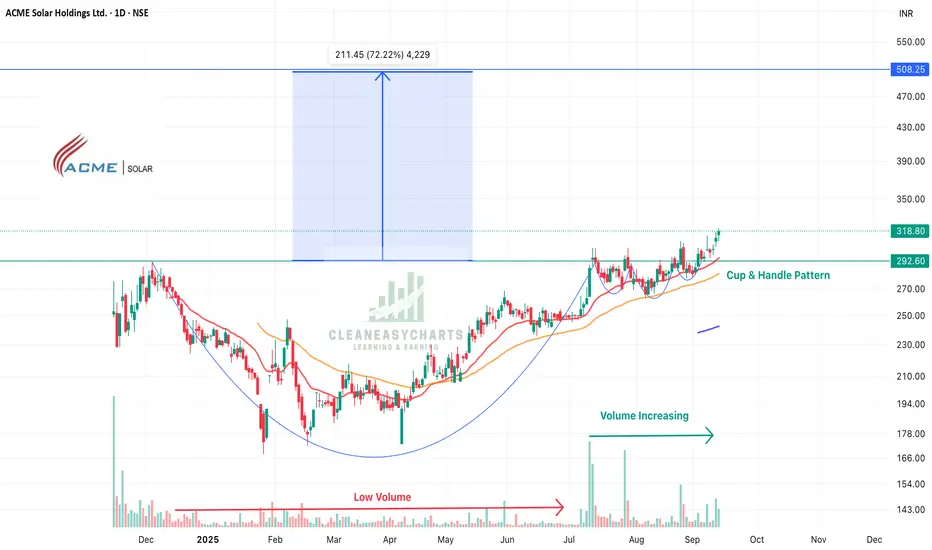
ACME Solar - Cup & Handle Patter + IPO StrategyACME Solar is heading for a 75% jump from current price. Following are the factors:
Technical Analysis:
1. IPO Strategy - The price has crossed the high of its price post listing
2. Volumes during the fall was low and now it has started picking
3. Complex Cup & Handle pattern breakout
Fundament
ACME Solar Holdings Ltd.
No trades
Next report date
—
Report period
—
EPS estimate
—
Revenue estimate
—
7.98 INR
2.52 B INR
14.05 B INR
83.76 M
About ACME Solar Holdings Ltd.
Sector
Industry
CEO
Nikhil Dhingra
Website
Headquarters
Gurugram
Founded
2015
IPO date
Nov 13, 2024
Identifiers
2
ISIN INE622W01025
ACME Solar Holdings Ltd. engages in the development, building, owning, operation, and maintaining utility scale renewable energy projects. Its portfolio includes solar, wind, hybrid, and firm and dispatchable renewable energy (FDRE) projects. The company was founded by Manoj Kumar Upadhyay on June 3, 2015 and is headquartered in Gurugram, India.
Related stocks
ACME Solar Holdings Ltd – Short-Term Price ProjectionRate for this projection by analyst ⭐️⭐️⭐️⭐️ (4/5)
Current Snapshot
CMP: ~₹313
PE: ~47× (high, premium valuation)
PB: ~4.2× (fairly expensive vs book)
Profit growth strong, but sales growth weak.
Revenue growth modest recently; profit growth strong. E.g., FY25 net profit rose ~130% over FY24, reven
ACME sola holding1. The price is braking all time high range.
2. The revenue is growing qoq.
3. Operating at >90% margin.
4. RSI >60 in all the time frame (i.e. weekly, monthly, daily)
All above information is for study only.

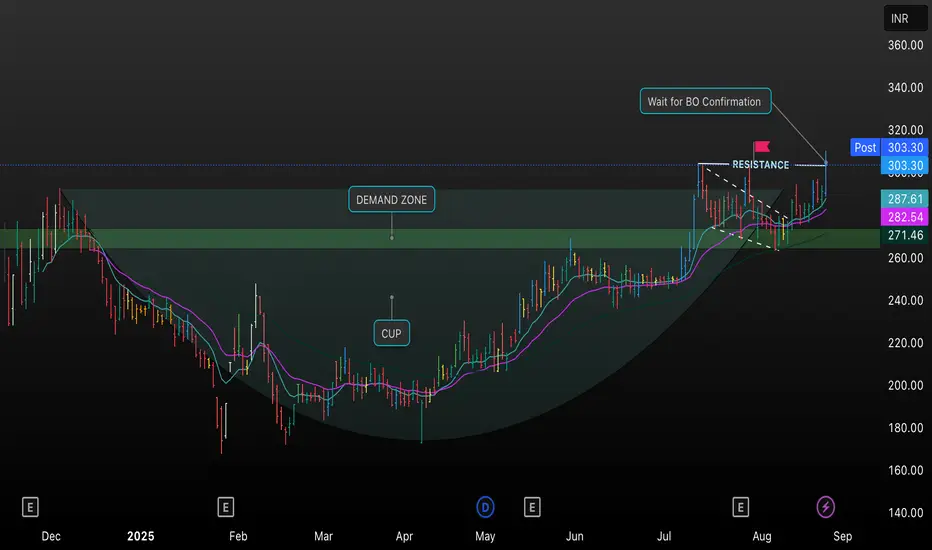
ACME Solar: Cup & Handle Breakout SetupThis TradingView chart analyzes ACME Solar, highlighting a classic Cup & Handle pattern forming since early 2025, with price action consolidating in a defined demand zone before recently breaking through resistance around INR 303.30.
Key elements include buying interest at support levels, the emerge
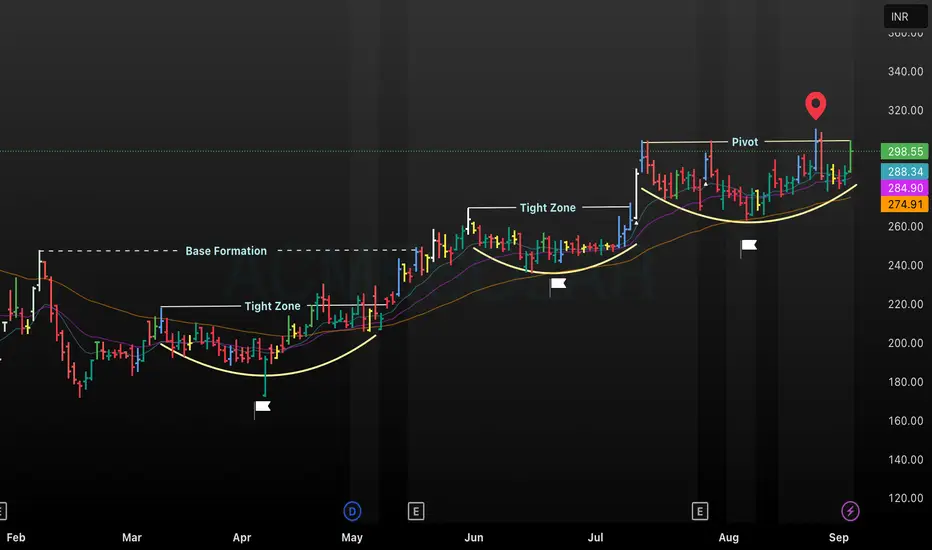
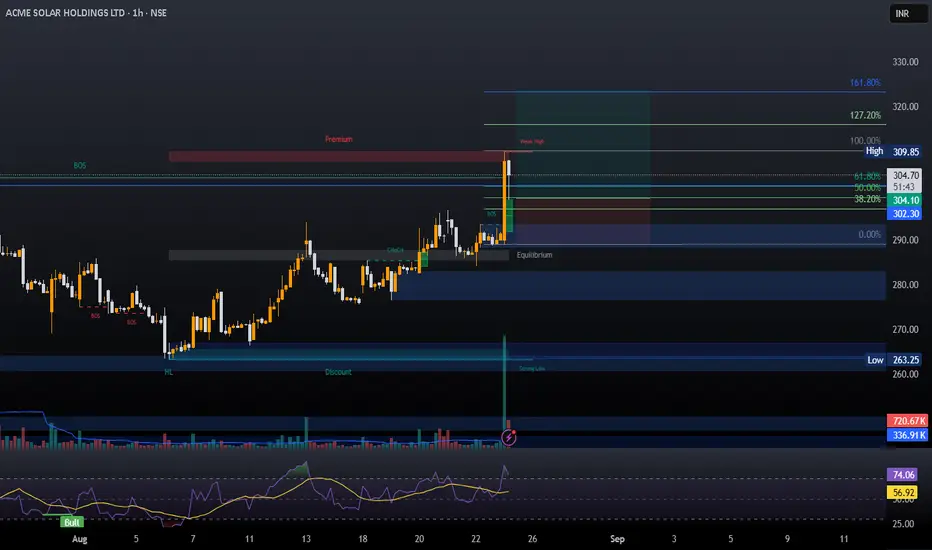
ACMESOLAR : Base Formation, Tight Zones, and Pivot Analysis This chart of ACME shows price action over several months, highlighting key technical levels and zones. A clear base formation is established early, followed by successive tight zones indicating consolidation phases, which often precede breakouts. The pivot level mark signals a critical resistance p
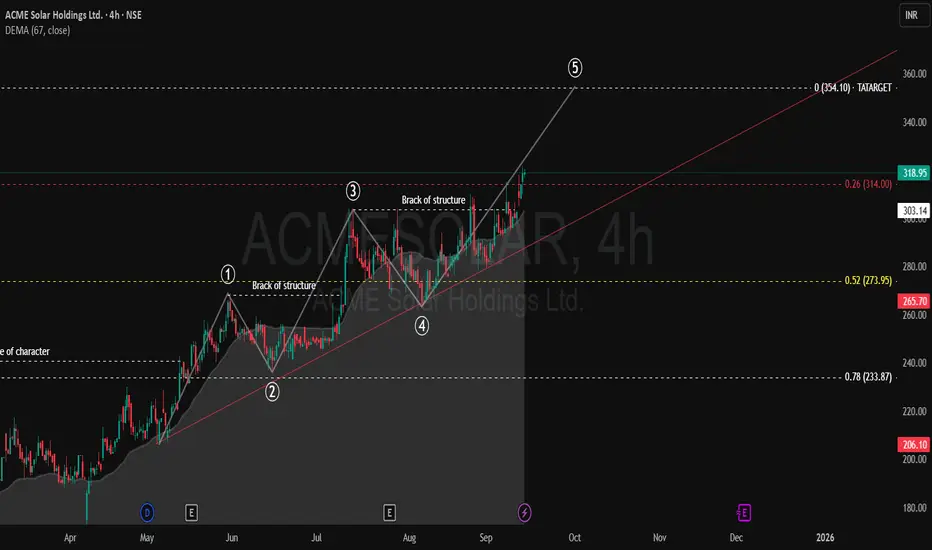
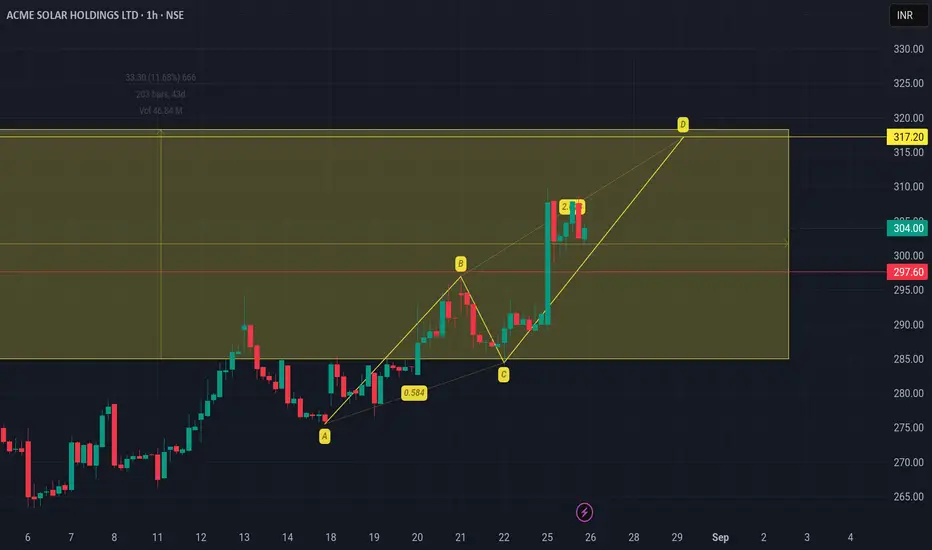
Acme solar will go further up ??As per harmonic PRZ pattern, Acme solar can go upto 317 with stop loss 298 within few days
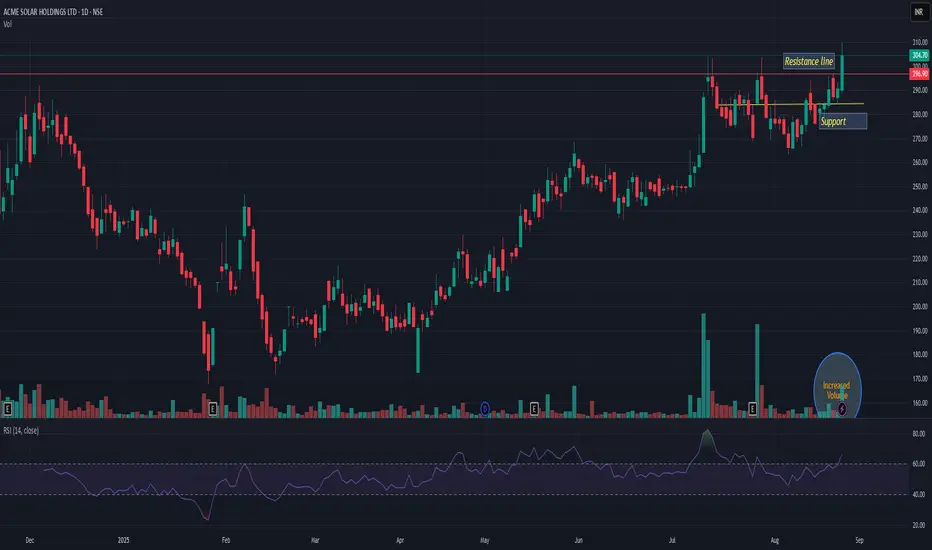
ACMESOLARACMESOLAR giving resistance breakout with decent volume. Support is near 280. Seems like this may take a new ride; trading at ATH. Very high probability that it can add up 12-15% from current level. Its very good risk-reward trade. Keep in yr watchlist
ACME SOLAR IPO BASEEntry- 300-302
Target- 315, 325, 340
Support- 285
Reason- Acme Solar has given a IPO base breakout. One can take a long here with todays low as a SL. It has given a strong closing above its IPO base high. IPO base breakout trade usually has great win ratio. One can also hold it for 25 to 30 percent
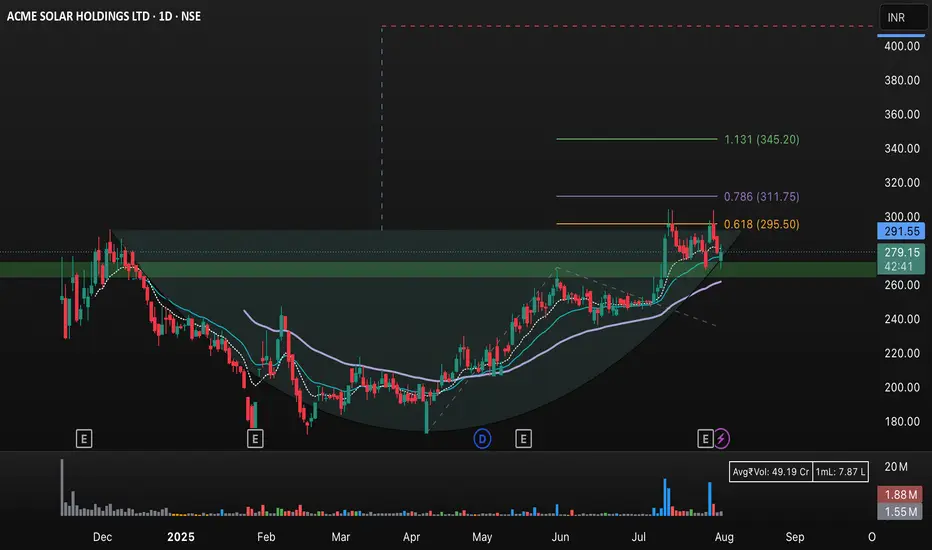
ACME Solar Holdings Ltd (NSE: ACMESOL) – Daily Chart Analysis This image displays the daily candlestick chart of ACME Solar Holdings Ltd (NSE: ACMESO) on TradingView. The chart highlights key technical analysis indicators and chart patterns:
• Fibonacci retracement levels at 0.618 (₹295.50), 0.786 (₹311.75), and an extension to 1.131 (₹345.20).
• Support and
ACME SOLAR HOLDINGS LTDACME Solar Holdings Ltd. is currently showing strong bullish momentum, supported by key technical indicators that suggest a positive trend.
Trading volume has been notable at approximately 774,891 shares, indicating increased investor interest. This recent performance, along with the commissioning

See all ideas
Summarizing what the indicators are suggesting.
Neutral
SellBuy
Strong sellStrong buy
Strong sellSellNeutralBuyStrong buy
Neutral
SellBuy
Strong sellStrong buy
Strong sellSellNeutralBuyStrong buy
Neutral
SellBuy
Strong sellStrong buy
Strong sellSellNeutralBuyStrong buy
An aggregate view of professional's ratings.
Neutral
SellBuy
Strong sellStrong buy
Strong sellSellNeutralBuyStrong buy
Neutral
SellBuy
Strong sellStrong buy
Strong sellSellNeutralBuyStrong buy
Neutral
SellBuy
Strong sellStrong buy
Strong sellSellNeutralBuyStrong buy
Displays a symbol's price movements over previous years to identify recurring trends.
MOSMALL250
Motilal Oswal Nifty Smallcap 250 ETF Units Exchange Traded FundWeight
0.12%
Market value
20.40 K
USD
SMALL250
Mirae Asset Nifty Smallcap 250 ETF Exchange Traded Fund UnitsWeight
0.12%
Market value
2.33 K
USD
MULTICAP
Mirae Asset Nifty500 Multicap 502525 ETF Exchange Traded Fund UnitsWeight
0.03%
Market value
1.94 K
USD
Explore more ETFs
Frequently Asked Questions
The current price of ACMESOLAR is 226.10 INR — it has increased by 0.65% in the past 24 hours. Watch ACME Solar Holdings Ltd. stock price performance more closely on the chart.
Depending on the exchange, the stock ticker may vary. For instance, on NSE exchange ACME Solar Holdings Ltd. stocks are traded under the ticker ACMESOLAR.
ACMESOLAR stock has risen by 0.49% compared to the previous week, the month change is a 2.93% rise, over the last year ACME Solar Holdings Ltd. has showed a 20.54% increase.
We've gathered analysts' opinions on ACME Solar Holdings Ltd. future price: according to them, ACMESOLAR price has a max estimate of 350.00 INR and a min estimate of 289.00 INR. Watch ACMESOLAR chart and read a more detailed ACME Solar Holdings Ltd. stock forecast: see what analysts think of ACME Solar Holdings Ltd. and suggest that you do with its stocks.
ACMESOLAR reached its all-time high on Sep 15, 2025 with the price of 324.30 INR, and its all-time low was 167.75 INR and was reached on Jan 28, 2025. View more price dynamics on ACMESOLAR chart.
See other stocks reaching their highest and lowest prices.
See other stocks reaching their highest and lowest prices.
ACMESOLAR stock is 2.69% volatile and has beta coefficient of 0.91. Track ACME Solar Holdings Ltd. stock price on the chart and check out the list of the most volatile stocks — is ACME Solar Holdings Ltd. there?
Today ACME Solar Holdings Ltd. has the market capitalization of 136.16 B, it has increased by 4.63% over the last week.
Yes, you can track ACME Solar Holdings Ltd. financials in yearly and quarterly reports right on TradingView.
ACME Solar Holdings Ltd. is going to release the next earnings report on May 25, 2026. Keep track of upcoming events with our Earnings Calendar.
ACME Solar Holdings Ltd. revenue for the last quarter amounts to 4.97 B INR, despite the estimated figure of 4.86 B INR. In the next quarter, revenue is expected to reach 6.18 B INR.
ACMESOLAR net income for the last quarter is 1.14 B INR, while the quarter before that showed 1.15 B INR of net income which accounts for −1.18% change. Track more ACME Solar Holdings Ltd. financial stats to get the full picture.
Yes, ACMESOLAR dividends are paid semi-annually. The last dividend per share was 0.20 INR. As of today, Dividend Yield (TTM)% is 0.00%. Tracking ACME Solar Holdings Ltd. dividends might help you take more informed decisions.
As of Feb 17, 2026, the company has 557 employees. See our rating of the largest employees — is ACME Solar Holdings Ltd. on this list?
EBITDA measures a company's operating performance, its growth signifies an improvement in the efficiency of a company. ACME Solar Holdings Ltd. EBITDA is 17.38 B INR, and current EBITDA margin is 88.24%. See more stats in ACME Solar Holdings Ltd. financial statements.
Like other stocks, ACMESOLAR shares are traded on stock exchanges, e.g. Nasdaq, Nyse, Euronext, and the easiest way to buy them is through an online stock broker. To do this, you need to open an account and follow a broker's procedures, then start trading. You can trade ACME Solar Holdings Ltd. stock right from TradingView charts — choose your broker and connect to your account.
Investing in stocks requires a comprehensive research: you should carefully study all the available data, e.g. company's financials, related news, and its technical analysis. So ACME Solar Holdings Ltd. technincal analysis shows the buy rating today, and its 1 week rating is sell. Since market conditions are prone to changes, it's worth looking a bit further into the future — according to the 1 month rating ACME Solar Holdings Ltd. stock shows the sell signal. See more of ACME Solar Holdings Ltd. technicals for a more comprehensive analysis.
If you're still not sure, try looking for inspiration in our curated watchlists.
If you're still not sure, try looking for inspiration in our curated watchlists.