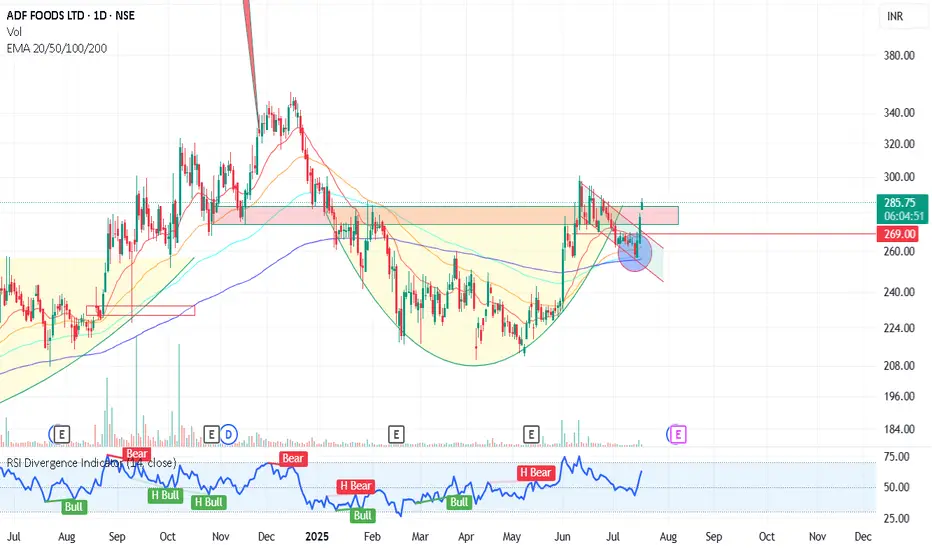
C&H Breakout ADF foodClear Cup & Handle breakout seen on chart
Volumes are strong
Price is crossing over last breakout level 283
if price sustain over the 285 , the price could retest the latest swing high 301 and surpass accordingly.
Keep on watch!!!
This is not for any trade recommendation, only educational purpose
ADF Foods Limited
No trades
Next report date
—
Report period
—
EPS estimate
—
Revenue estimate
—
7.32 INR
692.56 M INR
5.58 B INR
27.70 M
About ADF Foods Limited
Sector
Industry
CEO
Bimal Ramesh Thakkar
Website
Headquarters
Mumbai
Founded
1932
IPO date
Mar 11, 1992
Identifiers
2
ISIN INE982B01027
ADF Foods Ltd. is a holding company, which engages in the manufacture and selling of food products. Its brands include Ashoka, Aeroplane, Camel, Khansaama, Nate's, PJ Organics, Soul, and Truly Indian. It operates through the Process and Preserved Food and Distribution Business segments. The company was founded in 1932 and is headquartered in Mumbai, India.
Related stocks
BUY TODAY SELL TOMORROW for 5% By Kapil-MittalDON’T HAVE TIME TO MANAGE YOUR TRADES?
- Take BTST trades at 3:25 pm every day
- Try to exit by taking 4-7% profit of each trade
- SL can also be maintained as closing below the low of the breakout candle
Now, why do I prefer BTST over swing trades? The primary reason is that I have observed that

ADF FOODS - DOUBLE BOTTOM - 2HR CHART.ADF Foods is making Double Bottom pattern. It is in buying range.
Hammer candle formation at an old support, RSI divergence. Below 270 it looks weak.
If you like my analysis, please follow me as a token of appreciation :)
in.tradingview.com/u/SatpalS/
For learning and educational purposes only, no

ADFFOODS - Double Bottom Pattern Breakout on Daily ChartADFFOODS - Double Bottom Pattern Breakout on Daily Chart
After giving a good rounding bottom base breakout, the stock is moving up by forming some patterns like Darvas Box pattern and Double bottom pattern.
Currently, it has give a double bottom breakout with massive volume indicating more possible

ADFFOODS BEAKS OUT FROM 1-YR BASE RESISTANCE TO NEW HIGHADFFOODS, on the weekly scale, has just broken out from a 1-year base resistance on strong volume and is trading at new high. This week its momentum (RSI) moved into bull-zone above 60 and is rising. Its relative performance to CNX 500 crossed above its 26-week MA, and started making Higher-Highs &

ADF FOODS near Breakout Zone; Will it Breakout or consolidate ?ADF Foods Ltd. is an interesting chart with following
1. Price consolidating for last 11 month's and is near breakout levels.
2. RSI on all time frames above 60
3. Narrowing Bollinger Bands with price walking on upper Bollinger Band
4. Price Rise with huge Volume bars
5. Major Support near 215-

Adffoods, Marathon, Zentech, Zeemediaall stocks looking good from here,,
2 flag base
and 2 long base setups

ADF FOODSI Observed these Levels based on price action and Demand & Supply which is My Own Concept Called "PENDAM CONCEPTS" ... Please Don't Take any trades based on this chart/Post...because this chart is for educational purpose only not for Buy or Sell Recommendation.. Thank Q

Long ADF FoodsADF Foods Ltd is showing strong bullish signals on the weekly chart:
Price Action: The stock has been in an upward trend since May 2023, recently breaking above the key resistance at INR 220, indicating strong momentum.
Moving Averages: The 10-week EMA has crossed above the 20-week EMA, forming a b

ADF Foods- Typical RB with Flag patternADF Foods- Typical RB breakout along with flag formation later on. Flag pattern breakout done on 22.03.2024. Currently at resistance. Weekly candle close above 232 will ensure the target of 300.
Team Stocks-n-Trends.
Note: This is for educational purpose only.

See all ideas
Summarizing what the indicators are suggesting.
Neutral
SellBuy
Strong sellStrong buy
Strong sellSellNeutralBuyStrong buy
Neutral
SellBuy
Strong sellStrong buy
Strong sellSellNeutralBuyStrong buy
Neutral
SellBuy
Strong sellStrong buy
Strong sellSellNeutralBuyStrong buy
An aggregate view of professional's ratings.
Neutral
SellBuy
Strong sellStrong buy
Strong sellSellNeutralBuyStrong buy
Neutral
SellBuy
Strong sellStrong buy
Strong sellSellNeutralBuyStrong buy
Neutral
SellBuy
Strong sellStrong buy
Strong sellSellNeutralBuyStrong buy
Displays a symbol's price movements over previous years to identify recurring trends.
Frequently Asked Questions
The current price of ADFFOODS is 219.83 INR — it has decreased by −1.55% in the past 24 hours. Watch ADF Foods Limited stock price performance more closely on the chart.
Depending on the exchange, the stock ticker may vary. For instance, on NSE exchange ADF Foods Limited stocks are traded under the ticker ADFFOODS.
ADFFOODS stock has fallen by −6.03% compared to the previous week, the month change is a 11.16% rise, over the last year ADF Foods Limited has showed a −12.24% decrease.
We've gathered analysts' opinions on ADF Foods Limited future price: according to them, ADFFOODS price has a max estimate of 222.00 INR and a min estimate of 222.00 INR. Watch ADFFOODS chart and read a more detailed ADF Foods Limited stock forecast: see what analysts think of ADF Foods Limited and suggest that you do with its stocks.
ADFFOODS reached its all-time high on Dec 16, 2024 with the price of 353.95 INR, and its all-time low was 7.41 INR and was reached on Aug 22, 2013. View more price dynamics on ADFFOODS chart.
See other stocks reaching their highest and lowest prices.
See other stocks reaching their highest and lowest prices.
ADFFOODS stock is 6.46% volatile and has beta coefficient of 1.62. Track ADF Foods Limited stock price on the chart and check out the list of the most volatile stocks — is ADF Foods Limited there?
Today ADF Foods Limited has the market capitalization of 23.89 B, it has increased by 8.85% over the last week.
Yes, you can track ADF Foods Limited financials in yearly and quarterly reports right on TradingView.
ADF Foods Limited is going to release the next earnings report on May 26, 2026. Keep track of upcoming events with our Earnings Calendar.
ADFFOODS net income for the last quarter is 223.76 M INR, while the quarter before that showed 263.91 M INR of net income which accounts for −15.21% change. Track more ADF Foods Limited financial stats to get the full picture.
ADF Foods Limited dividend yield was 0.51% in 2024, and payout ratio reached 19.04%. The year before the numbers were 0.65% and 17.51% correspondingly. See high-dividend stocks and find more opportunities for your portfolio.
As of Feb 14, 2026, the company has 1.87 K employees. See our rating of the largest employees — is ADF Foods Limited on this list?
EBITDA measures a company's operating performance, its growth signifies an improvement in the efficiency of a company. ADF Foods Limited EBITDA is 1.22 B INR, and current EBITDA margin is 12.26%. See more stats in ADF Foods Limited financial statements.
Like other stocks, ADFFOODS shares are traded on stock exchanges, e.g. Nasdaq, Nyse, Euronext, and the easiest way to buy them is through an online stock broker. To do this, you need to open an account and follow a broker's procedures, then start trading. You can trade ADF Foods Limited stock right from TradingView charts — choose your broker and connect to your account.
Investing in stocks requires a comprehensive research: you should carefully study all the available data, e.g. company's financials, related news, and its technical analysis. So ADF Foods Limited technincal analysis shows the buy rating today, and its 1 week rating is buy. Since market conditions are prone to changes, it's worth looking a bit further into the future — according to the 1 month rating ADF Foods Limited stock shows the neutral signal. See more of ADF Foods Limited technicals for a more comprehensive analysis.
If you're still not sure, try looking for inspiration in our curated watchlists.
If you're still not sure, try looking for inspiration in our curated watchlists.