ALKEMALKEM
bullish trend is Showing on the chart.
buy signals in
technical indicators and
cup with handle & ascending triangle chart pattern.
BUYING RANGE 5860/5870
Watch for a breakout above 5860/5870 to sustain the bullish trend. If the resistance holds, there could be a retest towards 5380/5400 an
Alkem Laboratories Ltd.
No trades
Next report date
—
Report period
—
EPS estimate
—
Revenue estimate
—
197.45 INR
21.65 B INR
129.30 B INR
43.08 M
About Alkem Laboratories Ltd.
Sector
Industry
CEO
Vikas Gupta
Website
Headquarters
Mumbai
Founded
1973
IPO date
Dec 23, 2015
Identifiers
2
ISIN INE540L01014
Alkem Laboratories Ltd. engages in the development, manufacture, and sale of pharmaceutical products. It produces branded generics, generic drugs, active pharmaceutical ingredient, and nutraceuticals. The company was founded by Samprada Singh and Basudeo Narain Singh on August 8, 1973 and is headquartered in Mumbai, India.
Related stocks

ALKEM: Stage 2 Momentum AnalysisThe Core Thesis: Sustained Stage 2 Advance
The stock has successfully transitioned from its Stage 1 consolidation base (August 2025) and is now in a confirmed Stage 2 markup phase. This transition is backed by strong quarterly revenue growth, which hit a 3-year high of 17.02% QoQ in late 2025.
Te

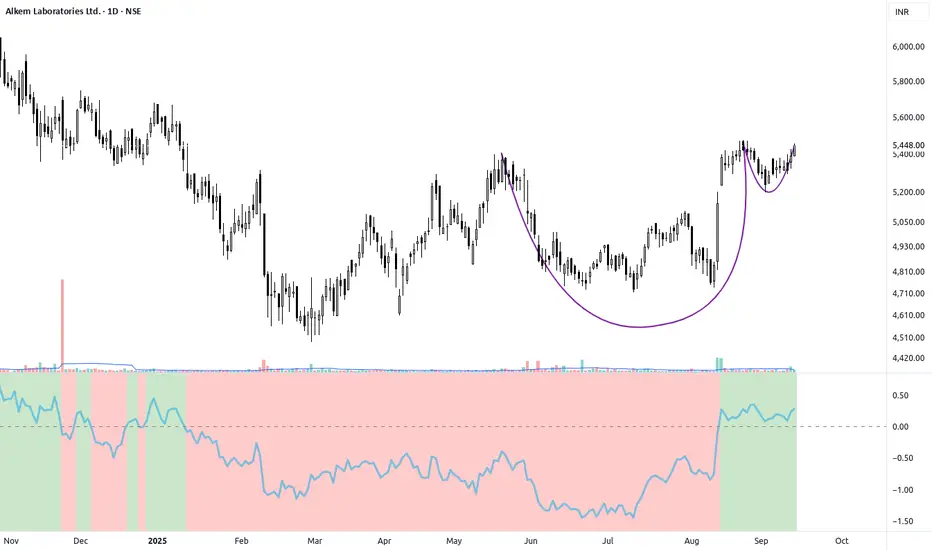
Alkem Laboratories (D): Bullish (Rounding Bottom Breakout)Timeframe: Daily | Scale: Linear
The stock has confirmed a major structural breakout from a 6-month "Rounding Bottom" recovery pattern. The "Gap Up" above the key resistance of ₹5,850 signals a shift in market sentiment from "Accumulation" to "Markup."
🚀 1. The Fundamental Catalyst (The "Why")

BAT pattern in AlkemWaiting for retacement of last candle rally to take entry, our target is all time high. This is for educational purposes only.

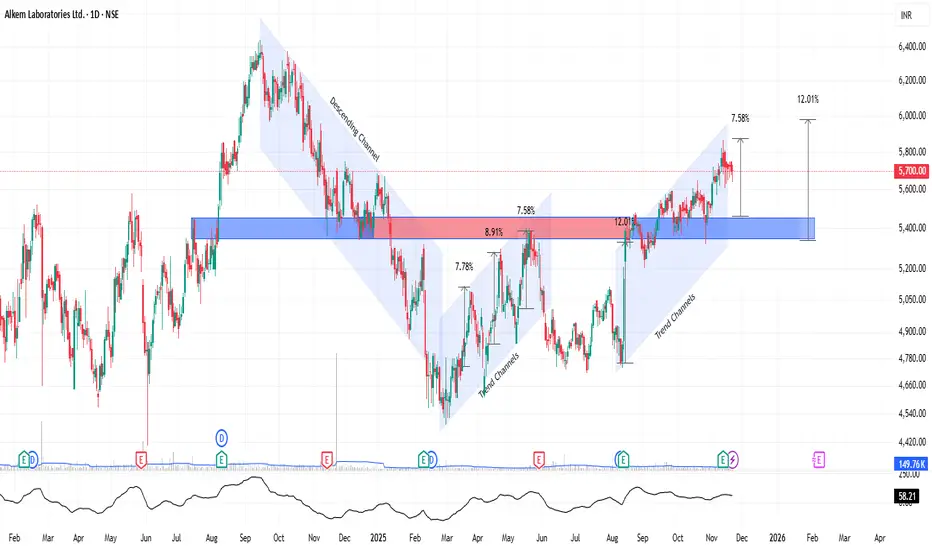
Technical Analysis of Alkem Laboratories Ltd (ALKEM)Technical Analysis of Alkem Laboratories Ltd (NSE: ALKEM)
Current Price & Key Levels
Current close: ~₹5,704.50 (as shown on the chart)
All-time high region: ~₹6,000–6,400
Major horizontal support/resistance zone: ₹5,400–5,700 (thick red/blue band that has acted both as support and resistance multip
ALKEM LAB TARGET 5950 STOPLOSS 5640Alkem lab monthly breakout of previous strong resistance of 5675 and sustained in day chart. First target is 5800 and second target is 5950/6000

Swing Trade : ALKEM Supported by HammerALKEM Swing Setup – Hammer Confirmation
Price action signals a potential reversal as ALKEM finds support with a well-formed hammer candle. The structure aligns with prior demand zones, suggesting renewed buyer interest.
Momentum indicators show early signs of recovery, and volume behavior support

Ideal Pattern & AI Trading In This AI era I usually find the Patterns more smooth in higher time frame
They ensure Current status , also Upcoming direction of trend based on the Wave Theory
AI Can be found Good once you release the Direction of Trend on Major Time frame
For Instance I will Guide my AI Code to sell CE o

Alkem Laboratories LtdInvestment Rationale – Alkem Laboratories Ltd
Technical View:
Alkem is showing a long base tight breakout formation on the daily chart, supported by volume pickup and a bullish crossover. The weekly structure also shows strength, with price trading above key moving averages, indicating a potential

ALKEM– Cup & Handle Formation with Breakout PotentialTechnical View:
Alkem is showing a classic Cup & Handle pattern on the daily chart. The stock has formed a rounded base between ₹4,400 and ₹5,400, consolidating after a healthy recovery from its earlier downtrend. Recently, it has created a mini-handle near resistance, signaling that buyers are abs
See all ideas
Summarizing what the indicators are suggesting.
Neutral
SellBuy
Strong sellStrong buy
Strong sellSellNeutralBuyStrong buy
Neutral
SellBuy
Strong sellStrong buy
Strong sellSellNeutralBuyStrong buy
Neutral
SellBuy
Strong sellStrong buy
Strong sellSellNeutralBuyStrong buy
An aggregate view of professional's ratings.
Neutral
SellBuy
Strong sellStrong buy
Strong sellSellNeutralBuyStrong buy
Neutral
SellBuy
Strong sellStrong buy
Strong sellSellNeutralBuyStrong buy
Neutral
SellBuy
Strong sellStrong buy
Strong sellSellNeutralBuyStrong buy
Displays a symbol's price movements over previous years to identify recurring trends.
PHARMABEES
Nippon India Nifty Pharma ETF Units Exchange Traded FundWeight
3.90%
Market value
4.45 M
USD
Explore more ETFs
Frequently Asked Questions
The current price of ALKEM is 5,870.50 INR — it has decreased by −0.65% in the past 24 hours. Watch Alkem Laboratories Ltd. stock price performance more closely on the chart.
Depending on the exchange, the stock ticker may vary. For instance, on NSE exchange Alkem Laboratories Ltd. stocks are traded under the ticker ALKEM.
ALKEM stock has risen by 3.57% compared to the previous week, the month change is a −0.93% fall, over the last year Alkem Laboratories Ltd. has showed a 24.81% increase.
We've gathered analysts' opinions on Alkem Laboratories Ltd. future price: according to them, ALKEM price has a max estimate of 7,056.00 INR and a min estimate of 4,280.00 INR. Watch ALKEM chart and read a more detailed Alkem Laboratories Ltd. stock forecast: see what analysts think of Alkem Laboratories Ltd. and suggest that you do with its stocks.
ALKEM reached its all-time high on Sep 13, 2024 with the price of 6,439.90 INR, and its all-time low was 1,152.50 INR and was reached on May 2, 2016. View more price dynamics on ALKEM chart.
See other stocks reaching their highest and lowest prices.
See other stocks reaching their highest and lowest prices.
ALKEM stock is 1.65% volatile and has beta coefficient of 0.80. Track Alkem Laboratories Ltd. stock price on the chart and check out the list of the most volatile stocks — is Alkem Laboratories Ltd. there?
Today Alkem Laboratories Ltd. has the market capitalization of 703.98 B, it has increased by 0.75% over the last week.
Yes, you can track Alkem Laboratories Ltd. financials in yearly and quarterly reports right on TradingView.
Alkem Laboratories Ltd. is going to release the next earnings report on Feb 13, 2026. Keep track of upcoming events with our Earnings Calendar.
ALKEM earnings for the last quarter are 63.99 INR per share, whereas the estimation was 58.65 INR resulting in a 9.11% surprise. The estimated earnings for the next quarter are 57.79 INR per share. See more details about Alkem Laboratories Ltd. earnings.
Alkem Laboratories Ltd. revenue for the last quarter amounts to 40.01 B INR, despite the estimated figure of 37.49 B INR. In the next quarter, revenue is expected to reach 37.70 B INR.
ALKEM net income for the last quarter is 7.65 B INR, while the quarter before that showed 6.64 B INR of net income which accounts for 15.17% change. Track more Alkem Laboratories Ltd. financial stats to get the full picture.
Alkem Laboratories Ltd. dividend yield was 0.92% in 2024, and payout ratio reached 24.85%. The year before the numbers were 0.81% and 26.63% correspondingly. See high-dividend stocks and find more opportunities for your portfolio.
As of Feb 12, 2026, the company has 22.83 K employees. See our rating of the largest employees — is Alkem Laboratories Ltd. on this list?
EBITDA measures a company's operating performance, its growth signifies an improvement in the efficiency of a company. Alkem Laboratories Ltd. EBITDA is 28.11 B INR, and current EBITDA margin is 19.66%. See more stats in Alkem Laboratories Ltd. financial statements.
Like other stocks, ALKEM shares are traded on stock exchanges, e.g. Nasdaq, Nyse, Euronext, and the easiest way to buy them is through an online stock broker. To do this, you need to open an account and follow a broker's procedures, then start trading. You can trade Alkem Laboratories Ltd. stock right from TradingView charts — choose your broker and connect to your account.
Investing in stocks requires a comprehensive research: you should carefully study all the available data, e.g. company's financials, related news, and its technical analysis. So Alkem Laboratories Ltd. technincal analysis shows the buy rating today, and its 1 week rating is strong buy. Since market conditions are prone to changes, it's worth looking a bit further into the future — according to the 1 month rating Alkem Laboratories Ltd. stock shows the buy signal. See more of Alkem Laboratories Ltd. technicals for a more comprehensive analysis.
If you're still not sure, try looking for inspiration in our curated watchlists.
If you're still not sure, try looking for inspiration in our curated watchlists.