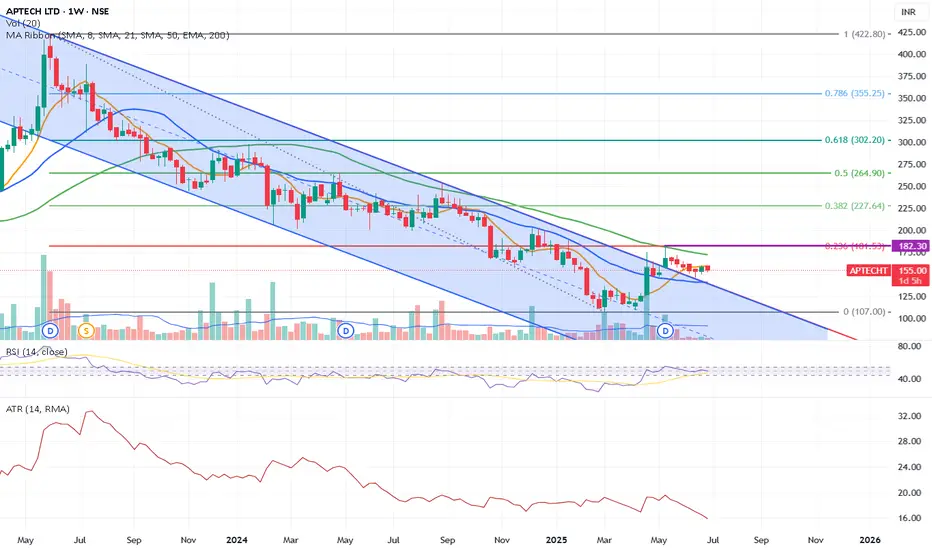
Aptech given breakoutAptech has given a breakout out of parallel channel but it would be worth waiting for the Fibonacci resistance to be broken which was not broken last time. Check the red candle.
Trade ideas
APTECH: Reversal Setup | Risky Bet⚡️Price Analysis:
1️⃣ Price not showing strength.
2️⃣ Price structure is bullish.
3️⃣ Double bottom formation.
4️⃣ Price has a very good scope on the upside, can be a potential multibagger pick as well but it's very early now to confirm.
✨ Key Observations:
➡️ RRR favourable at CMP.
➡️ Risky Bet - Entry is still pending. Keeping on Radar
➡️ Continue to move higher to prove the momentum strength and support formation.
⚠️ Disclaimer: This is NOT a buy/sell recommendation. This post is meant for learning purposes only. Views are personal. Please, do your due diligence before investing.⚠️
Aptecht - Bottom Out StockAptecht - Bottom Out Stock
APTECHT looks good at bottom and near the support level.
Above 210, we can see 250-300 in next 6-12 months.
Fundamentals are good and near breakout as per technical.

APTECH - Trend reversal possible - 80% upside potential Price Analysis & Overview:
1. A higher high is pending.
2. Need good volumes.
3. Price structure is showing a reversal pattern.
4. Entry will be only after confirmation above 250.
5. Expecting strong volumes!
6. Must be on radar!
7. Multibagger potential.
8. Until price breaks 200 level nothing to worry.
9. Upside strength is still not very convincing yet.
10. RRR is favourable since stock seems to be bottomed out.
- Stay tuned for further insights, updates and trade safely!
- If you liked the analysis, don't forget to leave a comment and boost the post. Happy trading!
Disclaimer: This is NOT a buy/sell recommendation. This post is meant for learning purposes only. Views are personal. I share whatever I do. Please, do your due diligence before investing.
Thanks & Regards,
Anubrata Ray


APTECH Testing Support at 200 EMA with Potential Trend Reversal✅The stock has been in a downtrend, forming lower highs and lower lows, indicating bearish momentum. However, it is currently testing a key support level near the 200 EMA, which often acts as a significant level for potential reversals. The 200 EMA, combined with the horizontal support, creates a critical zone where the stock could either bounce back or break down further.
✅The area around ₹210-₹220 has acted as a strong support level, preventing the stock from declining further. The confluence of the 200 EMA and the horizontal support makes this an important level to watch for potential bullish reversal signals.

Good Reversal CandidateThe stock has taken a good support on weekly trendline on the bottom.
Now today it has broken the 1 year old trendline on Day Time Frame.
A day closing above 200 EMA can bring good momentum in this stock.
This idea is for Educational Purpose only!
This is not a BUY/SELL recommendation.
Learn & Earn,
Dr. Tanya Kumar


Aptech: Currently At Potential Support ZoneSupport Zone Analysis: Aptech appears to be finding support within the 215-220 range, a critical level that has historically held firm.
Long-Term Trend Observation: The stock has been trading within a parallel zone for approximately 3.6 years, indicating a strong tendency to adhere to this trend. Future movements may likely follow this established pattern.
RSI Bullish Divergence: The Relative Strength Index (RSI) is displaying bullish divergence, suggesting potential upward momentum despite recent price declines.
Volume Analysis: Although Aptech recently closed with a very bearish candlestick pattern, it's important to note that volume accompanying this decline is exceptionally low. This could indicate a potential trap scenario, where the selling pressure may not be as significant as it appears.
Trade Outlook: Aptech warrants attention as it approaches the support zone, potentially offering a favorable risk-to-reward opportunity. The bullish divergence in RSI and the historical parallel trend could indicate the possibility of a reversal or bounce from current levels.

Aptech resuming uptrend again #APTECHT might give 40-50% returns in the next few months.
- Price has been correcting for the last 6 months
- Tight consolidation towards trendline support for the last 6 weeks
- Bullish candle today with strong volumes
Stoploss - 270 or 7.2%

Aptech is ready for a big moveAptech traded in a channel for 7 months and gave a falling wedge breakout last month with good volume and recently made a double bottom structure and ready for a up move. All the KEY EMAs have come together and once the price closes above all the EMAS and an important resistance that is 294 one can take an entry for the targets mentioned in the charts.
Please comment and let me know what you think about this trade.
*This idea is only for educational purpose*

Aptech Looking Good above 275-Aptech Looking Good above 275
-Volume high
-Rsi & Adx strong
-trend breakout
-after testing strong support zone now its trying to break upper trend with strong momentum.

Aptech after long downtrend now on bounce from demand zone After long term downtrend will seems to be halt at wekly demand zone then reversing . In this case watch the price as I noted on chart . This was the approch to trade the stock. Analysis must be done before you buy not after buying stock. Keep learning. Not a buy sell recommendation pure learning.

APTECH LTD : A good Buy for Long Term CMP: 254.70The stock has retraced to 0.618 of the Fib series from its all time high of 418.35 which it reached on 30th May 2023 and has been falling continuously to touch a low of 243.90 on 9th Nov 2023. Thats a drop of over 41% from its all time high.
The stock is finding support at the current levels which happens to be the Monthly and Weekly Instutional Buy Zone and also the 0.618 Fib Retracement level.. this level is a good area for institutional investors to come in.
The average 30 day Volume is around 311 K whereas the last few days the volumes has been in the range of over 750K. This means good buying is coming in these levels.
The monthly Institutional buy zone is between 207/- and 250/-
The stock is still trading below the falling trend line and the ideal buy would be after a confirmed close above the trend line with better than average daily volumes, however since this is a good stock and it is in the important support levels, one can start buying partly ( as per your risk appetite) at these levels and accumulate if it comes lower and within the buy zone mentioned above.
Target: We are looking at a long term target (1.50 to 2 years) of Rs.525/-

Aptech Trend ReversalAptech currently traid near Support Level.
Price Trend Reversal possible with Bullish Divergence and MFI trend Reversal on Weekly.

APTECH - READY FOR 100 % GAINSAPTECH , promoted by Rakesh Jhunjhunwala and company, is hovering around 290 levels.
These levels were the highest since 2008 - 2022, then stock gave breakout and reach around 425 levels, now again retesting the strong support zone.
this should accumulate here and then again start upmove with the september quarter results
buy levels - 290
target 600 plus
stoploss 225
thanks

APTECHT Chart: Breakout and DivergenceThe weekly chart of APTECHT reveals some interesting technical patterns and indicators:
Breakout of Weekly Demand Zone: The chart indicates that the stock has broken out of a significant weekly demand zone. This breakout suggests a potential shift in the prevailing downtrend, indicating a possibility of a bullish trend reversal.
Steep Falling Trendline: It's important to note that there's a steep falling trendline on the chart. This indicates a strong and prolonged downtrend. The breakout from this steep trendline is a notable event as it signifies a potential change in the momentum.
RSI Divergence: The Relative Strength Index (RSI) shows a clear divergence. This means that while the price has been making lower lows, the RSI has been making higher lows. This kind of divergence often serves as an early signal for a potential trend reversal.
Trade Strategy:
Based on the analysis provided, a potential trade setup could be as follows:
Entry: Consider entering a long position at the current market price (CMP) of ₹319. The breakout from the weekly demand zone and the divergence on the RSI both suggest a potential bullish movement.
Stop Loss (SL): To manage risk, it's wise to set a stop loss at ₹298. This level should provide some buffer against price fluctuations and unexpected adverse movements.
Target: Aim for a target price of ₹355. This target aligns with the potential upside suggested by the breakout and divergence patterns.
Conclusion:
The combination of the breakout from the weekly demand zone, the divergence on the RSI, and the breakout from the steep falling trendline could be indicative of a potential trend reversal and bullish movement for APTECHT. However, it's crucial to remember that all trading involves risk, and no analysis can guarantee specific outcomes. Traders should always practice responsible risk management and consider seeking advice from financial professionals before making trading decisions.


Perfect retest in Aptech after the last rallyPerfect retest in Aptech after the last rally. Is Aptech poised for a rally again.

AptechBUY @ 471
STOP LOSS - 424.95
TARGET 1 - 510.60
2 - 550.60
3 - 616.00
4 - 662.60
This is for educational purpose. Happy Trading

An Apt Breakout in APTECHTCompany has reduced debt.
Company is almost debt free.
Company is expected to give good quarter.
Company has delivered good profit growth of 20.7% CAGR over last 5 years
Company has been maintaining a healthy dividend payout of 83.5%
Debtor days have improved from 158 to 118 days.
Company's working capital requirements have reduced from 153 days to 80.5 days
Aptech Ltd. is a pioneer in the non-formal education and training business in the country with a significant global presence.
It was established in 1986 and has 800 centers. It has a presence in diverse sectors ranging from IT training, media & entertainment, retail & aviation, beauty & wellness, banking & finance, and pre-school segment amongst others. It has successfully trained students, professionals, universities & corporates through its two main streams of business - Individual Training and Enterprise Business Group .

Aptecht Nice PerformedAptecht
DISCLAIMER - We are not a SEBI Registered Advisors. This channel is purely for Educational purposes only. We will not be responsible for your profit and loss.

Aptech - A Multi bagger OpportunityThe stock has been seen making multiple cup and handle patterns. Once the stock closes above its All time high on a monthly basis an entry in the stock can be taken.
This is for high risk takers and people with deep pockets. Also do not risk all your capital in one stock. Deploy cash in a smart manner.
Updates on Buying, Stop loss and Targets will be given once the trade triggers.
This is a play for people looking to hold for long term trends to develop and have chances to triple or quadruple their capital.
Disclaimer - I am sharing my thoughts and trading ideas here. I am not responsible for any loss or profit made my the viewer. Please deploy cash as per your risk appetite. Trading in the financial markets is a risky but highly rewarding profession. Plan accordingly !!
