#ARIHANTCAPAsset: Arihant Capital Markets Ltd (ARIHANTCAP)
Breakout Level: 890
Potential Target: 1075
Stop Loss: 850 (~4%)
Timeframe: Short to Low Medium term
Risk to Reward ratio : 1:2
Rationale:
Fundamentals -
Fundamentally decent stock with the following attributes:
* ROCE - 21.3%
* ROE - 15.9%
* Debt to
5.05 INR
587.03 M INR
2.44 B INR
24.75 M
About Arihant Capital Markets Limited
Sector
Industry
Website
Headquarters
Mumbai
Founded
1992
ISIN
INE420B01036
FIGI
BBG000DYTWT7
Arihant Capital Markets Ltd. is a holding company, which engages in the provision of financial services. Its services include securities and commodities broking, financial planning, depository services, and merchant banking. The company was founded by Ashok Kumar Jain on June 25, 1992 and is headquartered in Mumbai, India.
Related stocks

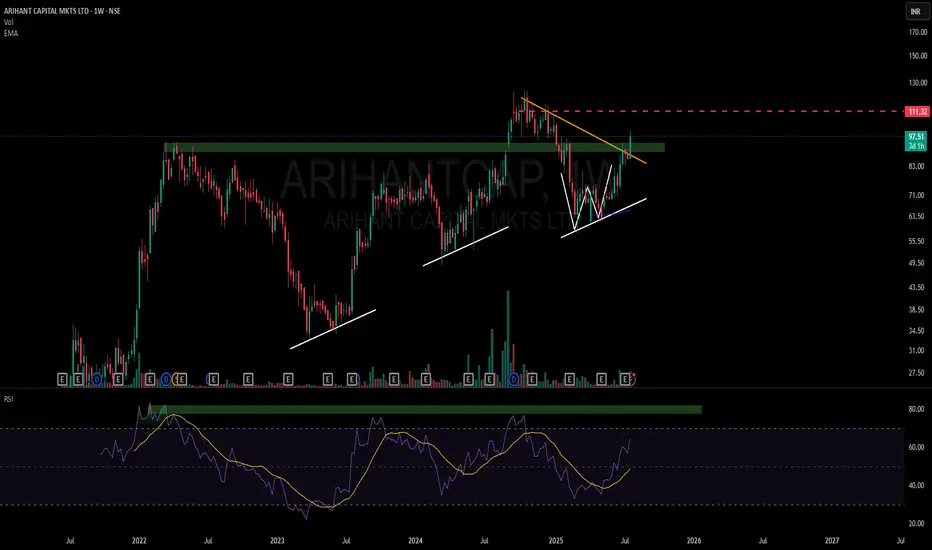
A Story of Structure, Strength, Supply Becomes Demand & RSI🔍 Key Observations:
- Supply ➡️ Demand Flip: The green zone previously acted as a supply region but was recently respected as demand, showcasing a classic SD conversion
- Double Bottom + Higher Lows (Structure): A W-bottom has formed on the weekly timeframe (WTF), with rising higher lows (marked in
#ARIHANTCAPARIHANTCAP is a small cap stock that is looking for explosive move. The fundamental and technicals are looking well poised.
Please note - This is my analysis and not to be considered as recommendations. Please do your Due Diligence.

Arihant Capital Markets Ltd AnalysisFOR LEARNING PURPOSE
ARIHANT CAPITAL LTD - The current price of ARIHANT CAPITAL LTD is 99.26 rupees
I am going to buy this stock because of the reasons as follows-
1. Its coming out from a good consolidation base
2. It broke a strong resistance zone with great vol

Arihant cap target 150Arihant target 150. Posted excellent results. New ceo took over. Bouncing back from support! Blind buy

All Time High Breakout With High Volume & RSI 70+Key Highlights : 🔰
🔷 NSE:ARIHANTCAP
🔶 RSI 70+ 🔥
🔶 Good Volume 🔥
🔶 Monthly Bollinger Bands Blast 🔥
🔶 Above All Important EMA's
🔶🔷 ENTRY : ₹ 98 - ₹ 103
🔷🔶 SL : ₹ 90
🔶🔷 Target : 25 - 30%
Disclaimer: This is NOT investment advice. This post is meant for learning purposes only. Invest your ca

A BREAKOUT WITH VOLUME - ARIHANT CAPITAL.NSE:ARIHANTCAP
❇️ Strong breakout on weekly chart.
❇️ Flag and poll pattern in 30mint time frame.
❇️ Stock can achive 108-115 targets in upcoming days.
❇️ Short and log terms targets 140-160-190++.
❇️ Nearby support 88-90.
❇️ Above 95 we can see a real move🔥
👉🏻 @thetradeforecast 🇮🇳

ARIHANTCAP - Inverted Cup and Handle -Wkly-Breakout - LongARIHANTCAP - Inverted Cup and Handle -Wkly-Breakout - Long
It has two pattern -Symmetrical triangle and Inv CnH.
Name - ARIHANTCAP
Pattern - Inverted head and Shoulder
Timeframe - Wkly
Status - Breakout with good volume
Cmp - 99.7
Target - 138.3
SL - 75.5/85
Pattern : Inv Head a

Arihant capital markets weekly chart is looking goodArihant capital markets showing good strenght in volume and price ready for 150 add till 76

Long ArihantIncreasing Volume.
Good sector , Competitors are rising isec , motilal osw, geojit etc
arihant at infliction point , it can give good returns when it breaks PDH (previous day high)
cmp 80.8
Sl 71 10%
target 105 30%
RR 1:3
Holding 2 months - to 6 months

See all ideas
Summarizing what the indicators are suggesting.
Oscillators
Neutral
SellBuy
Strong sellStrong buy
Strong sellSellNeutralBuyStrong buy
Oscillators
Neutral
SellBuy
Strong sellStrong buy
Strong sellSellNeutralBuyStrong buy
Summary
Neutral
SellBuy
Strong sellStrong buy
Strong sellSellNeutralBuyStrong buy
Summary
Neutral
SellBuy
Strong sellStrong buy
Strong sellSellNeutralBuyStrong buy
Summary
Neutral
SellBuy
Strong sellStrong buy
Strong sellSellNeutralBuyStrong buy
Moving Averages
Neutral
SellBuy
Strong sellStrong buy
Strong sellSellNeutralBuyStrong buy
Moving Averages
Neutral
SellBuy
Strong sellStrong buy
Strong sellSellNeutralBuyStrong buy
Displays a symbol's price movements over previous years to identify recurring trends.
Frequently Asked Questions
The current price of ARIHANTCAP is 116.26 INR — it has increased by 2.22% in the past 24 hours. Watch Arihant Capital Markets Limited stock price performance more closely on the chart.
Depending on the exchange, the stock ticker may vary. For instance, on NSE exchange Arihant Capital Markets Limited stocks are traded under the ticker ARIHANTCAP.
ARIHANTCAP stock has risen by 5.41% compared to the previous week, the month change is a 9.37% rise, over the last year Arihant Capital Markets Limited has showed a 7.65% increase.
ARIHANTCAP reached its all-time high on Oct 17, 2024 with the price of 124.80 INR, and its all-time low was 22.25 INR and was reached on Jun 18, 2021. View more price dynamics on ARIHANTCAP chart.
See other stocks reaching their highest and lowest prices.
See other stocks reaching their highest and lowest prices.
ARIHANTCAP stock is 4.54% volatile and has beta coefficient of 1.48. Track Arihant Capital Markets Limited stock price on the chart and check out the list of the most volatile stocks — is Arihant Capital Markets Limited there?
Today Arihant Capital Markets Limited has the market capitalization of 12.11 B, it has increased by 4.22% over the last week.
Yes, you can track Arihant Capital Markets Limited financials in yearly and quarterly reports right on TradingView.
ARIHANTCAP net income for the last quarter is 127.03 M INR, while the quarter before that showed 77.01 M INR of net income which accounts for 64.94% change. Track more Arihant Capital Markets Limited financial stats to get the full picture.
Yes, ARIHANTCAP dividends are paid annually. The last dividend per share was 0.50 INR. As of today, Dividend Yield (TTM)% is 0.43%. Tracking Arihant Capital Markets Limited dividends might help you take more informed decisions.
Arihant Capital Markets Limited dividend yield was 0.73% in 2024, and payout ratio reached 8.87%. The year before the numbers were 0.91% and 7.38% correspondingly. See high-dividend stocks and find more opportunities for your portfolio.
As of Oct 5, 2025, the company has 421 employees. See our rating of the largest employees — is Arihant Capital Markets Limited on this list?
EBITDA measures a company's operating performance, its growth signifies an improvement in the efficiency of a company. Arihant Capital Markets Limited EBITDA is 655.13 M INR, and current EBITDA margin is 35.95%. See more stats in Arihant Capital Markets Limited financial statements.
Like other stocks, ARIHANTCAP shares are traded on stock exchanges, e.g. Nasdaq, Nyse, Euronext, and the easiest way to buy them is through an online stock broker. To do this, you need to open an account and follow a broker's procedures, then start trading. You can trade Arihant Capital Markets Limited stock right from TradingView charts — choose your broker and connect to your account.
Investing in stocks requires a comprehensive research: you should carefully study all the available data, e.g. company's financials, related news, and its technical analysis. So Arihant Capital Markets Limited technincal analysis shows the strong buy rating today, and its 1 week rating is strong buy. Since market conditions are prone to changes, it's worth looking a bit further into the future — according to the 1 month rating Arihant Capital Markets Limited stock shows the buy signal. See more of Arihant Capital Markets Limited technicals for a more comprehensive analysis.
If you're still not sure, try looking for inspiration in our curated watchlists.
If you're still not sure, try looking for inspiration in our curated watchlists.