#ARIHANTCAPARIHANTCAP is a small cap stock that is looking for explosive move. The fundamental and technicals are looking well poised.
Please note - This is my analysis and not to be considered as recommendations. Please do your Due Diligence.
ARIHANTCAP trade ideas

Arihant Capital Markets Ltd AnalysisFOR LEARNING PURPOSE
ARIHANT CAPITAL LTD - The current price of ARIHANT CAPITAL LTD is 99.26 rupees
I am going to buy this stock because of the reasons as follows-
1. Its coming out from a good consolidation base
2. It broke a strong resistance zone with great volume and now retesting that level
3. It is showing better relative strength as it stood strong in volatile times
4. The risk and reward is favourable
5. The recent results has been great and it will act as some catalyst
6. The stock has not done much in last few years but it looks like that it can perform better in coming months
I will buy it with minimum target of 35-40% and then will trail after that.
My SL is at 86.50 rupees
I will be managing my risk. NSE:ARIHANTCAP

Arihant cap target 150Arihant target 150. Posted excellent results. New ceo took over. Bouncing back from support! Blind buy

All Time High Breakout With High Volume & RSI 70+Key Highlights : 🔰
🔷 NSE:ARIHANTCAP
🔶 RSI 70+ 🔥
🔶 Good Volume 🔥
🔶 Monthly Bollinger Bands Blast 🔥
🔶 Above All Important EMA's
🔶🔷 ENTRY : ₹ 98 - ₹ 103
🔷🔶 SL : ₹ 90
🔶🔷 Target : 25 - 30%
Disclaimer: This is NOT investment advice. This post is meant for learning purposes only. Invest your capital at your own risk.
Happy learning. Cheers!!
Shyorawat Arun Singh ❤️
(@Shyorawat_ArunSingh)
Founder : Shyorawat Investing School

A BREAKOUT WITH VOLUME - ARIHANT CAPITAL.NSE:ARIHANTCAP
❇️ Strong breakout on weekly chart.
❇️ Flag and poll pattern in 30mint time frame.
❇️ Stock can achive 108-115 targets in upcoming days.
❇️ Short and log terms targets 140-160-190++.
❇️ Nearby support 88-90.
❇️ Above 95 we can see a real move🔥
👉🏻 @thetradeforecast 🇮🇳

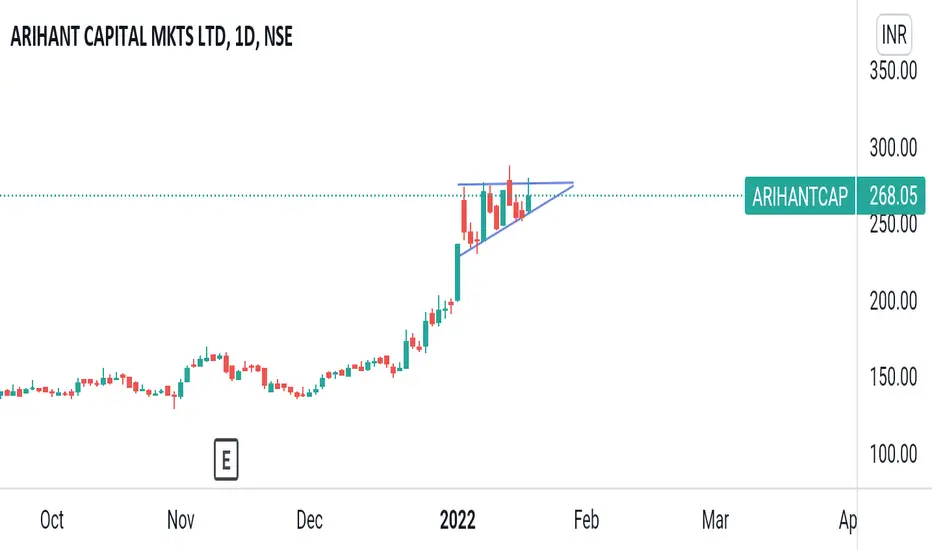
ARIHANTCAP - Inverted Cup and Handle -Wkly-Breakout - LongARIHANTCAP - Inverted Cup and Handle -Wkly-Breakout - Long
It has two pattern -Symmetrical triangle and Inv CnH.
Name - ARIHANTCAP
Pattern - Inverted head and Shoulder
Timeframe - Wkly
Status - Breakout with good volume
Cmp - 99.7
Target - 138.3
SL - 75.5/85
Pattern : Inv Head and shoulder
The Inverted Head and Shoulders pattern is a bullish reversal pattern
Fundamentals
Here are some key fundamentals of Arihant Capital Markets Limited (ARIHANTCAP):
Market Capitalization: ₹787.09 crore.
Share Price: Around ₹76 as of the latest trading session.
Price to Earnings (P/E) Ratio: 12.40.
Revenue: ₹200.72 crore for the trailing twelve months.
Net Profit: ₹47.82 crore for the same period.
Dividend Yield: 0.75%.
Return on Equity (ROE): 18.12%.
These metrics indicate a solid financial performance with a focus on profitability and growth.

Arihant capital markets weekly chart is looking goodArihant capital markets showing good strenght in volume and price ready for 150 add till 76

Long ArihantIncreasing Volume.
Good sector , Competitors are rising isec , motilal osw, geojit etc
arihant at infliction point , it can give good returns when it breaks PDH (previous day high)
cmp 80.8
Sl 71 10%
target 105 30%
RR 1:3
Holding 2 months - to 6 months

vcp BUY Key Elements of a VCP
Understanding the key elements of a VCP is crucial for successful trading. Here are some of the key elements:
Tightening from left to right within the base: You want to see multiple contractions, at least two, within the base.
Relative strength and accumulation signs: Watch for these signs before this price base and within the overall pricing structure.
Volume dry-ups and bursts upwards within the base: On the downtrends within the base, you want to see declining volume. From left to right, you want to see a downward trend line in terms of volume until that pivot point where you want to see a surge upwards in volume.
A very tight last contraction: Ideally, this should be less than 10% from the prior high to that low of that contraction. This shows that the sellers have really dried up and the stock is ready to make a large directional move if that demand comes in as shown by the volume.
How to Catch a VCP Breakout
Catching a Volatility Contraction Pattern (VCP) breakout can be a game-changer in your trading strategy. Here are the steps to effectively catch a VCP breakout:
Identify Candidates: The first step is to identify potential candidates for a VCP breakout. This should ideally be done when the market is closed, allowing you to analyze the market without the pressure of real-time changes.
Set Alerts: Once you have identified potential candidates, set alerts at price levels right below the proper pivot point. These alerts will notify you when the price reaches a certain level, allowing you to act quickly when a breakout occurs.
Plan Your Trades: Planning your trades in advance is crucial. This includes determining your stop loss position sizing. A stop loss order is an order placed with a broker to buy or sell a stock once it reaches a certain price, helping you limit your loss on a stock.
Look for Large Volume: On the breakout, you want to see very large volume. Large volume indicates strong investor interest and can be a sign of a start of a new trend. Look for above-average volume as it pushes through the pivot point.
Execute the Trade: Once the stock pushes through the pivot point on high volume and early on in the day, it's time to execute the trade. This is all about timing and acting quickly to take advantage of the breakout.
Remember, catching a VCP breakout involves careful planning, quick action, and constant monitoring of the market. With these steps, you can effectively catch a VCP breakout and potentially achieve significant returns.
Managing Risk with VCP Breakouts
Risk management is crucial in any trading strategy. With VCP breakouts, you always want to set an initial stop loss when the setup has failed. Set alerts right at the pivot point so if it crosses back under, you're able to watch that stock on your screen. Know when the setup has failed beforehand so if a stock reverses from a VCP, you're protecting your downside and not sitting through a long basing period and a significant drawdown.
Putting it all Together: Mastering the Volatility Contraction Pattern
The Volatility Contraction Pattern (VCP) is a powerful tool for traders looking to capitalize on stock breakouts. It's a strategy that, when understood and applied correctly, can potentially yield significant returns.
Understanding the Key Elements of a VCP: A VCP is characterized by a tightening of price range, or volatility, from left to right within a price base. It's crucial to understand these key elements and how they interact to form a VCP. This includes recognizing patterns like the ‘cup and handle pattern‘ or the ‘high tight flag‘, both of which can be precursors to a VCP.
Learning How to Catch a VCP Breakout: Catching a VCP breakout involves identifying potential breakout candidates, setting alerts at price levels right below the pivot point, planning your trades in advance, and executing the trade when the breakout occurs. This process requires both strategic planning and quick action.
Managing Risk Effectively: Trading is not just about making profits, but also about managing risks and protecting your investment. This involves setting an initial stop loss when the setup has failed, moving up stops to protect profits, and knowing when the setup has failed to avoid significant drawdowns.
Establishing Routines: As with any trading strategy, it’s important to establish weekly and daily routines to identify and execute potential VCP breakouts. This involves regular market analysis, keeping up with financial news, and constantly monitoring your portfolio.
Remember, successful trading involves more than just recognizing patterns. It requires a deep understanding of market dynamics, a well-planned strategy, and the discipline to stick to your plan. Always do your research and make informed decisions when trading. With the right approach and mindset, the Volatility Contraction Pattern can be a valuable addition to your trading toolkit. Happy trading!

Company Growth Is Impressive & Technically Also Looks Strong ✅ Arihant Capital Markets is forming a symmetrical triangle pattern with resistance at INR 80 and strong support at INR 60. The stock has shown a bullish breakout signal, suggesting potential upward movement towards INR 90.
✅ Arihant Capital Markets recently reported a 120.9% YoY increase in net sales for Q4 FY24, reaching INR 62.41 crore, highlighting its robust financial performance. The stock reached its 52-week high of INR 84.30 on February 5, 2024, showing strong investor sentiment.

Bullish Momentum - Strong Technicals and Robust FundamentalsTrend Breakout: Arihant Capital has broken out above the crucial level of 80, signaling a potential shift in the trend to the upside.
Weekly Candlestick Strength: The stock exhibits a strong closing with an engulfing candlestick pattern on the weekly timeframe, indicating significant bullish sentiment among investors.
RSI Breakout and Volume Surge: The Relative Strength Index (RSI) breakout, accompanied by high trading volume, suggests increasing buying pressure and momentum behind the price action.
Robust Fundamentals: Arihant Capital demonstrates impressive revenue and profit growth, with Q2 figures showing exponential year-over-year growth in both revenue and profit before tax (PBT), as well as profit after tax (PAT). These strong fundamentals provide a solid foundation for the stock's upward trajectory.
Trade Idea: Considering the bullish technical and fundamental factors, Arihant Capital presents an attractive opportunity for bullish positions. Traders may consider long positions, aiming for continued upside momentum fueled by the breakout and strong financial performance. Implementing appropriate risk management strategies is advised to mitigate potential downsides.
Note: This analysis is based on technical indicators, candlestick patterns, and fundamental data. Traders should conduct their own due diligence and consider risk management practices before making any trading decisions.

Flag & Pole Pattern In Arihant Capital- Keep In Radar-flag and pole pattern breakout possible above 79
-strong closing in weekly basis
-engulfing candle- looks promising for upside momentum
-rise in rsi along with volume
- i am expecting 110 level soon
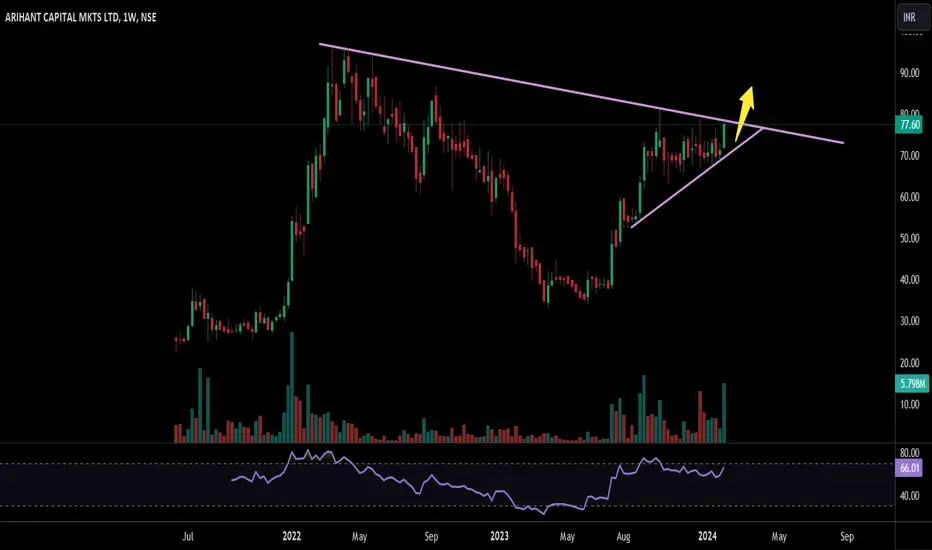
#ARIHANTCAP (Weekly)⚡️ATH breakout expected
⚡️Made base near 34 levels after good correction from ATH
⚡️140% return since Jun 23
⚡13 Weeks Tight Consolidation
🔴 SL 67
🟡 CMP 72
🟢 TGT 80/90/108

BREAKOUT, ARIHANT CAPITAL, 65% RETURNSBUY - ARIHANT CAPITAL MARKETS LTD
CMP - Rs. 70
Target - 1: Rs. 90
Target - 2: Rs. 115
.
Timeframe - 3 months - 8 months
.
Technicals - Trendline Breakout
.
This is just a view by an expert analyst, please invest at your own risk.
.
Follow me for more!

100% returns can be done in upcoming monthsEntry 45
SL 30
Target 100
It's financial are quite impressive and company's operating profit margin is also very good.


Expecting Breakout ✌✌This scrip is expected to give breakout in the coming days. So traders keep on your radar to catch the momentum. Thanks to all 🙏🙏
Arihantcapital can expect 5-15% can see it has already corrected from an high of 188.85
currently good to take or wait for breakout
can keep sl at 133 ,,tgt -1 160 ,or can add on dip if breaks down at 125 instead of stop loss already stock corrected so low chance that it will break down
rsi shows positive divergence and macd turning positive
disclaimer- this is not any investment call or idea , this just my view and it can go wrong ,this is only for educational purposes trade at your own risk

Arihant Capital Buy - 137-135
SL - Below !34 Daily Closing Basis.
Target - 155-160++++
Newly Listed Company Looking Good On Charts ..
Fundamentals Of The Company Checked ..
Can Be Good Long Term Portfolio Pick Too..
IPO Investment ..

pattern,volume and market condition all favourable with low P/E looks good above 180 with great volume.
stpl at 164.

Just check the flag pattern at end this month pin bar is formingJust check the flag pattern at end this month pin bar is going to appear .due to cup flag has good strength to breakout from consolidation zone
