Ashok Leyland Ltd - Breakout Setup, Move is ON...#ASHOKLEY trading above Resistance of 192
Next Resistance is at 289
Support is at 141
Here are previous charts:
Chart is self explanatory. Levels of breakout, possible up-moves (where stock may find resistances) and support (close below which, setup will be invalidated) are clearly def
Ashok Leyland Limited
No trades
Next report date
—
Report period
—
EPS estimate
—
Revenue estimate
—
5.55 INR
31.07 B INR
484.82 B INR
3.52 B
About Ashok Leyland Limited
Sector
CEO
Shenu Agarwal
Website
Headquarters
Chennai
Founded
1948
IPO date
Nov 3, 1994
Identifiers
2
ISIN INE208A01029
Ashok Leyland Ltd. engages in the manufacture and sale of commercial, defense vehicles, and power solutions. The company was founded by Raghunandan Saran on September 7, 1948 and is headquartered in Chennai, India.
Related stocks

Part 2 Ride The Big Moves 1. Breakouts
Option buyers profit most during:
Higher highs
Higher lows
Volume expansion
Trend confirmation
2. Reversals
Put buyers benefit when:
Market forms double tops
Distribution zone breaks
Supply zone rejection occurs
3. Volume Profile
Important levels:
POC (Point of Control) – m

BUY TODAY SELL TOMORROW for 5%DON’T HAVE TIME TO MANAGE YOUR TRADES?
- Take BTST trades at 3:25 pm every day
- Try to exit by taking 4-7% profit of each trade
- SL can also be maintained as closing below the low of the breakout candle
Now, why do I prefer BTST over swing trades? The primary reason is that I have observed that

Stories Shape the TradeMarkets move on belief before they move on numbers.
Behind every price movement is a story shaping how traders think, feel, and act. Below is a clear, point-wise and impressive explanation of how stories shape the trade in financial markets.
1. Markets Are Built on Human Psychology
Traders are hum

ASHOKLEY 1 Month Time Frame 📊 Current Price & Trend (as of latest market close)
Current trading level: ~₹163‑164 on NSE.
Price has rallied strongly and recently hit a 52‑week/all‑time high.
📈 1‑Month Key Levels (Short‑Term Technicals)
🔹 Immediate Resistance (Upside Targets)
R1 ~ ₹165‑167: Short‑term pivot resistance z
ASHOKLEY Price Action1. Trend Bullish
2. Breakout & reveral set up
3. Resistance turning into support
4. Higher protected lows through out the trend and still continues

ASHOKLEY | 30 Dec Expiry | Options Trade BullishA 161/159 bull put spread aligns with the current trend structure.
Price continues to push into higher highs with strong momentum, supported by firm ROC and an RSI holding in bullish territory. IVs remain steady with a mild downside skew, which makes short-premium structures efficient here.
The payo

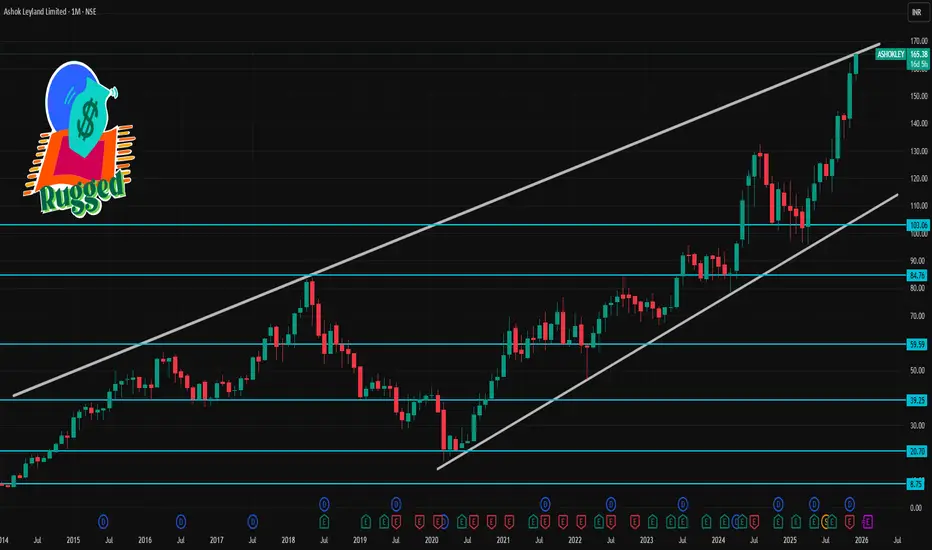
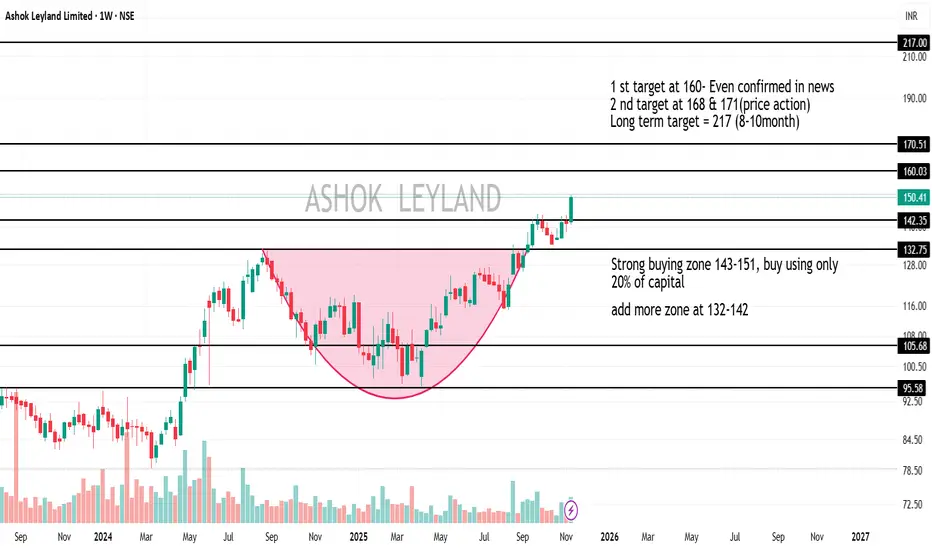
Targets for ASHOKLEY.NS Based on price action & chart patternThe analysis is completely on price action & support/resistance levels along with volume validation of the recent weeks of the pattern breakout. I am sharing this only for the purpose of learning & this isn't a buy/sell recommendation; consult your financial advisor before taking any trade decision.
Best Timeframes for Candle PatternsCommon Mistakes Traders Make
Relying only on candle patterns without context
Trading patterns blindly without trend confirmation
Not waiting for candle close
Ignoring volume
Forcing patterns where there are none
Using too many candlestick rules
Candlestick patterns should be signals, not guar

Ashok Leyland Ltd. (ASHOKLEY)Time Cycle is a routine that allows you to map the movement of a stock by measuring the high and low levels of the stock on a day or period. However, it does not prove whether a reversal will occur in the next time cycle; it is only a probability. But it makes you profitable 80% of the time.
Regard

See all ideas
Summarizing what the indicators are suggesting.
Neutral
SellBuy
Strong sellStrong buy
Strong sellSellNeutralBuyStrong buy
Neutral
SellBuy
Strong sellStrong buy
Strong sellSellNeutralBuyStrong buy
Neutral
SellBuy
Strong sellStrong buy
Strong sellSellNeutralBuyStrong buy
An aggregate view of professional's ratings.
Neutral
SellBuy
Strong sellStrong buy
Strong sellSellNeutralBuyStrong buy
Neutral
SellBuy
Strong sellStrong buy
Strong sellSellNeutralBuyStrong buy
Neutral
SellBuy
Strong sellStrong buy
Strong sellSellNeutralBuyStrong buy
Displays a symbol's price movements over previous years to identify recurring trends.
Frequently Asked Questions
The current price of ASHOKLEY is 211.02 INR — it has increased by 1.53% in the past 24 hours. Watch Ashok Leyland Limited stock price performance more closely on the chart.
Depending on the exchange, the stock ticker may vary. For instance, on NSE exchange Ashok Leyland Limited stocks are traded under the ticker ASHOKLEY.
ASHOKLEY stock has risen by 4.10% compared to the previous week, the month change is a 12.00% rise, over the last year Ashok Leyland Limited has showed a 106.88% increase.
We've gathered analysts' opinions on Ashok Leyland Limited future price: according to them, ASHOKLEY price has a max estimate of 245.00 INR and a min estimate of 125.00 INR. Watch ASHOKLEY chart and read a more detailed Ashok Leyland Limited stock forecast: see what analysts think of Ashok Leyland Limited and suggest that you do with its stocks.
ASHOKLEY reached its all-time high on Feb 4, 2026 with the price of 205.19 INR, and its all-time low was 0.69 INR and was reached on Apr 28, 1999. View more price dynamics on ASHOKLEY chart.
See other stocks reaching their highest and lowest prices.
See other stocks reaching their highest and lowest prices.
ASHOKLEY stock is 3.77% volatile and has beta coefficient of 0.92. Track Ashok Leyland Limited stock price on the chart and check out the list of the most volatile stocks — is Ashok Leyland Limited there?
Today Ashok Leyland Limited has the market capitalization of 1.21 T, it has increased by 2.98% over the last week.
Yes, you can track Ashok Leyland Limited financials in yearly and quarterly reports right on TradingView.
Ashok Leyland Limited is going to release the next earnings report on May 22, 2026. Keep track of upcoming events with our Earnings Calendar.
ASHOKLEY earnings for the last quarter are 1.36 INR per share, whereas the estimation was 1.57 INR resulting in a −13.56% surprise. The estimated earnings for the next quarter are 2.25 INR per share. See more details about Ashok Leyland Limited earnings.
Ashok Leyland Limited revenue for the last quarter amounts to 115.93 B INR, despite the estimated figure of 113.86 B INR. In the next quarter, revenue is expected to reach 136.96 B INR.
ASHOKLEY net income for the last quarter is 7.56 B INR, while the quarter before that showed 6.11 B INR of net income which accounts for 23.68% change. Track more Ashok Leyland Limited financial stats to get the full picture.
Ashok Leyland Limited dividend yield was 3.06% in 2024, and payout ratio reached 59.07%. The year before the numbers were 4.06% and 82.17% correspondingly. See high-dividend stocks and find more opportunities for your portfolio.
As of Feb 12, 2026, the company has 34.87 K employees. See our rating of the largest employees — is Ashok Leyland Limited on this list?
EBITDA measures a company's operating performance, its growth signifies an improvement in the efficiency of a company. Ashok Leyland Limited EBITDA is 99.42 B INR, and current EBITDA margin is 19.14%. See more stats in Ashok Leyland Limited financial statements.
Like other stocks, ASHOKLEY shares are traded on stock exchanges, e.g. Nasdaq, Nyse, Euronext, and the easiest way to buy them is through an online stock broker. To do this, you need to open an account and follow a broker's procedures, then start trading. You can trade Ashok Leyland Limited stock right from TradingView charts — choose your broker and connect to your account.
Investing in stocks requires a comprehensive research: you should carefully study all the available data, e.g. company's financials, related news, and its technical analysis. So Ashok Leyland Limited technincal analysis shows the buy rating today, and its 1 week rating is strong buy. Since market conditions are prone to changes, it's worth looking a bit further into the future — according to the 1 month rating Ashok Leyland Limited stock shows the strong buy signal. See more of Ashok Leyland Limited technicals for a more comprehensive analysis.
If you're still not sure, try looking for inspiration in our curated watchlists.
If you're still not sure, try looking for inspiration in our curated watchlists.