ASIANPAINT SHORTENTRY TARGET SL Mention in the chart.
ALWAYS TAKE TRADE WITH CONFIRMATION
Note : Trading in any financial market is very risky. I post ideas for educational purpose only. It is not financial advice. Do not hold us responsible for any potential loss you may incur. Please consult your financial adviser before trading.
ASIANPAINT trade ideas

Asian Paints W PatternAsian Paints has formed W pattern on daily chart. We can take a swing trade here.
Entry:
We can go long after close of strong bullish candle near neckline of W pattern.
Target:
We can keep Target1, Target2 near the next resistance zones as marked on chart.
Stoploss:
We can keep stoploss below the neckline of W pattern.
Please Like 👍 & Follow Me ✅.

ASIAN PAINT IS BREACKOUT ZONEASIAN PAINT IS BREACKOUT ZONE (if sustain in the same label it will give good move up side


Asian Paints Cmp 3200 Triple Top, Bearish Candle & RSI BreakdownAsian Paints Cmp 3200 dated 5-6-2023
1. Trippel Top Made
2. Bearish Candle @ Triple Top
3. RSI Breakdown
Sell below 3195 tgt 3175-3140-3110-3085 SL 3250
It is just a view, please trade at your own risk.

Asian PaintWeekly chart rsi above 60
macd above 0
price above 50 ma
daily chart price above 50,100,200 ma
macd crossed 0 just 1 day before
rsi above 70
above all make it perfect to buy for 3 to 10 days

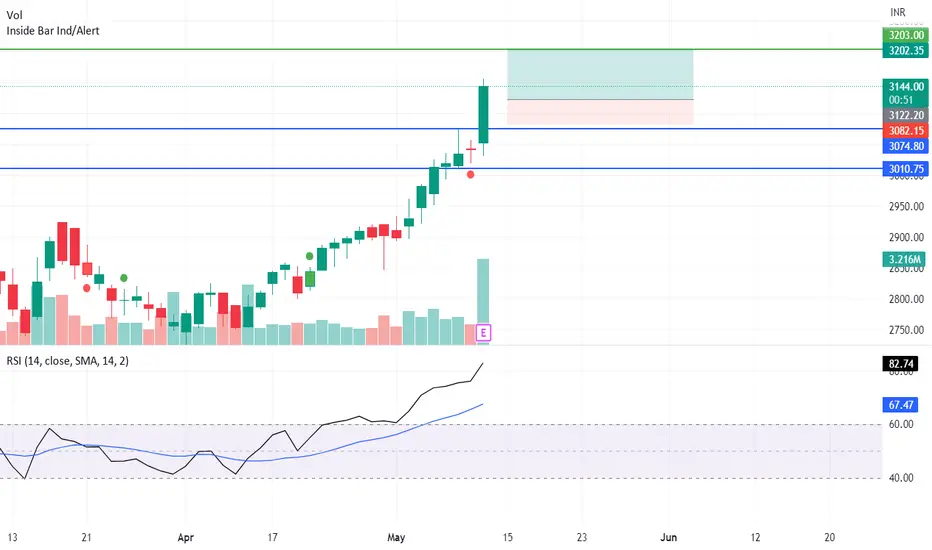
VIEW ON ASIAN PAINTSGood chart
Stock has crossed its 12 MAY high
Add more once it crosses 3200 levels
Target 3225/3300
Stop loss 3140
I am just representing my views
For educational purpose only.


Asian paint to take long entryAsian paint in the consolidation stage can be expected a BO very soon. Long after the BO between 3140-3145 with SL of 3040. Target 3250-3300 can be soon. Keep the stock in your watch list. The structure of the stock is bullish. This is for your educational purpose only.

ASIAN PAINT DTFAfter analyzing Asian Paint's stock, there are indications that a potential breakout may occur in the near future. Several factors suggest that the stock's price could experience a significant movement.
However, it's important to note that stock market investments come with inherent risks, and accurately predicting breakouts or price movements is challenging. It's advisable to consult with a financial advisor or conduct further research to validate the analysis and make informed investment decisions.

asian paints- long for short term MACDS are bullish
price moving up from confirmed pivot support
target and stop loss given

Asianpaints : Horizontal resistance breakoutAsianpaints : Horizontal resistance breakout
Buy above 2987
Targets: 3023/3041
SL: 2970
Disclaimer: Im not SEBI registered, Contact financial advisor before any investment.

ASIAN PAINTSASIAN PAINTS stock can move towards 3100-3200 levels if manages to breakout and sustain above the levels of 2900 , Can go long above with small SL

ASIANPAINT FOR SWINGStock looks good at the current levels for swing action. Good volume and price action seen. Check chart for target.
Asian Paint longAsian Paint is trading near a good support level and crossed the 30 DEMA. At the current stage, price action is looking good to go long if it crosses above 2850 and sustains above it for 30 minutes.
The risk-reward also looks favorable.

ASIAN PAINT BREAKOUTAsian paints is looking bullish by breaking a falling resistance trendline on weekly chart so we can consider it is breakout on falling resistance trendline of triangle and after a breakout of falling resistance trendline we can go long in it for the target of 3051 with the stop loss of 2821 below a weekly candle close basis.
TARGETS AND STOP LOSS
𝑵𝑶𝑻𝑬- 𝑶𝑵𝑳𝒀 𝑭𝑶𝑹 𝑬𝑫𝑼𝑪𝑨𝑻𝑰𝑶𝑵 𝑷𝑼𝑹𝑷𝑶𝑺𝑬

ASIANPAINT ready for breakout May 8th to 12th 2023ASIANPAINT looks good if it's break the trend line resistance of 3022 to 3044.
Buy above 3060 SL 3030/3022 Target 30107,3159,3205,3244 Risk to reward ratio is 1:2 to 1:6 If you keep trailing your SL.

ASIAN PAINTS TARGET 3470ASIAN PAINTS symmetrical triangle breakout in weekly with bullish. It will reach 3470

Asian paint - Ready for a massive breakoutAsianpaint getting ready for big breakout. There is hammer made in 30min and 2 hour time frame. Immediate target 2909, 2930 and if it sustain 2930 then it will touch 2980.

intradayboth side potential
avoid first 15min breakout
wait for 15 min candle closing
targets are marked
follow risk management
do your own analysis
do workout
do meditation
start reading book


AsianPaints BearFlagAsianpaints is forming a bear flag on weekly timeframe, previous weekly inside bar on weekly timeframe which it did broke out on upper side has failed now and more and more consolidation near support trendline is giving a weakness signal here.
Any breakdown of the flag and trendline can invite short side target well below 2400 .

asian paint chart analysisbullish above 2972 as there is major resistance need closing above resistance zone idea is for educational purpose only
