ASIANPAINT trade ideas


asianpaints analysisthis is a detailed analysis of Asian paints. stock creating rounding off pattern with good volume support


Asian paint longAsian paint has shown a breakout on daily chart with huge volume for some days. There can be a big upside potential over the next few days.

LONG ASIANPAINTS ASIANPAINTS IS GOING TO BREAK THE TRIANGLE AND WILL MAKE NEW HIGHER HIGHS AND HIGHER LOWS .

Entered asian paints todayBought asian paints towards day end with the target of ATH. Now only upside seems path of least resistance. Entry level 2600 with stoploss 3 to 4%.
let see how it pans out tomorrow.
Do follow me if you like my content.
...............................................................
Standard disclaimer
I’m not a SEBI registered advisor. I’m also a market learner like everybody else. The analysis given below is based on my own market experience in last few years. I also advise before taking a trade please carry out your own analysis and trade based on your own risk appetite. Trading is all about probabilities and I can be wrong at any time.
I prefer swing trading over intraday trading so most of my analysis is about swing trading only (higher timeframes).
I request you to follow me on my profile to keep me motivated and to post further high momentum swing trading opportunities in the market.
As a rule of thumb never trade more than 10% capital of your account on a single trade and do not risk more than 2% per trade. This can help you to stay longer in the market. The longer you stay in the market more the chances of making profits.
Thank you for supporting me.
#cutyourloserholdyourwinners

AsianPant, coming out of Inverted Head and ShoulderAsianPant, coming out of Inverted Head and Shoulder


Asian paints - Head and Shoulder PatternPrice formed Head and Shoulder pattern and its time to break the trend line to reach the target.
One can wait for the price to close above the resistance before going long.

ASIAN PAINTS LTDASIAN PAINTS LTD
Cup and handle chart pattern formation happening, So BULLISH view can be expected.
STOP LOSS 2443 for LONG positions,
Strong BEARISH can be expected if BELOW 2265 level breaks.


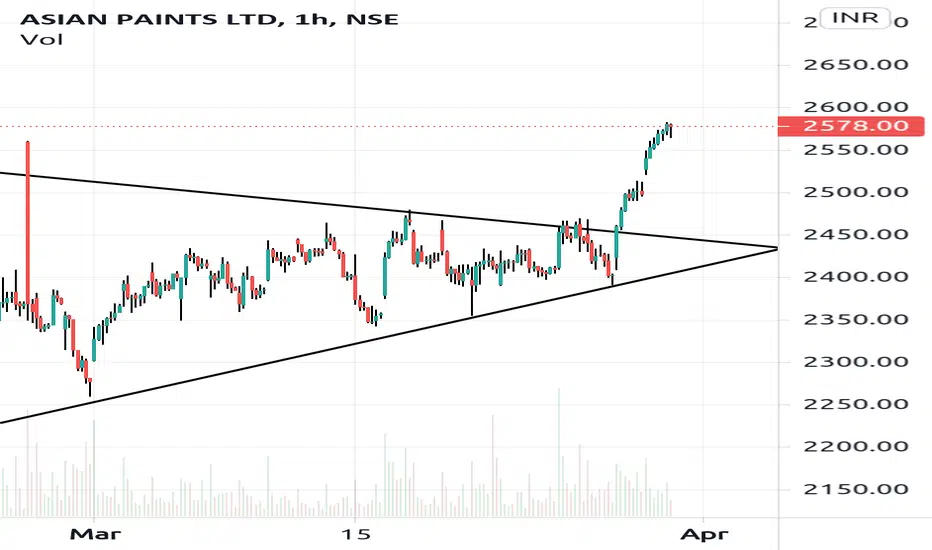
ASIAN Paints Triangular BreakoutThe stock has just given us a visible breakout. Good time to go for long although look for the overall trend of the market as there are rasing covid cases and bond yields too.. If the sentiment is positive go for long and place SL below the Trendline say 2440
Disclaimer: All charts are purely for educational and information purpose only. Invest or Trade at your own risk.

Asian paint looking good coming out by U shape recoveryAsian paint looking good coming out by U shape recovery, supertrend +ve Buy signal


Asian Paints Analysis for next week.Asian Paints View :
Case 1: On 5th April 2021, Asian Paints opens above 2560 or if it starts trading above 2560, then the stock will be volatile and can move sideways or upward move.
Case 2: On 5th April 2021, Asian Paints opens below 2540 or if it starts trading below 2540 then we can expect a downside move. Our focus will be on this case.
Reasons:
1. As we see on 15 min chart, the stock gave a trendline breakdown, and also there is a small gap that can get filled. There is a 0.382 Fibonacci Level on which stock can take support and try to continue its uptrend.
2. If 0.382 Fibonacci Level is broken then there is a high probability that stock may test 0.618 Fibonacci Level as at this level there is a demand-supply zone that is not yet tested.
Conclusion: Wait for the stock to come at 0.618 Fibonacci Level, if any bullish pattern (Bullish Engulfing, Bullish Hammer, Bullish Inverted Hammer) is seen then go Long for 4-5 % gains.


Pattern Identification One can Start with simple Patterns Identification , few are very easily identified , they are
W - a Pattern Looks Like W shape which is corrective in nature
N- a Pattern Looks Like N shape , which resemble strong (sharp) move on second Leg but actually they are an short term corrective move NON impulsive moves
Inverted Patterns of W and N , they are visually can be identified as Invested patterns when seen with the Correction
Again this post is Not Trade Recommendation its Just for Education purpose