Asian PaintIf upmove continue tomorrow than
Buy at CMP (above 2885)
Tgt 2900 , 2925
Sl 2850
Tsl 2865
ASIANPAINT trade ideas

Bearish Wedge on Asian paints Pattern forming - Bearing Wedge
Time Frame - 30 min
Strong Resistance level 2900
Buy at 2770-2740


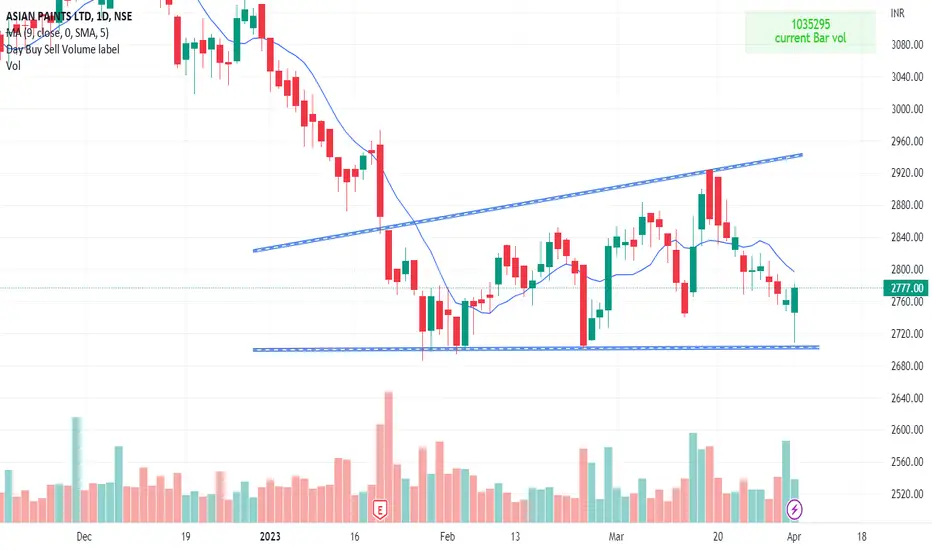
Asian Paints is bottoming.As seen on the chart a bullish harmonic pattern is formed.
Post the low the stock has been in a range forming bullish candle patterns.
On Bollinger band we can see an inside - outside bottom.
and support on the RSI is a cherry on the cake.
The volumes have been low on the last candle hence a small dip to 2750 could be possible
which can be use as a buying opportunity.
The low of the pattern 2680(approx) a close below that can be the stoploss for this trade.
Targets for the trade
38.2% retracement - 3030
50% retracement - 3130
61.8% retracement - 3230
Traders who can ride this further should look for targets at 3500 and 3700
Analyst
Abhay Bhatia

Asian Paints looks good for Buying NSE:ASIANPAINT
ASIAN PAINTS taking support on Trendline 3rd time, above 2780, if sustains on 05-04-2023 looks good for buying.
Today Healthy green candle.

ASIAN PAINTTHE IDEA WILL BE ONLY FOR STUDY PURPOSE . wait for the breakout till then keep your eye on the stock
Asian PaintsAsian Paints shorting opportunity for downside..
When it break level 2773 and sustain.. it will go Downside...
Enjoy trading traders.. Keep add this STOCK in your watch list..
investor are welcome..


Asian paints long setupAsian paints made double bottom on the strong support level.
Target and sl marked on the chart.

ASIAN PAINTS POSSIBLE DOUBLE TOPConfluence of AVWAP drawn from March 2020 lows, 200 WMA and previous swing low made in June 2022 provides a strong support at 2500- 2550 levels. Breach of these levels gives a pattern target is 1500 levels. If the stock is able to hold 2500 level then we may expect sideways movement till either side is taken out convincingly.

Asian Paint retestng triangle breakout?Not sure if it is called retesting,
Please comment if anybody has idea to understand price action in coming days.
I think we can go long above 2875 price with a stop loss at 2830 levels.
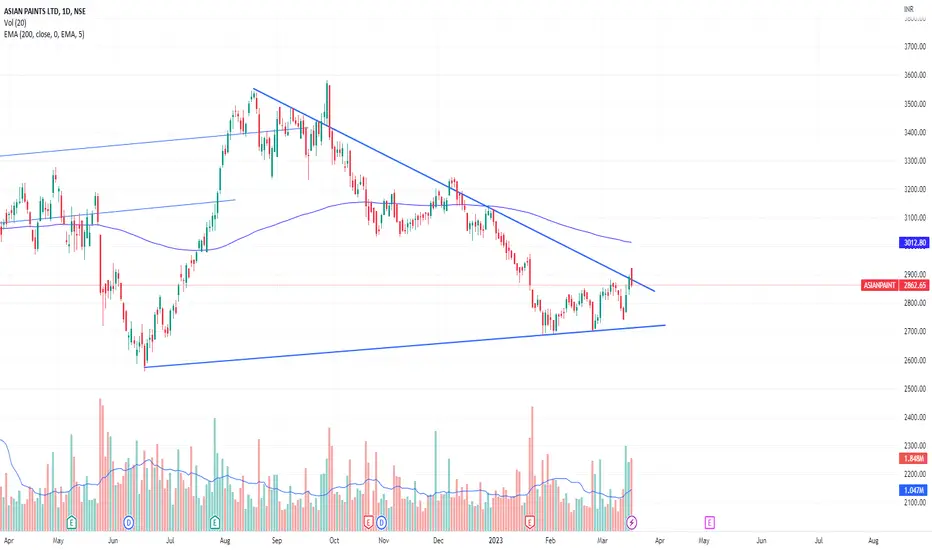
Asian paints Trendline BreakoutTrend line breakout with increase volume on Daily timeframe
target -3200
Buy near - 2870
Stop loss - 2810


Asian Paints BO Retested Asian Paints Breakout Retested. It is running from two days. So tomorrow might be sideways. Rally begins from ext week.

Asian Paints double bottomReverting just above the support zone. It is very bullish signal if can stay above 2835.
SL 2750
Target 3230/3480

ASIAN PAINTS STRATEGYAt 2500 Start your strategy for long. please hedge positions for better risk management, then at 2100 and at 1900 level try to buy more.
lets see

Asian Paints LongStock is at demand zone buyers active at current level and crude oil also down multiple confuluences,
Buy Asian Paints at Current market price stop loss 15 points Target 2800,2830 and 2850.

Asian Paints breakout moveAsian Paints is currently showing strong signs of a breakout on its stock chart, indicating that the company's stock is on the verge of a significant price increase. This is evident across all time frames, from the short-term daily chart to the long-term monthly chart, suggesting that the breakout is likely to be sustained over time.
On the daily chart, Asian Paints' stock has formed a bullish ascending triangle pattern, with the stock price approaching the upper resistance level of the pattern. This indicates that buyers are gaining momentum and are likely to push the stock price above the resistance level in the near future, triggering a breakout. Furthermore, the stock's relative strength index (RSI) is showing positive momentum, with the RSI moving above the 50 level, further supporting the bullish bias.
On the weekly chart, Asian Paints' stock has been trading in a narrow range for several months, forming a consolidation pattern. However, the recent price action has resulted in the stock breaking out of the consolidation pattern, indicating a potential bullish trend reversal. Moreover, the stock's moving averages, such as the 50-week moving average and the 200-week moving average, are starting to converge, suggesting that the stock price could continue to move higher.
On the monthly chart, Asian Paints' stock has been in a long-term uptrend, with the stock price making higher highs and higher lows over the past few years. The recent consolidation and breakout on the shorter-term charts could be seen as a healthy pullback within the context of the long-term uptrend, providing an opportunity for investors to enter at a relatively lower price point.
Overall, the breakout idea for Asian Paints' stock is working really well across all time frames, indicating that this is a significant event for the company. As one of the bigger stocks in the Nifty 50 index, a sustained price increase in Asian Paints' stock could have a positive impact on the overall performance of the index.

ASIANPAINT IN BEARS BRUSH ???!!!Chart does insist me the above titled opinion
Reasons
In Monthly timeframe, Asian paints looks like, is in formation of a DOUBLE TOP!!! ( Making HIGH(Jan 2022)and LOWER HIGH(Sep 2022) respectively)
(shown as image attached in the chart)
1. Asian paints has been travelling in Ascending channel pattern(red and green) taking support at respective levels from 2019.
2. Now currently its is in the down swing in a descending channel(white trendlines).
3. January 2023 Monthly candle - going to be the decider for further move.(if it closes below 2900- we can confirm the bearishness further)
4. In daily time frame, it has formed a Head & Shoulders pattern and given BREAKDOWN!!!
5. By H&S pattern, Target gets to about 200 points(to 2850 level).
6. Green line down near 2900 is acting as support from 2020.
7. DOUBLE TOP (Monthly timeframe) will mostly likely be confirmed if the Green line gets broken.
8. Let's wait and watch whether the monthly candle breaks the green line or not!!!
Asian paints is one of the stocks which has not reached the 52 week high (during recent rally of market)!!!
Take SL as day candle closing out of the white channel.(3090) & Keep Trailing the SL!!
1st Target - 2900,
will update once it reaches this target.
If the Double top works as it does, Asian paints can see 2250 level soon.
Even if we don't trade now, It is better if we don't make any long term investment on Asian paints as of now.(as it is bearish)
Let's wait and watch how it moves!!! What this is going to teach us!!!
Note : Just sharing my view.....Not a Tip nor Advice!!!

Breakout in Asian Paints. Never Miss!!The possible Double bottom pattern breakout.
Asian Paints could be bought at the retest with the
target of the previous point where the supply was
the heaviest. Traders willing to take swing trade
can enter the script. Follow proper R:R, and
quantity can be based on your risk appetite.

Bullish Reversal Setuppossible trend reversal possible as the chart suggests-logic and levels well mentioned in the chart itself

Asian Paints at important level for swing trades.Stock: Asian Paints
Time Frame: 1 HR.
After a bullish day on 28th feb, as expected, it is consolidating (taking multiple rejection from resistance level 2850 but still buyers are holding price). It may give a good upside move for swing trades if it gives breakout and closing above 2851. Not Active yet. Keep an eye!
TARGET 115 points (4 %) for buying side.
For educational purpose only. Take trades on your own Risks.

