ASIANPAINT 1D Time frameToday's Trading Range:
Day's Range: ₹2,498.00 – ₹2,543.50
Opening Price: ₹2,535.10
Previous Close: ₹2,540.50
52-Week Range: ₹2,124.75 – ₹3,394.90
📈 Circuit Limits:
Upper Circuit Limit: ₹2,800.90
Lower Circuit Limit: ₹2,291.70
Trade ideas
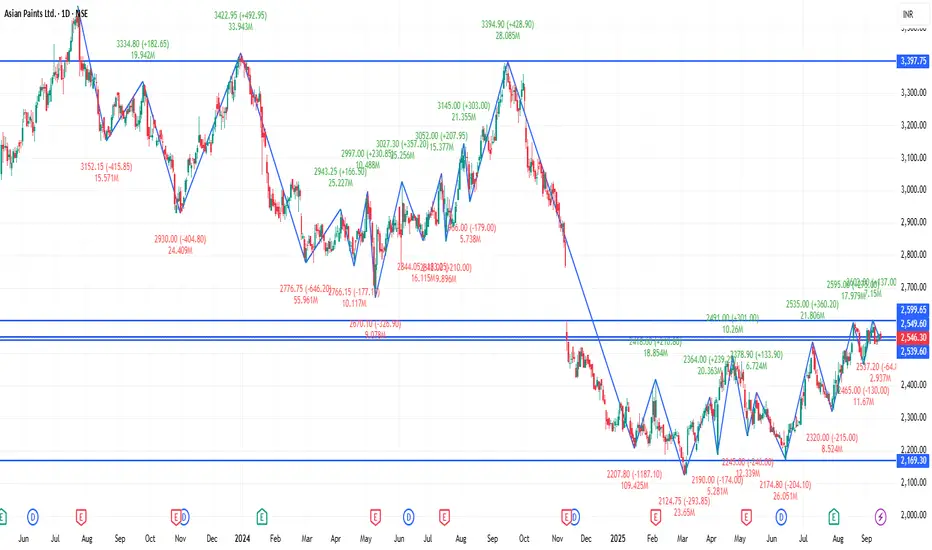
ASIANPAINT 1D Time frameCurrent Status
Price: ~ ₹2,546
It is well below its 52-week high (~₹3,394) and above its 52-week low (~₹2,125)
Market capitalization is large; the stock is considered a large-cap, stable name in decorative paints
Key Metrics
P/E (TTM) is high (≈ 67-70) → indicates expensive valuation relative to earnings
P/B is also elevated (≈ 12-13)
Return on Equity (ROE) ~ 18-20% — reasonable, not exceptional but solid
Bullish Scenario
If Asian Paints can reclaim and hold above ~₹2,550-₹2,600, it may move toward retesting higher resistance levels around ~₹2,750-₹3,000
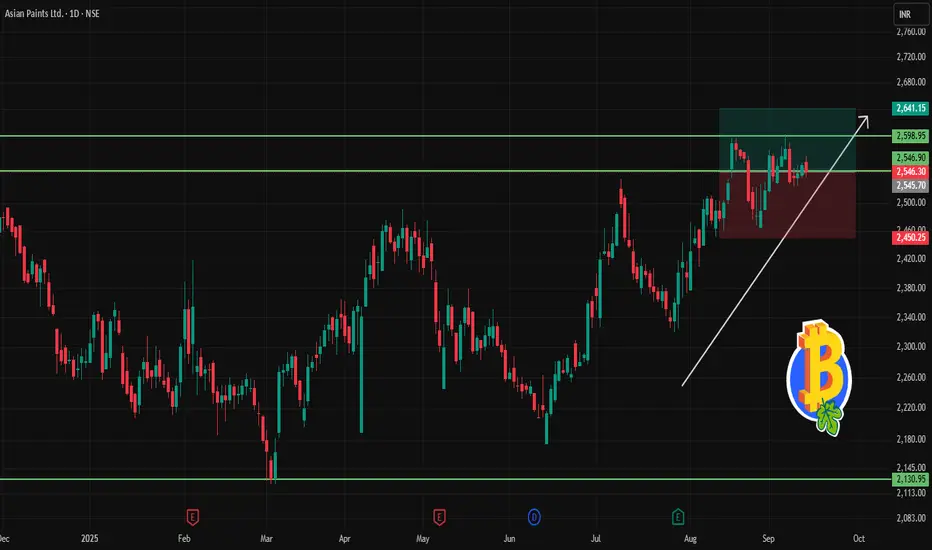
ASIANPAINT 1D Time frameCurrent Price & Trend
Price: ₹2,546.30
Trend: Consolidating near recent highs; trading approximately 25% below its 52-week high of ₹3,394.90.
Momentum: Indicators suggest a neutral to slightly bearish outlook.
Bullish Scenario
Breakout Above ₹2,580: A sustained move above ₹2,580 could target ₹2,600 – ₹2,620 in the short term.
⚠ Bearish Scenario
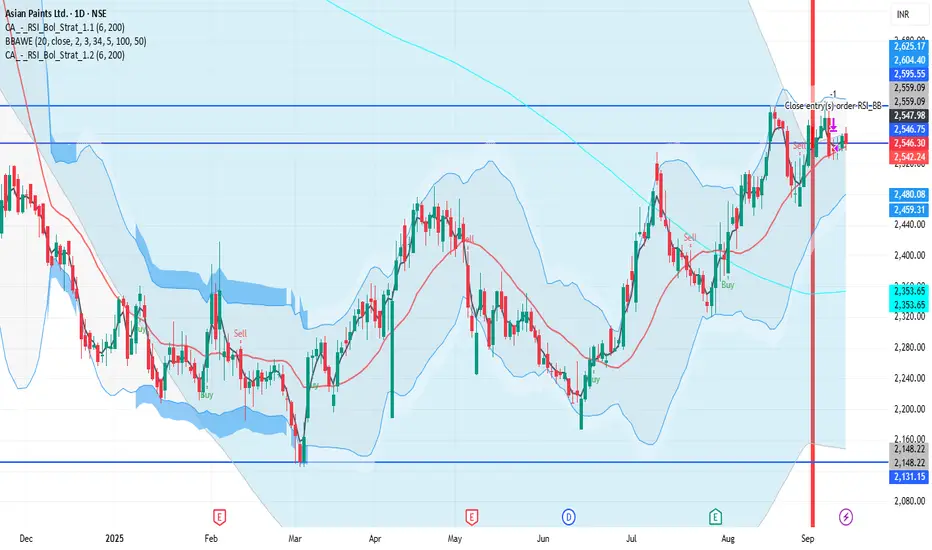
ASIANPAINT 1D Time frame📍 Current Price
₹2,546.30 (closing price)
Short-Term Outlook
Bullish Scenario: A sustained move above ₹2,587.40 could lead to a test of the 52-week high around ₹3,394.90.
Bearish Scenario: A drop below ₹2,505.00 may signal a potential pullback toward ₹2,400.

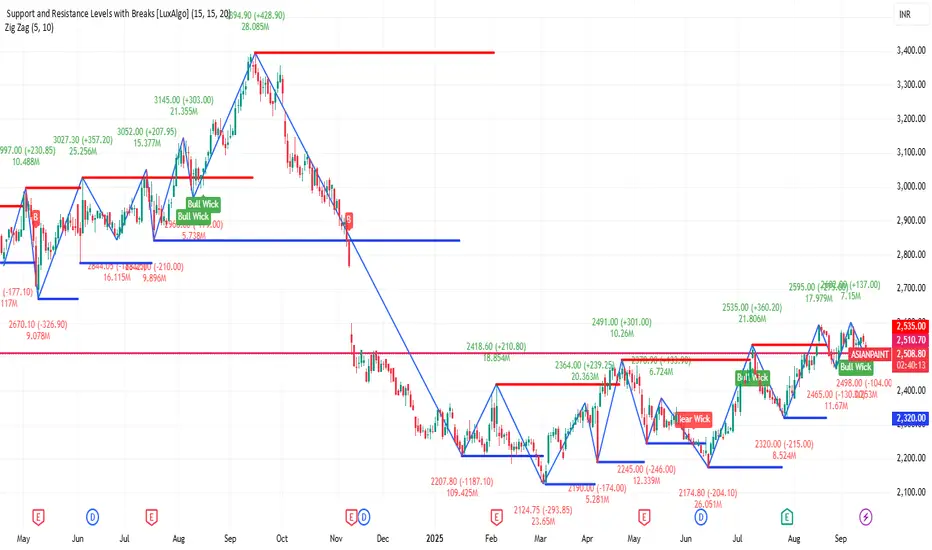
ASIANPAINT 1D Time frame🔢 Current Level
Trading around ₹2,546 – ₹2,560
🔑 Key Resistance & Support Levels
Resistance Zones:
₹2,559 – ₹2,560 (recent highs; breakout above this may lead to further upside)
₹2,580 – ₹2,600 (stronger resistance above)
Support Zones:
₹2,540 – ₹2,545 (immediate support; failure to hold above this may lead to a decline)
₹2,520 – ₹2,530 (short-term support; a break below this could indicate weakness)
₹2,500 – ₹2,510 (deeper support zone if price dips further)
📉 Outlook
Bullish Scenario: If Asian Paints holds above ₹2,545, upward momentum may continue. Break above ₹2,560 can open the way toward ₹2,580+.
Bearish Scenario: If it falls below ₹2,520, risk increases toward ₹2,500 – ₹2,510.
Neutral / Range: Between ₹2,545 – ₹2,560, Asian Paints may consolidate before a directional move.
Gap filling will startThe stock has created a gap and will start filling it if we check the weekly price action.

#ASIANPAINT... solid base formation .. getting ready for a move Stock has formed a solid base after the mega fall in November last year. the recent break of the zone with volumes indicates good market participation and the stock expected to make a move up again, on my radar in the coming days .
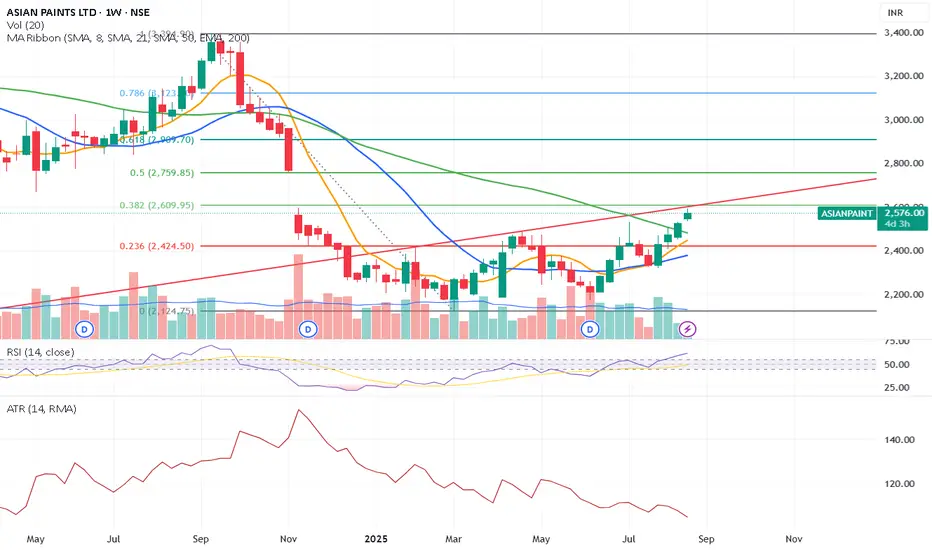
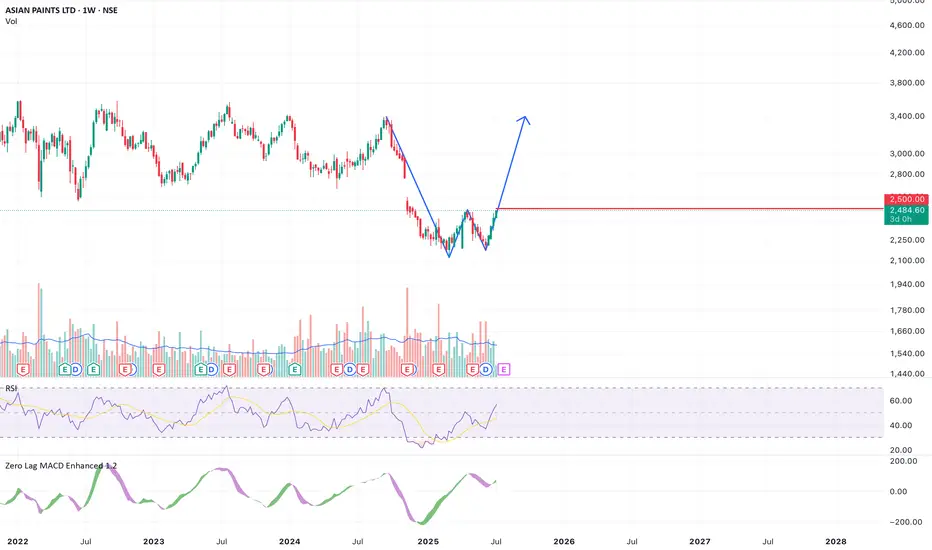
Asian Paints: Wave 3 Breakout or Wave 4 Still Dragging?Asian Paints seems to have completed a prolonged higher-degree wave 4 correction at ₹2124, marked by a complex overlapping structure. The subsequent rally has shaped into a 1–2, 1–2 sequence, pointing to the possibility of a strong wave 3 breakout. RSI momentum has been steadily rising since the ₹2124 low, and volume expansion adds weight to the bullish case.
However, the price now faces a strong resistance band just overhead. For the bullish impulse to remain valid, wave 3 must cut through this zone decisively. Failure to sustain above it could indicate that wave 4 is still extending sideways, possibly evolving into a triangle or another complex form before the final push higher.
The bullish invalidation remains at ₹2124 — any breakdown below this level would cancel the impulsive view and shift the bias toward further correction.
Disclaimer:
This analysis is for educational purposes only and does not constitute investment advice. Please do your own research (DYOR) before making any trading decisions.

Asian paints showing strengthAsian paints showing strength. Sale has been good and its in recovery mode. Green towers show the build in interest. Overall there is one trendline breakout necessary for Asian paints to regain old levels. Looks very positive with festive seasons nearing.
ASIAN PAINT 1D TIME FRAME ANALYSIS Asian paints has created a good base, it can easily go up from here15% to 20%.
Why did I select at this stock?
Reason-•big imbalance
•big base and supply weak
•Risk is very less and Reward is very big

Asian paints looks goodAsian Paints is trading near ₹2,528 with rich valuations (P/E ~67x), modest short-term gains, but notably down over the past year and beyond. It’s currently a market leader that’s performing well in today’s rally despite valuation concerns. This stock is looking good at current valuation (Positional).
Caution – Not a Buy/Sell Recommendation
This analysis is for educational and informational purposes only. It is not a recommendation to buy, sell, or hold Hindalco shares.
Stock prices are subject to market risks, economic conditions, and company-specific factors that can change rapidly.
Investors should:
Conduct their own independent research
Evaluate risk tolerance and investment horizon
Consult a qualified financial advisor before making any investment decision
Past price trends and technical patterns do not guarantee future performance.
Market conditions can turn unexpectedly, and capital invested in equities is always at risk.

ASIANPAINTS CMP. 2477.40.On the weekly charts, the price is showing a strong move and buy above 2490 with a stop loss 2350, then the targets are 2550-2600-2700+.
#asianpaints

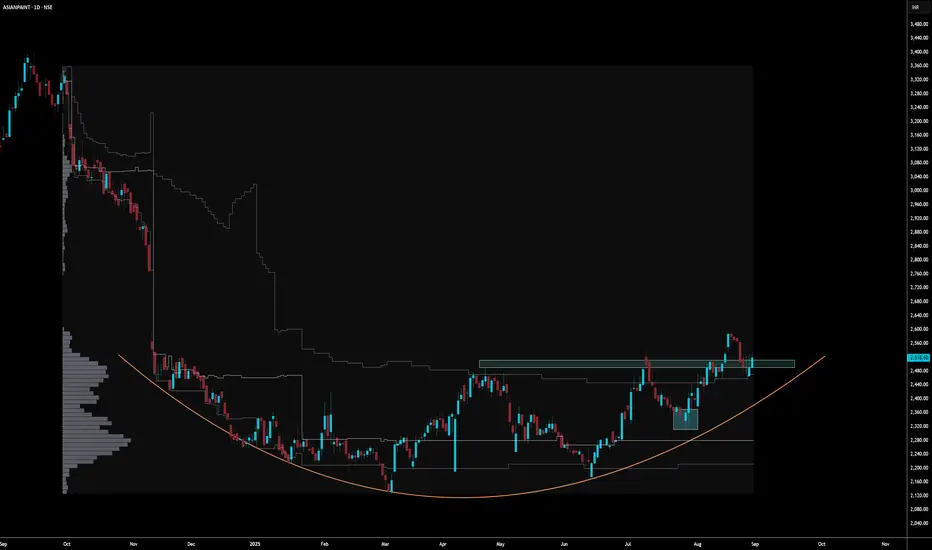
Asian Paints | Cup & Handle Breakout Building Momentum
Description:
Asian Paints is forming a classic cup and handle on the daily chart, supported by a rounded bottom structure on the weekly. Price is attempting to breakout above ₹2500, with positive EFI and upward momentum.
📌 Breakout Level: ₹2500
📉 Stoploss: ₹2449 (ATR-based)
🎯 Targets: ₹2749 → ₹2886 → ₹3108 (Fibonacci extension)
🧭 Macro Context:
- Stable inflation and INR
- Improving margin outlook for the sector
- Paint stocks showing strength post consolidation
Strong price-action setup supported by fundamentals and structure.

ASIAN PAINTS LTD – Technical Analysis________________________________________
🧠 ASIAN PAINTS LTD – Technical Analysis
Ticker: NSE:ASIANPAINT | Sector: Decorative & Industrial Coatings
CMP: 2,491 ▲ (+1.9%)
Chart Pattern: Symmetrical Triangle Breakout
Technical View: ⭐⭐⭐⭐ (Neutral-to-Positive Setup – Educational Purposes Only)
________________________________________
📈 Technical Overview (For Educational & Informational Purposes Only)
🔹 Pattern Observed:
Price action indicates a breakout from a symmetrical triangle pattern on the daily timeframe – a structure often linked to volatility contraction and potential directional movement. The stock breached the upper trendline near 2,467 with an uptick in volume, indicating possible buyer interest.
🔹 Supporting Indicators:
— MACD: Bullish crossover
— 200 EMA: Price reclaimed above the long-term average
— RSI: Reading near 66, indicating strengthening momentum
— Bollinger Bands: Price broke above upper band + BB squeeze
— SuperTrend: Bullish
— Open = Low: Potential buyer strength
🔹 Volume Context:
Volume during the breakout session was ~2.02M – higher than average, suggesting institutional participation or increased trader interest.
________________________________________
🔼 Resistance Levels (Reference Zones)
R1: 2,518
R2: 2,545
R3: 2,583
🔽 Support Levels (Reference Zones)
S1: 2,452
S2: 2,413
S3: 2,387
________________________________________
📰 News Summary & Sentiment Context (Neutral View)
📌 Earnings:
Q1 FY26 PAT declined ~6% YoY to 1,100 Cr. Revenue slightly lower YoY but largely in-line with expectations. Decorative segment volume grew ~4%, which helped cushion margin pressures.
📌 Demand Trends:
Urban & project-led demand showing signs of recovery. Rural demand is stable. Some macroeconomic caution warranted due to external factors (e.g., job market uncertainties).
📌 Regulatory Update:
The CCI has initiated a probe on alleged market dominance following a complaint. The company has contested the investigation citing procedural inconsistencies.
📌 Market Mood:
Despite regulatory concerns, post-earnings sentiment appears improved. The stock has risen ~5.2% YTD and has been among recent Nifty outperformers.
________________________________________
📚 Educational Insight for Traders & Learners
The symmetrical triangle is a common consolidation pattern formed by converging trendlines. It reflects a balance of power between buyers and sellers. A breakout (especially with volume) can signify renewed directional bias.
In this case, the stock broke out above the resistance trendline, backed by volume and confirmation from technical tools (RSI > 60, MACD, BB squeeze, etc.).
Such breakouts are monitored by traders for swing or positional opportunities, provided risk is managed and external catalysts (like earnings and macro sentiment) are factored in.
✅ Key Reminder: Technical setups should be combined with proper position sizing, exit plans, and broader market context.
________________________________________
🔍 Trade Setup (For Educational Simulation Only)
Trade Details
🔹 Long Entry: ₹2,505.60
🔹 Stop Loss (SL): ₹2,406.55
🔹 Risk-Reward Ratio: 1:1 | 1:2+
Pullback Trade Setup (Optional Re-Entry)
📍 Pullback Entry Zone: ₹2,491.20 – ₹2,505.60
📍 Protective Stop Zone: ₹2,465.87 – ₹2,453.60
📍 Risk-Reward Range: 1:1 | 1:2+
________________________________________
⚠️ Disclaimer (Please Read Carefully):
This content is shared strictly for educational and research purposes only.
I am not a SEBI-registered investment advisor, and no buy or sell recommendations are being made.
All views expressed are based on personal market analysis and experience. They are not intended as financial advice.
Trading — especially in derivatives like options — involves significant financial risk. Losses can exceed your initial investment.
👉 Always do your own research and consult a certified SEBI-registered advisor before making any investment or trading decisions.
👉 Use proper risk management and only trade with capital you can afford to lose.
The author assumes no responsibility or liability for any trading losses incurred from acting on this content.
By engaging with this material, you agree to these terms.
________________________________________
💬 Found this helpful?
Drop your thoughts, questions, or insights in the comments below ⬇️ — let’s learn together!
🔁 Share this post with your trading friends and community — help them discover clean charts, structured setups, and zone-based learning.
✅ Follow simpletradewithpatience for clear setups, educational content, and a no-nonsense approach to price action, supply-demand zones, and risk-managed trades.
🚀 Trade with patience. Trust your charts. Stay clear-headed.
Because the goal is not just to trade — it's to trade better.
Be Self-Reliant | Trade with Patience | Learn with Charts & Zones 📊

Asian Paints Short View — Target ₹2450Entry: ₹2485–₹2500
Target: ₹2450
Technical View:
Price rejected at key resistance zone (₹2500).
Bearish structure forming on lower timeframes.
Expecting retest of support at ₹2450

Asian Paint feels under appreciated.Chart Aspect
The price has been moving around in a range of more than 20% and have tested both the bottom and top 3 times.
Now the price has moved below this range.
Expecting the price to touch the upper range.
Financial Aspect
The first eye catcher is that that the price to book was at its lowest in over 10 years.
This might have been caused by the decline in the net profit of the company. Even though its 3X the net profit of its closest rival.
I have notices that the material & manufacturing cost for the paint is the lowest compared to the nearest competition. This might be coz of their continued effort for backward integration.
Their investment in P&M and Building is increasing at a exponential pace compared to there peers. This will help them pump out more product there by reducing cost and increasing the topline and margin.
Their debt is at par with their nearest competition, in debt-to-equity terms.
DIIs have increased their stakes in the company to its highest level in tis history and public are at the lowest level. You know what that means ;)

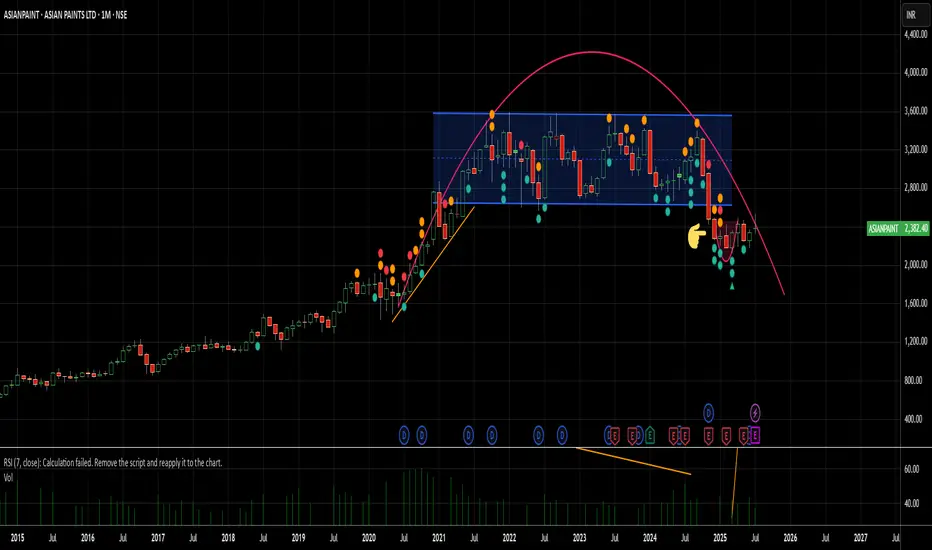
A rare formation of Inverted Cup patternAlas, what a cruel and tumultuous age for commerce! One observes with a heavy heart the turning of the great wheel of Fortune, which grinds the old and venerable with the same indifference it shows the new.
For now, fresh-faced contenders, chief among them the great House of Birla, have entered the field of commercial battle. A merciless price war, a most vulgar skirmish of shillings and pence, has been unleashed upon the market. The once-healthy margins, which have for so long fattened the ledgers of established firms, now wither and shrink, bled dry by the cold, unfeeling efficiency of new-fangled technologies.
And thus, it is a sorrowful spectacle to witness how a titan of its trade, the hitherto unshakeable and reputable firm of NSE:ASIANPAINT , is at last brought to its very knees. It is a capitulation not on one front, but on all; a humiliation felt in the corridors of political favour, in the grand theatre of its own industry, and indeed, throughout the sprawling, vital network of its distribution, which for so long has carried its lifeblood to the farthest corners of the land.
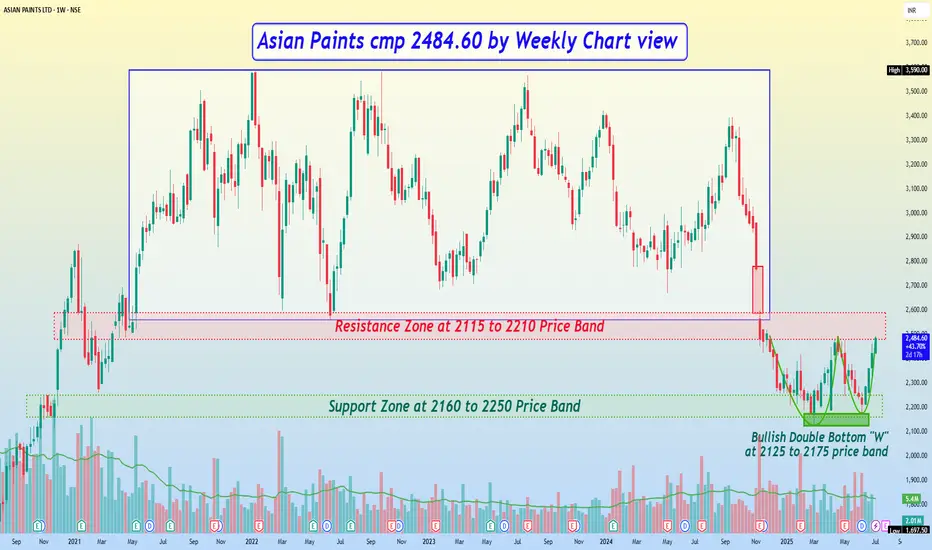
Asian Paints cmp 2484.60 by Weekly Chart view*Asian Paints cmp 2484.60 by Weekly Chart view*
- Support Zone at 2160 to 2250 Price Band
- Resistance Zone at 2115 to 2210 Price Band
- Bullish Double Bottom "W" near Support Zone around the 2125 to 2175 price band
- Gap Down Opening of 11-Nov-2024 to act as a hurdle and will get closure only during next upside
- Stock had been trading within 2560 to ATH 3590 price band for 4+ years, unable to break this range
- The stock took a breakdown from the price range but is attempting to reverse from the Support Zone
ASIAN PAINTS LTD – Gap Fill Setup Near Resistance | Price Action________________________________________________________________________________📈 ASIAN PAINTS LTD – Gap Fill Setup Near Resistance | Price Action Analysis
🕒 Chart Type: Daily (1D)
________________________________________________________________________________
🔍 What’s Catching Our Eye:
Price is testing a major resistance with a gap still left to be filled above.
________________________________________________________________________________
📌 What We’re Watching For:
A breakout above 2491 or a reversal from the resistance zone.
________________________________________________________________________________
📊 Volume Footprint:
Breakout occurred on slightly lower volume – caution advised.
________________________________________________________________________________
🔁 Trend Bias:
Short-term bullish with breakout momentum in play.
________________________________________________________________________________
🧠 Trade Logic / Reasoning:
Strong bullish candle with BB breakout and VWAP support suggest strength.
________________________________________________________________________________
📍 Important Levels to Mark:
Key zones are 2491 (Top) and 2124.75 (Bottom) for breakout or bounce setups.
________________________________________________________________________________
🎯 Trade Plan (Educational Purpose Only):
Best Buy:
Above 2491 on retest with volume; or near 2451–2419 with bullish reversal.
________________________________________________________________________________
Best Sell:
Below 2451 with rejection confirmation; or near 2520 if breakout fails.
________________________________________________________________________________
Demand Zone / Supply Zone: NA
________________________________________________________________________________
⚠️ Invalidation Below:
Breakdown below 2435 would invalidate current bullish bias.
________________________________________________________________________________
⚠️ Disclaimer:
This analysis is for educational purposes only.
STWP is not a SEBI-registered advisor.
No buy/sell recommendations are made.
Please consult your financial advisor before trading.
STWP is not responsible for trading decisions based on this post.
________________________________________________________________________________
💬 Found this helpful?
Will Asian Paints Breakout or Fakeout
Share your thoughts in the comments ⬇️
🔁 Spread the insight with fellow traders
✅ Follow STWP for smart technical setups backed by volume and price action
🚀 Let’s trade with patience, logic, and clarity!
Be Self-Reliant | Trade with Patience | Learn with Logic
________________________________________________________________________________

Asianpaint W pattern in making‘W’ pattern can be seen in Asianpaints.
Breakot above 2500
Stoploss below 2120
Target 3390 5400++
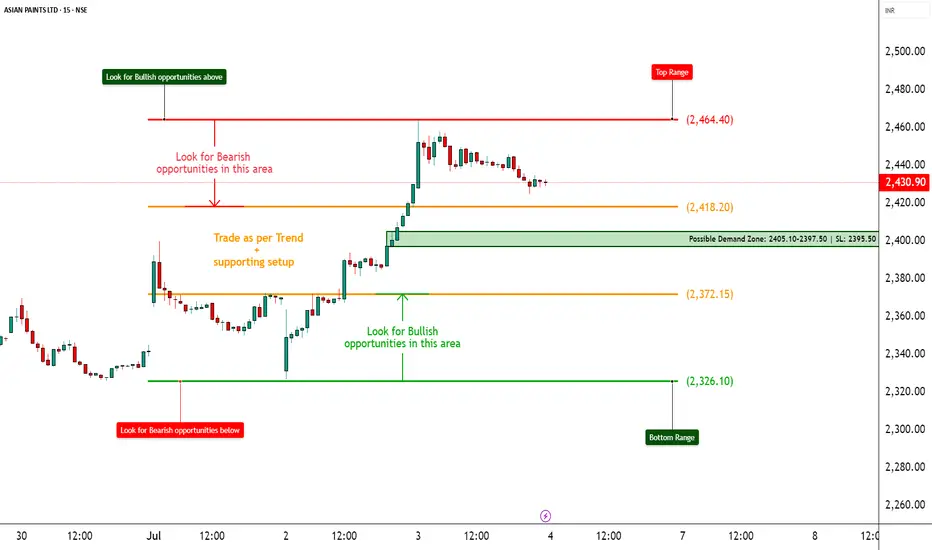
ASIANPAINT – Strong Bounce from Demand Zone________________________________________________________________________________📈 ASIANPAINT – Strong Bounce from Demand Zone | Option Chain + Price Action Breakdown
🕒 Chart Type: 15-Minute
📆 Date: July 3, 2025
________________________________________________________________________________
🔍 What’s Catching Our Eye:
ASIANPAINT saw a sharp intraday rebound from its marked demand zone at ₹2405–₹2397.50, with price closing near ₹2,430.90. The reversal occurred on higher volume and in the presence of long build-ups across multiple Call strikes. This suggests institutional interest and a potential shift in short-term sentiment.
________________________________________________________________________________
📌 What We’re Watching For:
The key observation is that ASIANPAINT respected its demand zone and bounced with strength. If the price sustains above ₹2,440, it could trigger continuation toward the top range of ₹2,464.40. On the downside, any failure to hold the demand zone may bring back pressure toward ₹2,400. Option chain data supports the bullish bias, with fresh long positions across ATM and OTM calls.
________________________________________________________________________________
📊 Volume Footprint:
Today’s volume was 1.55M, higher than the previous 1.36M, signaling strong participation during the bounce. A continuation move with volume > 1.5M may validate breakout setups.
________________________________________________________________________________
📈 Option Chain Highlights:
The 2,500 CE, 2,460 CE, and 2,440 CE all witnessed strong long build-ups, confirming bullish positioning. Even the deep OTM 2,600 CE showed healthy open interest increase. Meanwhile, 2,400 PE showed short build-up, suggesting put writers are confident that the ₹2,400 level will hold. Notably, 2,400 CE also saw short covering, adding further weight to the bullish narrative.
________________________________________________________________________________
🔁 Trend Bias:
🟢 Bullish above ₹2,440, especially if volume confirms a clean move
________________________________________
🧠 Trade Logic / Reasoning:
The bounce from demand was technical and backed by derivatives activity. The presence of long build-ups across multiple Calls and the short covering at 2400 CE suggests strength. Since price closed above key EMA zones and respected the lower boundary, it builds a solid case for an upward move, unless volume suddenly drops or a fresh supply emerges.
________________________________________________________________________________
📍 Important Levels to Mark:
🔺 Top Range Resistance: ₹2,464.40 – Watch for bullish breakout or reversal candlestick
🔻 Bottom Range Support: ₹2,326.10 – Deeper support; unlikely to come into play unless 2400 breaks
________________________________________________________________________________
🎯 Trade Plan (Educational Purpose Only):
✅ Best Buy (Cash/Futures):
Buy above ₹2,440 with bullish price action and volume confirmation. Reversal from the demand zone is valid as long as price holds above ₹2,405.
✅ Best Sell (Cash/Futures):
Sell only below ₹2,405 if the price breaks the demand zone with high volume and bearish structure. Downside may open toward ₹2,380–₹2,360.
💼 Best CE to Long:
2,440 CE or 2,460 CE – Both strikes show strong Long Build-Up; ideal for directional continuation above ₹2,440.
📉 Best PE to Long:
2,400 PE – Consider only if price breaks and sustains below ₹2,405 with heavy volume and weak candle close. Risk-reward turns favourable for downside hedging.
🟢 Demand Zone: ₹2405.10 – ₹2397.50 | SL: ₹2395.50
🔴 Supply Zone: Not clearly visible yet (watch ₹2464+ for fresh seller emergence)
⚠️ Invalidation Below:
Bullish bias invalid if price closes below ₹2,395 with strong volume and momentum.
________________________________________________________________________________
⚠️ Disclaimer:
This post is for educational purposes only.
STWP is not a SEBI-registered advisor.
This is not a buy/sell recommendation.
Please consult your financial advisor before trading.
STWP is not responsible for any trading outcomes.
________________________________________________________________________________
💬 Found this helpful?
Drop your thoughts in the comments ⬇️
🔁 Share this with fellow traders
✅ Follow STWP for zone-based price action & option chain insights
🚀 Let’s grow awareness for structured & patient trading!
________________________________________________________________________________
Breakout Confirmation Above ₹2491 - Trend Reversal in Play?After months of downtrend, Asian Paints is showing signs of reversal. A clear Change of Character (CHoCH) has been marked, and the price is approaching a key resistance at ₹2491.
🔍 Trade Idea:
Entry (Trigger): Weekly close above ₹2491 (break of recent BSL)
Target: ₹3203 (Previous high + Weekly Fair Value Gap zone)
Stop Loss: Below swing low around ₹2110
Risk-Reward: Approx. 1:2.8+
📌 Technical Confluences:
CHoCH confirmed in mid-2025
Weekly FVG above offers price imbalance that price may seek to fill
Current structure forming a higher low with bullish momentum
💬 Idea: Wait for a strong weekly close above ₹2491 for confirmation. Once confirmed, a potential rally towards ₹3200+ is in play, targeting the FVG zone and liquidity above the previous swing high.
⚠️ Disclaimer: This analysis is for educational purposes only and not financial advice. Always do your own research and use proper risk management.

Asian Paints Chart Move Update **Asian Paints Business Model**:
---
## 🏢 **Asian Paints Ltd – Business Model Overview**
### 1. **Company Overview**
* **Founded:** 1942
* **Headquarters:** Mumbai, India
* **Founders:** Champaklal H. Choksey, Chimanlal Choksi, Suryakant Dani & Arvind Vakil
* **CEO & MD:** Amit Syngle (as of 2024)
* **Industry:** Paints and Coatings, Home Décor, Bath Fittings
* **Market Position:** India's largest and Asia’s third-largest paint company
---
### 2. **Core Business Segments**
| Segment | Description |
| ---------------------------- | --------------------------------------------------------------- |
| **Decorative Paints** | Wall paints, enamels, wood finishes, distempers, primers, etc. |
| **Industrial Coatings** | Automotive and powder coatings in partnership with PPG Inc. |
| **Home Improvement & Décor** | Kitchen, bath fittings (via Sleek and Ess Ess), waterproofing |
| **International Operations** | Presence in 15+ countries, strong in South Asia and Middle East |
---
### 3. **Key Revenue Streams**
* **Retail Sales** (B2C): Via large dealer and distributor networks across India.
* **Institutional/B2B Sales**: Projects, contractors, automotive OEMs.
* **Premium Product Lines**: Royale, Ultima, Tractor Emulsion.
* **Services**: Home painting services, waterproofing, colour consultancy.
---
### 4. **Distribution Network**
* Over **70,000+ dealers** in India
* **Robust supply chain** with over 30+ manufacturing facilities globally
* Digital tools like **Colour Visualizers, SmartCare App** for consumer engagement
---
### 5. **Digital & Technology Integration**
* **ColourNext** trend forecasting platform
* Use of **AI/ML in demand forecasting** and inventory management
* E-commerce platforms for paints & décor
* CRM systems for improved customer service and feedback
---
### 6. **Business Strategy**
* **Backward Integration**: Manufacturing of raw materials like emulsions & pigments
* **Innovation**: Focus on eco-friendly and long-lasting paints
* **Brand Building**: Iconic advertising (e.g., “Har Ghar Kuch Kehta Hai”)
* **Customer-Centric Services**: Safe Painting Service, Colour Consultancy, etc.
---
### 7. **Competitive Advantages**
* **Strong Brand Loyalty**
* **Pan-India Dealer Network**
* **In-house R\&D** and innovation capabilities
* **Diverse Product Portfolio** for all price points and segments
* **Agile supply chain and logistics**
---
### 8. **Recent Initiatives**
* Expansion into **home décor** through **Beautiful Homes platform**
* Entry into **furnishings & lighting**
* Strengthening of **waterproofing solutions**
* Focus on **sustainable paints** (low VOC, green-certified)
---
### 9. **Challenges**
* Raw material price volatility (e.g., crude oil-based inputs)
* Competitive pressure from **Berger Paints, Nerolac, Akzo Nobel**
* Seasonal demand patterns
* Margin pressure in low-end segments
---
### 10. **Conclusion**
Asian Paints is not just a paint company; it’s evolving into a **comprehensive home improvement brand**. With its innovation-driven strategy, strong retail presence, and digital transformation efforts, it continues to lead the Indian market and expand globally.
---
thanks & regards
the golden farms of equity
