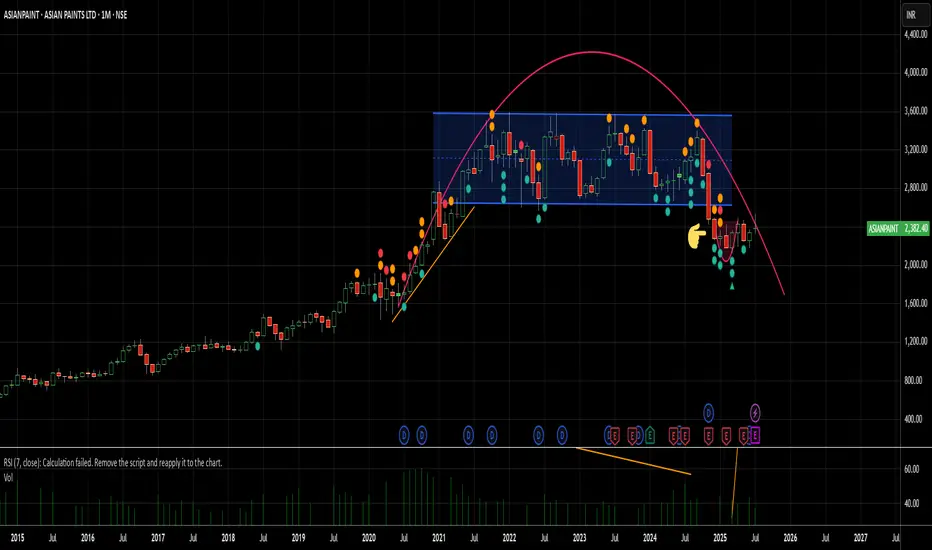
A rare formation of Inverted Cup patternAlas, what a cruel and tumultuous age for commerce! One observes with a heavy heart the turning of the great wheel of Fortune, which grinds the old and venerable with the same indifference it shows the new.
For now, fresh-faced contenders, chief among them the great House of Birla, have entered the field of commercial battle. A merciless price war, a most vulgar skirmish of shillings and pence, has been unleashed upon the market. The once-healthy margins, which have for so long fattened the ledgers of established firms, now wither and shrink, bled dry by the cold, unfeeling efficiency of new-fangled technologies.
And thus, it is a sorrowful spectacle to witness how a titan of its trade, the hitherto unshakeable and reputable firm of NSE:ASIANPAINT , is at last brought to its very knees. It is a capitulation not on one front, but on all; a humiliation felt in the corridors of political favour, in the grand theatre of its own industry, and indeed, throughout the sprawling, vital network of its distribution, which for so long has carried its lifeblood to the farthest corners of the land.
Trade ideas
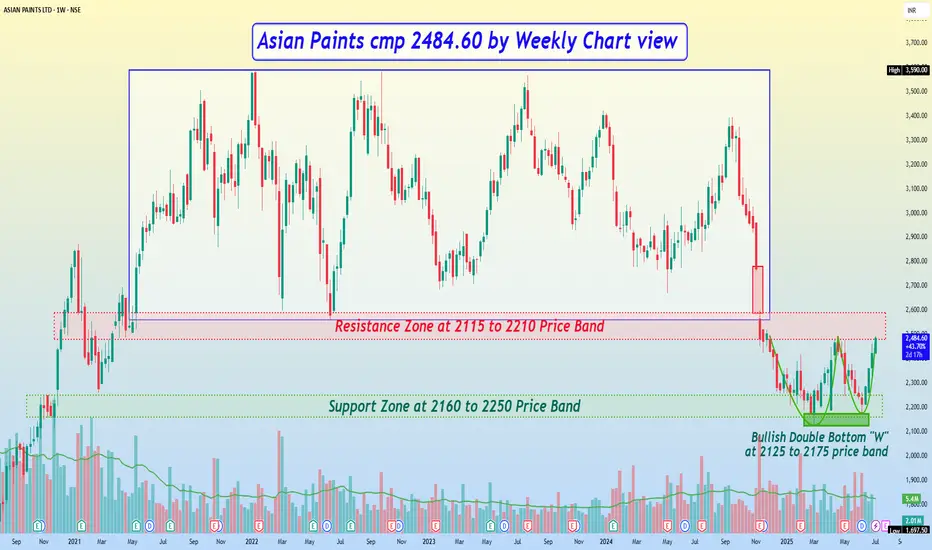
Asian Paints cmp 2484.60 by Weekly Chart view*Asian Paints cmp 2484.60 by Weekly Chart view*
- Support Zone at 2160 to 2250 Price Band
- Resistance Zone at 2115 to 2210 Price Band
- Bullish Double Bottom "W" near Support Zone around the 2125 to 2175 price band
- Gap Down Opening of 11-Nov-2024 to act as a hurdle and will get closure only during next upside
- Stock had been trading within 2560 to ATH 3590 price band for 4+ years, unable to break this range
- The stock took a breakdown from the price range but is attempting to reverse from the Support Zone
ASIAN PAINTS LTD – Gap Fill Setup Near Resistance | Price Action________________________________________________________________________________📈 ASIAN PAINTS LTD – Gap Fill Setup Near Resistance | Price Action Analysis
🕒 Chart Type: Daily (1D)
________________________________________________________________________________
🔍 What’s Catching Our Eye:
Price is testing a major resistance with a gap still left to be filled above.
________________________________________________________________________________
📌 What We’re Watching For:
A breakout above 2491 or a reversal from the resistance zone.
________________________________________________________________________________
📊 Volume Footprint:
Breakout occurred on slightly lower volume – caution advised.
________________________________________________________________________________
🔁 Trend Bias:
Short-term bullish with breakout momentum in play.
________________________________________________________________________________
🧠 Trade Logic / Reasoning:
Strong bullish candle with BB breakout and VWAP support suggest strength.
________________________________________________________________________________
📍 Important Levels to Mark:
Key zones are 2491 (Top) and 2124.75 (Bottom) for breakout or bounce setups.
________________________________________________________________________________
🎯 Trade Plan (Educational Purpose Only):
Best Buy:
Above 2491 on retest with volume; or near 2451–2419 with bullish reversal.
________________________________________________________________________________
Best Sell:
Below 2451 with rejection confirmation; or near 2520 if breakout fails.
________________________________________________________________________________
Demand Zone / Supply Zone: NA
________________________________________________________________________________
⚠️ Invalidation Below:
Breakdown below 2435 would invalidate current bullish bias.
________________________________________________________________________________
⚠️ Disclaimer:
This analysis is for educational purposes only.
STWP is not a SEBI-registered advisor.
No buy/sell recommendations are made.
Please consult your financial advisor before trading.
STWP is not responsible for trading decisions based on this post.
________________________________________________________________________________
💬 Found this helpful?
Will Asian Paints Breakout or Fakeout
Share your thoughts in the comments ⬇️
🔁 Spread the insight with fellow traders
✅ Follow STWP for smart technical setups backed by volume and price action
🚀 Let’s trade with patience, logic, and clarity!
Be Self-Reliant | Trade with Patience | Learn with Logic
________________________________________________________________________________

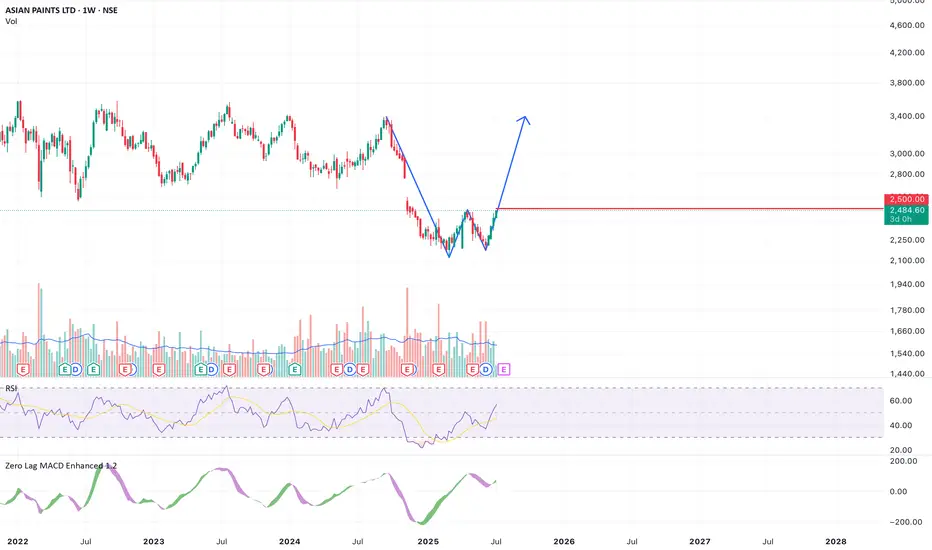
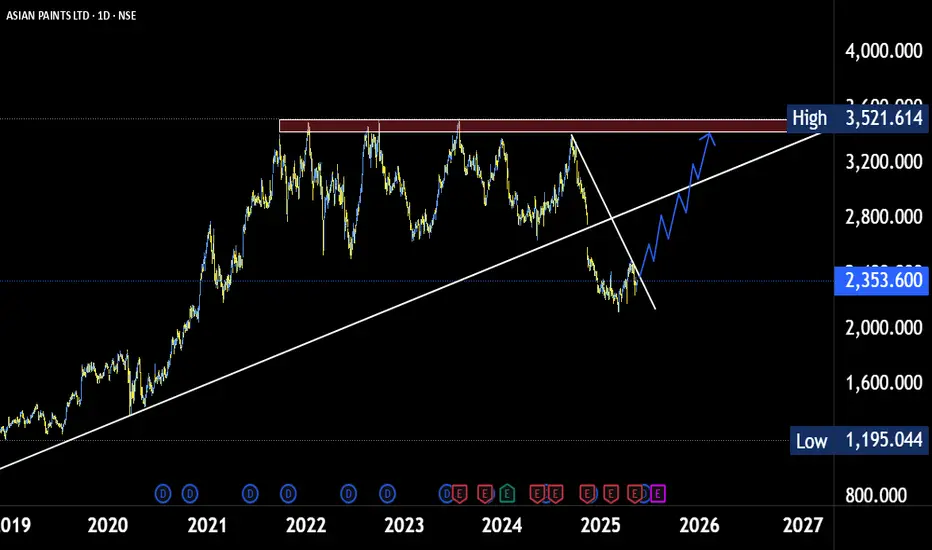
Asianpaint W pattern in making‘W’ pattern can be seen in Asianpaints.
Breakot above 2500
Stoploss below 2120
Target 3390 5400++
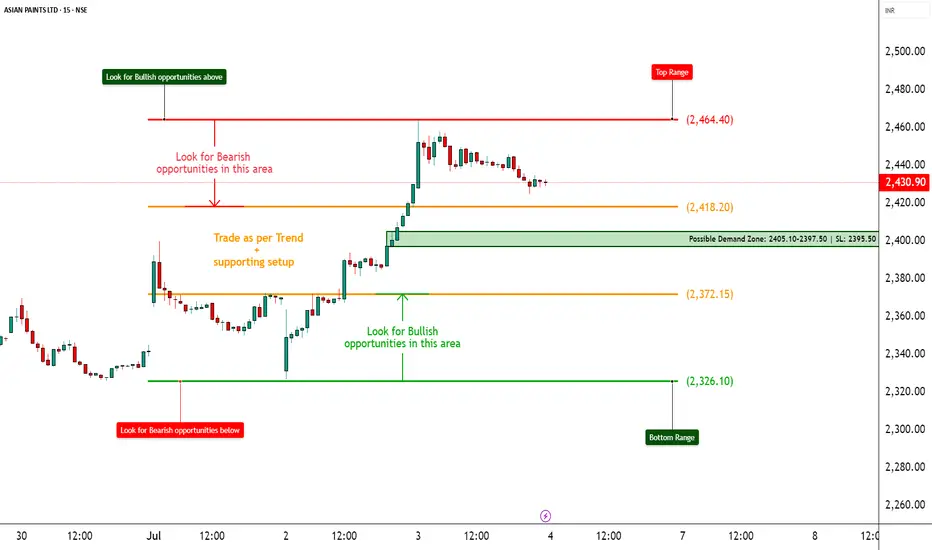
ASIANPAINT – Strong Bounce from Demand Zone________________________________________________________________________________📈 ASIANPAINT – Strong Bounce from Demand Zone | Option Chain + Price Action Breakdown
🕒 Chart Type: 15-Minute
📆 Date: July 3, 2025
________________________________________________________________________________
🔍 What’s Catching Our Eye:
ASIANPAINT saw a sharp intraday rebound from its marked demand zone at ₹2405–₹2397.50, with price closing near ₹2,430.90. The reversal occurred on higher volume and in the presence of long build-ups across multiple Call strikes. This suggests institutional interest and a potential shift in short-term sentiment.
________________________________________________________________________________
📌 What We’re Watching For:
The key observation is that ASIANPAINT respected its demand zone and bounced with strength. If the price sustains above ₹2,440, it could trigger continuation toward the top range of ₹2,464.40. On the downside, any failure to hold the demand zone may bring back pressure toward ₹2,400. Option chain data supports the bullish bias, with fresh long positions across ATM and OTM calls.
________________________________________________________________________________
📊 Volume Footprint:
Today’s volume was 1.55M, higher than the previous 1.36M, signaling strong participation during the bounce. A continuation move with volume > 1.5M may validate breakout setups.
________________________________________________________________________________
📈 Option Chain Highlights:
The 2,500 CE, 2,460 CE, and 2,440 CE all witnessed strong long build-ups, confirming bullish positioning. Even the deep OTM 2,600 CE showed healthy open interest increase. Meanwhile, 2,400 PE showed short build-up, suggesting put writers are confident that the ₹2,400 level will hold. Notably, 2,400 CE also saw short covering, adding further weight to the bullish narrative.
________________________________________________________________________________
🔁 Trend Bias:
🟢 Bullish above ₹2,440, especially if volume confirms a clean move
________________________________________
🧠 Trade Logic / Reasoning:
The bounce from demand was technical and backed by derivatives activity. The presence of long build-ups across multiple Calls and the short covering at 2400 CE suggests strength. Since price closed above key EMA zones and respected the lower boundary, it builds a solid case for an upward move, unless volume suddenly drops or a fresh supply emerges.
________________________________________________________________________________
📍 Important Levels to Mark:
🔺 Top Range Resistance: ₹2,464.40 – Watch for bullish breakout or reversal candlestick
🔻 Bottom Range Support: ₹2,326.10 – Deeper support; unlikely to come into play unless 2400 breaks
________________________________________________________________________________
🎯 Trade Plan (Educational Purpose Only):
✅ Best Buy (Cash/Futures):
Buy above ₹2,440 with bullish price action and volume confirmation. Reversal from the demand zone is valid as long as price holds above ₹2,405.
✅ Best Sell (Cash/Futures):
Sell only below ₹2,405 if the price breaks the demand zone with high volume and bearish structure. Downside may open toward ₹2,380–₹2,360.
💼 Best CE to Long:
2,440 CE or 2,460 CE – Both strikes show strong Long Build-Up; ideal for directional continuation above ₹2,440.
📉 Best PE to Long:
2,400 PE – Consider only if price breaks and sustains below ₹2,405 with heavy volume and weak candle close. Risk-reward turns favourable for downside hedging.
🟢 Demand Zone: ₹2405.10 – ₹2397.50 | SL: ₹2395.50
🔴 Supply Zone: Not clearly visible yet (watch ₹2464+ for fresh seller emergence)
⚠️ Invalidation Below:
Bullish bias invalid if price closes below ₹2,395 with strong volume and momentum.
________________________________________________________________________________
⚠️ Disclaimer:
This post is for educational purposes only.
STWP is not a SEBI-registered advisor.
This is not a buy/sell recommendation.
Please consult your financial advisor before trading.
STWP is not responsible for any trading outcomes.
________________________________________________________________________________
💬 Found this helpful?
Drop your thoughts in the comments ⬇️
🔁 Share this with fellow traders
✅ Follow STWP for zone-based price action & option chain insights
🚀 Let’s grow awareness for structured & patient trading!
________________________________________________________________________________
Breakout Confirmation Above ₹2491 - Trend Reversal in Play?After months of downtrend, Asian Paints is showing signs of reversal. A clear Change of Character (CHoCH) has been marked, and the price is approaching a key resistance at ₹2491.
🔍 Trade Idea:
Entry (Trigger): Weekly close above ₹2491 (break of recent BSL)
Target: ₹3203 (Previous high + Weekly Fair Value Gap zone)
Stop Loss: Below swing low around ₹2110
Risk-Reward: Approx. 1:2.8+
📌 Technical Confluences:
CHoCH confirmed in mid-2025
Weekly FVG above offers price imbalance that price may seek to fill
Current structure forming a higher low with bullish momentum
💬 Idea: Wait for a strong weekly close above ₹2491 for confirmation. Once confirmed, a potential rally towards ₹3200+ is in play, targeting the FVG zone and liquidity above the previous swing high.
⚠️ Disclaimer: This analysis is for educational purposes only and not financial advice. Always do your own research and use proper risk management.

Asian Paints Chart Move Update **Asian Paints Business Model**:
---
## 🏢 **Asian Paints Ltd – Business Model Overview**
### 1. **Company Overview**
* **Founded:** 1942
* **Headquarters:** Mumbai, India
* **Founders:** Champaklal H. Choksey, Chimanlal Choksi, Suryakant Dani & Arvind Vakil
* **CEO & MD:** Amit Syngle (as of 2024)
* **Industry:** Paints and Coatings, Home Décor, Bath Fittings
* **Market Position:** India's largest and Asia’s third-largest paint company
---
### 2. **Core Business Segments**
| Segment | Description |
| ---------------------------- | --------------------------------------------------------------- |
| **Decorative Paints** | Wall paints, enamels, wood finishes, distempers, primers, etc. |
| **Industrial Coatings** | Automotive and powder coatings in partnership with PPG Inc. |
| **Home Improvement & Décor** | Kitchen, bath fittings (via Sleek and Ess Ess), waterproofing |
| **International Operations** | Presence in 15+ countries, strong in South Asia and Middle East |
---
### 3. **Key Revenue Streams**
* **Retail Sales** (B2C): Via large dealer and distributor networks across India.
* **Institutional/B2B Sales**: Projects, contractors, automotive OEMs.
* **Premium Product Lines**: Royale, Ultima, Tractor Emulsion.
* **Services**: Home painting services, waterproofing, colour consultancy.
---
### 4. **Distribution Network**
* Over **70,000+ dealers** in India
* **Robust supply chain** with over 30+ manufacturing facilities globally
* Digital tools like **Colour Visualizers, SmartCare App** for consumer engagement
---
### 5. **Digital & Technology Integration**
* **ColourNext** trend forecasting platform
* Use of **AI/ML in demand forecasting** and inventory management
* E-commerce platforms for paints & décor
* CRM systems for improved customer service and feedback
---
### 6. **Business Strategy**
* **Backward Integration**: Manufacturing of raw materials like emulsions & pigments
* **Innovation**: Focus on eco-friendly and long-lasting paints
* **Brand Building**: Iconic advertising (e.g., “Har Ghar Kuch Kehta Hai”)
* **Customer-Centric Services**: Safe Painting Service, Colour Consultancy, etc.
---
### 7. **Competitive Advantages**
* **Strong Brand Loyalty**
* **Pan-India Dealer Network**
* **In-house R\&D** and innovation capabilities
* **Diverse Product Portfolio** for all price points and segments
* **Agile supply chain and logistics**
---
### 8. **Recent Initiatives**
* Expansion into **home décor** through **Beautiful Homes platform**
* Entry into **furnishings & lighting**
* Strengthening of **waterproofing solutions**
* Focus on **sustainable paints** (low VOC, green-certified)
---
### 9. **Challenges**
* Raw material price volatility (e.g., crude oil-based inputs)
* Competitive pressure from **Berger Paints, Nerolac, Akzo Nobel**
* Seasonal demand patterns
* Margin pressure in low-end segments
---
### 10. **Conclusion**
Asian Paints is not just a paint company; it’s evolving into a **comprehensive home improvement brand**. With its innovation-driven strategy, strong retail presence, and digital transformation efforts, it continues to lead the Indian market and expand globally.
---
thanks & regards
the golden farms of equity

AsianpaintsI'm not a SEBI REGISTERED ANYLISIS
just for learning purpose
above the blue line close in D chart candle i will buy and put strictly SL to below red line...once candle close below Red line in D chart...i will close the Trade...
target check the chart
educational purpose only
oits simple ORB WITH VOLUME BREAKOUT STRATEGY...with small condition apply for selecting the stocks
owt not response for your profit and loss

Asian paint buying range: ₹2,117 to ₹2,250. target ?Asian Paints CMP is ₹2,358. Suggested buying range: ₹2,117 to ₹2,250. Positional target: ₹3,600, offering a potential upside of over 45% from the buying range.

ASIAN PAINTS LTD. – INTRADAY ZONE ANALYSIS________________________________________________________________________________
📈 ASIAN PAINTS LTD. – INTRADAY ZONE ANALYSIS
📆 Date: June 29, 2025 | ⏱ Timeframe: 15-Minute Chart
🔍 Educational Analysis for Learning Purposes Only
________________________________________________________________________________
📊 Zone Breakdown:
• 🔴 Top Range Resistance – 2,364.50
Marked in Red: This is a potential supply zone, where price may face resistance after a strong move up. Ideal for observing bearish reversal patterns like a shooting star, bearish engulfing, or a doji — especially if volume drops or candles show exhaustion.
• 🟠 Neutral Zone – Avoid Trade Area (2,320–2,340)
Marked in Orange: Historically indecisive. Avoid trades here as price often moves sideways or with false breakouts.
• 🟢 Demand Zone – 2,302.90 to 2,293.70 | SL: 2,292
Marked in Green: Price broke out with strong volume from this area. A retest may offer bullish pullback opportunities with proper confirmation candles.
• 🟩 Bottom Support – 2,275.40
Important base level. Breakdown below this zone may change overall short-term bias.
________________________________________________________________________________
🔍 Candlestick Observation:
At the resistance zone, the last candle shows slight upper rejection and reduced body size.
🧠 Interpretation: A possible early signal of exhaustion. Traders can watch for confirmation via volume drop or follow-up bearish candle for a short bias — or wait for breakout strength for long continuation.
________________________________________________________________________________
⚙️ Educational Trade Ideas (Study Purpose Only)
▶️ Reversal Setup – Bearish Bias
• Entry: Below ₹2,358 on bearish candle confirmation
• Stop Loss: Above ₹2,365
• Risk-Reward: 1:1 | 1:2+
• 🧠 Ideal for studying price rejection after a rally into resistance
________________________________________________________________________________
▶️ Pullback Setup – Bullish Bias
• Entry: Near ₹2,300 with bullish confirmation at demand zone
• Stop Loss: ₹2,292
• Risk-Reward: 1:1 | 1:2+
• 🧠 Useful example of “breakout → retest → continuation” pattern
________________________________________________________________________________⚠️ Disclaimer (SEBI-Compliant):
This content is shared strictly for educational and informational purposes. It is not investment advice or a trading recommendation. Please consult a SEBI-registered financial advisor before taking any investment decisions.
STWP | Learn. Trade. Grow.
________________________________________________________________________________
💬 What do you think about this setup?
Did you observe any other key patterns or zones?
👇 Drop your thoughts in the comments — let’s grow together!
________________________________________________________________________________

Asian Paint: Monitoring Key Levels for Potential Reversal“The stock market is a device to transfer money from the impatient to the patient.”
Warren Buffett
Asian Paint (ASIANPAINT) - Pre-Breakout Analysis
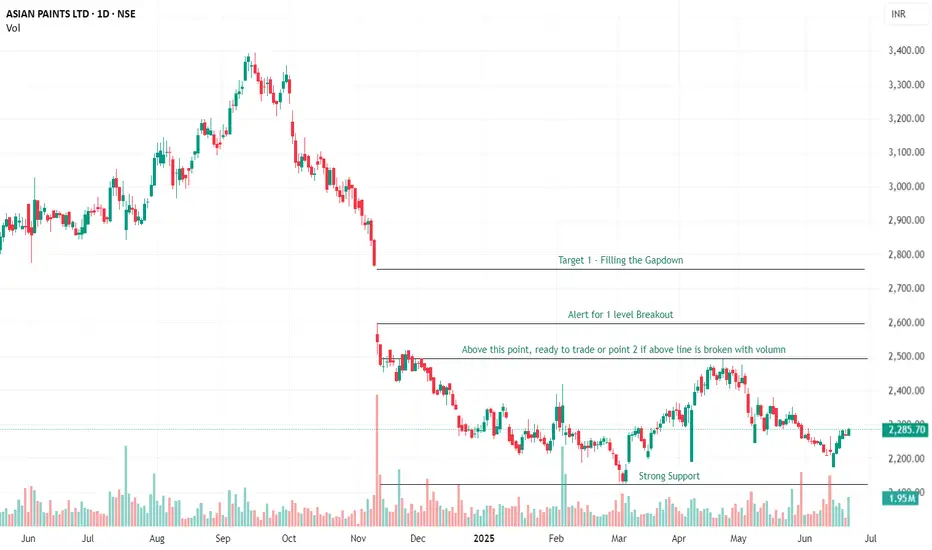
Asian Paints, a prominent blue-chip paint conglomerate, has been experiencing a period of underperformance on the bourse for quite some time now. This analysis focuses on identifying key levels that could signal a potential shift in its current trajectory.
Key Observations & Technical Levels:
Significant Gap Down & Strong Support:
On 11th November 2024 , Asian Paint experienced a notable gap down, touching a low of ₹2122. This price point has since acted as a strong support level, demonstrating resilience against further declines. This level will be crucial to monitor for any bearish breakdown attempts.
Consolidation & Potential Breakout Zone:
The stock appears to be consolidating within a range, indicating indecision between buyers and sellers after the significant move.
We are closely watching for a potential breakout around the ₹2500 level. A decisive close above this psychological and technical resistance could indicate a shift in momentum.
Potential Upside Target:
Should a confirmed breakout above ₹2500 occur, the stock has the potential to rally towards ₹2700. This would represent a significant recovery and could re-ignite bullish sentiment. Traders should look for further confirmation (e.g., volume, retest of breakout level) if this target is approached.
Why a "Pre-Breakout" Alert?
The reason for issuing a "pre-breakout" alert rather than waiting for confirmation is rooted in effective trading strategy. It is highly beneficial for traders to:
Maintain a Watchlist : Keep potential opportunities organized and readily accessible.
Patiently Observe Price Movement: Develop the discipline to wait for ideal entry/exit points rather than chasing trades.
Develop Skill : This approach fosters keen observation and analytical skills, which are immensely rewarding in the long run. By identifying setups early, traders can prepare for optimal execution when the time comes.
Asian PaintsAsian Paints near attractive levels of 2200-2250
Cmp - 2263 buy & accumulate at this level
Stock has been in a consolidation zone more than 3 years and currently available near bottom, one can buy/accumulate at this level as this looks great risk-to-reward trade. Small resistance near 2825-2850
{Not a recommendation, just for an educational purpose}

Asian Paints View For 52 Weeks
---
## 🎨 **Asian Paints Ltd – Business Model Overview**
**Asian Paints Ltd** is India’s largest and one of Asia’s leading paint companies. Founded in 1942, it has evolved from a decorative paint manufacturer into a **full home décor solutions provider**, with a strong supply chain, brand loyalty, and diversified offerings.
---
### 1. **Business Type**
**B2C and B2B Manufacturer & Retailer**
* **B2C**: Paints, waterproofing, home décor, furnishings.
* **B2B**: Industrial coatings, protective paints, automotive coatings, and OEM partnerships.
---
### 2. **Core Offerings**
| Segment | Products/Services |
| --------------------------- | -------------------------------------------------------------------------------- |
| 🎨 **Decorative Paints** | Interior & exterior paints, textures, waterproofing, primers, enamels |
| 🏭 **Industrial Coatings** | Automotive paints, powder coatings, marine & protective coatings |
| 🏠 **Home Décor Solutions** | Kitchen, bath fittings, lighting, furniture via brands like *Sleek* and *EssEss* |
| 📦 **Tools & Services** | Painting tools, Color Consultancy, *Beautiful Homes* services |
---
### 3. **Revenue Streams**
| Source | Description |
| ------------------------------- | ----------------------------------------------------------------- |
| 🎨 **Paint Product Sales** | Revenue from decorative & industrial paints (largest contributor) |
| 🛠️ **Home Décor Services** | Interior design, furniture, and modular kitchen services |
| 🧪 **Waterproofing Solutions** | A key growth area via its SmartCare range |
| 📢 **Dealer Network Promotion** | Indirect monetization via dealer loyalty and repaint cycles |
| 🔧 **Projects & Contracts** | Institutional and government painting contracts |
---
### 4. **Target Customer Segments**
* **Retail Consumers** (homeowners, tenants)
* **Contractors and Painters**
* **Architects and Interior Designers**
* **Builders and Real Estate Developers**
* **Automotive and Industrial Clients**
---
### 5. **Key Strengths / Competitive Advantages**
✅ Market Leadership in India (\~50% share)
✅ Massive dealer network (over 70,000 dealers)
✅ In-house R\&D with innovation in eco-friendly, long-lasting paints
✅ Strong **brand recall** and extensive **logistics network**
✅ Technology-driven services like *AP Homes App* and *Visualiser Tool*
---
### 6. **Distribution & Sales Channels**
* **Retail Dealers and Distributors** (pan-India reach)
* **Company-owned Stores** (Beautiful Homes Stores)
* **Online Platforms** (e-commerce, company apps)
* **Project Sales Teams** (for institutional clients)
---
### 7. **Key Partnerships**
* Interior designers, contractors, dealers
* E-commerce platforms for décor products
* OEMs for industrial and auto segments
---
### 8. **Cost Structure**
* Raw materials (resins, pigments, solvents)
* Manufacturing & plant operations
* Marketing, advertising, and dealer incentives
* R\&D and innovation spending
* Logistics and warehousing
---
### 9. **Innovation & Digitalization**
* AI tools for color recommendation & personalization
* Automated tinting machines at retail outlets
* AR-based visualizer for customers to preview wall colors
* Integrated interior design consultations
---
### 10. **Future Growth Drivers**
* **Premiumization** of paint products
* **Tier 2/3 city expansion** for home décor services
* Growth in **waterproofing & construction chemicals**
* Expanding **global presence** in Asia, Africa, and Middle East
* Focus on **sustainability** and green chemistry
---
## 🧠 Summary:
> Asian Paints isn’t just a paint company anymore—it's a **home transformation brand**. With a hybrid of **manufacturing excellence**, **brand power**, and **design services**, it dominates the industry with innovation and a customer-first approach.
---
Asian Paints Ltd Charts AnalysisHere is a **detailed business model for Asian Paints Ltd**, one of India’s largest and most recognized home décor and paint companies:
---
# **Asian Paints Ltd – Detailed Business Model**
## **1. Company Overview**
* **Name:** Asian Paints Limited
* **Founded:** 1942
* **Headquarters:** Mumbai, Maharashtra, India
* **Sector:** FMCG (Decorative and Industrial Paints, Home Décor)
* **Global Presence:** Operations in 15+ countries, servicing customers in over 60 countries
* **Stock Listing:** NSE and BSE (Ticker: ASIANPAINT)
---
## **2. Value Proposition**
Asian Paints offers **high-quality, innovative, and durable paints and coatings**, along with **home décor and waterproofing solutions**, providing both aesthetic value and protection for surfaces.
* Trusted and consistent brand
* Innovation in product quality and technology
* Wide range of colors and finishes
* Convenient services like color consultancy and home painting
* Strong dealer and service network
---
## **3. Key Business Segments**
### **A. Decorative Paints (Core Segment)**
* **Products:**
* Interior and Exterior Wall Paints
* Enamels, Wood Finishes
* Wall Textures, Wallpapers
* Primers and Putty
* **Brands:**
* *Royale, Apex, Tractor, Ultima, Premium Emulsion, etc.*
### **B. Industrial Coatings (JV with PPG)**
* **Automotive Coatings:**
* OEM (original equipment manufacturers) and refinishing paints
* **Protective Coatings:**
* Paints for infrastructure, oil & gas, and marine sectors
### **C. Home Improvement & Décor**
* **Brands/Products:**
* *Sleek* (Modular Kitchens)
* *Ess Ess* (Bath Fittings)
* *Beautiful Homes* (Interior Design & Execution)
* Lighting, Furniture, Furnishings
### **D. International Operations**
* Presence in the Middle East, Africa, South Asia, and Southeast Asia through subsidiaries like **Berger International** and **SCIB Paints Egypt**
---
## **4. Customer Segments**
### **A. Individual Homeowners**
* Middle-income and upper-income households
* Both new home builders and renovation customers
### **B. Contractors and Painters**
* Primary users of Asian Paints products for residential and commercial projects
### **C. Architects & Interior Designers**
* Influencers for high-end projects and new constructions
### **D. OEMs and Industrial Clients**
* Automotive, marine, and infrastructure sectors for coatings
---
## **5. Channels (Distribution Model)**
### **A. Dealer/Distributor Network**
* Over **70,000+ dealers/retailers** across India
* Strong supply chain with automated replenishment
### **B. Company-Owned Stores**
* *Beautiful Homes Stores* for premium décor and design experience
### **C. Online Platforms**
* **Asian Paints Website & App:** Book painting services, consultations
* Presence on marketplaces (Amazon, Flipkart)
### **D. Institutional Sales**
* Real estate developers, contractors, corporates, government tenders
---
## **6. Key Activities**
* Product R\&D and innovation in paint technology
* Manufacturing and logistics (25+ manufacturing facilities globally)
* Marketing and branding (celebrity endorsements, campaigns)
* Color consultancy, home décor advisory
* Dealer and painter training programs
* End-to-end home décor execution services
---
## **7. Key Resources**
* Manufacturing facilities in India (Ankleshwar, Visakhapatnam, Mysuru, etc.)
* Large dealer and logistics network
* Asian Paints Colour Academy – Painter and dealer training
* R\&D facilities for technology and innovation
* Brand reputation and marketing assets
---
## **8. Revenue Streams**
### **A. Product Sales:**
* Decorative paints (major contributor, \~80–85%)
* Industrial coatings (\~10%)
* Home décor (\~5–10% and growing)
### **B. Services Revenue:**
* Painting services (Asian Paints Safe Painting Service)
* Design and turnkey interior solutions
* Kitchen and bath fittings services
### **C. International Sales:**
* Revenue from foreign subsidiaries and JVs
---
## **9. Cost Structure**
* Raw materials (pigments, resins, solvents)
* Manufacturing and warehousing
* Dealer/distribution incentives
* Marketing and promotions
* R\&D and product development
* Logistics and supply chain operations
* Technology and IT infrastructure
---
## **10. Partnerships**
* **PPG Industries (USA):** Joint venture for industrial and automotive coatings
* **Retail & Designer Ecosystem:** Architects, interior designers, and contractors
* **E-commerce and tech partners** for digital transformation
* **Logistics and warehouse partners**
---
## **11. Sustainability & CSR Initiatives**
* **Water-based and low-VOC paints** for eco-friendly homes
* Solar-powered manufacturing units
* **Asian Paints Colour Academy:** Skill-building for underprivileged youth
* CSR in education, sanitation, and health
* Recycling and eco-friendly packaging innovations
---
## **12. Competitive Advantage**
* **Market leader in decorative paints** with over 50% market share
* Strong **brand recognition and trust**
* Unmatched **distribution network and supply chain**
* Technology-driven services and digital platforms
* Seamless **integration of products and services** (design + execution)
* Early **expansion into home décor**, creating new growth verticals
---
## **13. Challenges**
* Rising **raw material costs** (crude oil-linked inputs)
* Competition from Berger Paints, Kansai Nerolac, AkzoNobel
* Volatility in international markets
* Skilled labor shortages for home painting
* Need for continuous innovation in décor trends
---
## **14. Growth Strategies**
* Expand **Beautiful Homes** and **Sleek Kitchens** across major cities
* Deeper **penetration in rural and Tier 2/3 towns**
* Invest in **technology and AI** for personalized color recommendations
* Increase **direct-to-consumer offerings**
* Strengthen **international operations and exports**
* Launch **premium eco-friendly** product lines
* Continue to grow **service-based revenues**
---
## **15. Business Model Canvas (Summary)**
| **Key Partners** | **Key Activities** | **Value Proposition** | **Customer Relationships** | **Customer Segments** |
| -------------------------------------------- | ---------------------------------------- | ------------------------------------------------------------- | -------------------------------------------------- | ------------------------------------------------------- |
| Dealers, PPG JV, architects, e-com platforms | Manufacturing, R\&D, marketing, services | Trusted paints, innovative décor, full-service home solutions | Dealer support, service centers, digital platforms | Homeowners, contractors, architects, OEMs, institutions |
| **Key Resources** | **Channels** | **Cost Structure** | **Revenue Streams** |
| ----------------------------------------------- | --------------------------------------- | -------------------------------------------------- | ------------------------------------------------------------------------------- |
| Factories, R\&D, dealer network, design studios | Retail dealers, online, direct services | Raw materials, manufacturing, marketing, logistics | Paint sales, home décor services, industrial coatings, international operations |
---
Thanks & Regards
We are Available on All Social Media Platforms
The Golden Farms of Equity

ASIAN PAINTAs per weekly chart setup and downtrend journey of the stock, defending 2200 area which is good sign of reversal for next 6 months, so from 3500, the stock is trading at 2250 levels almost 40% fallen from the high, one can look for recovery in the stock in next 6 months.
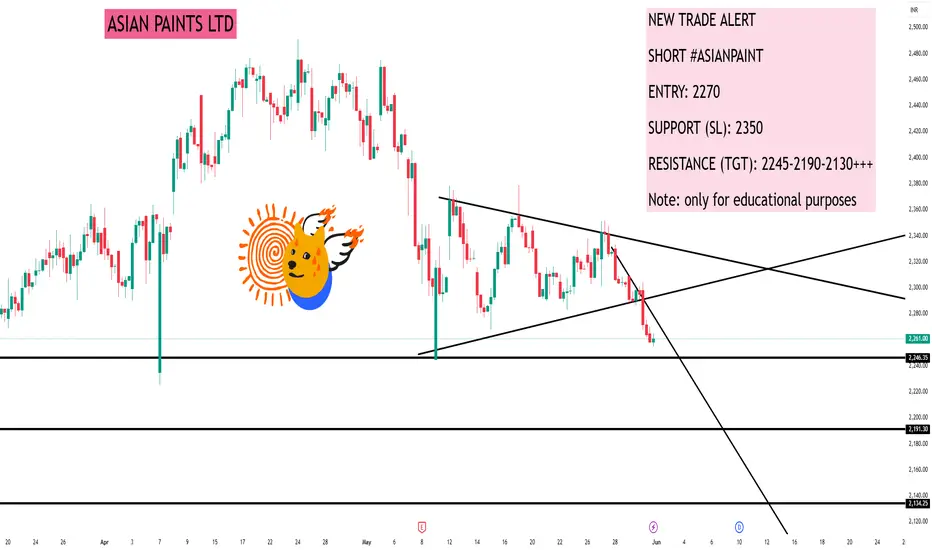
ASIAN PAINTS LTDNEW TRADE ALERT
SHORT #ASIANPAINT
ENTRY: 2270
SUPPORT (SL): 2350
RESISTANCE (TGT): 2245-2190-2130+++
Note: only for educational purposes
Asian Paints Buying Opp At This Level
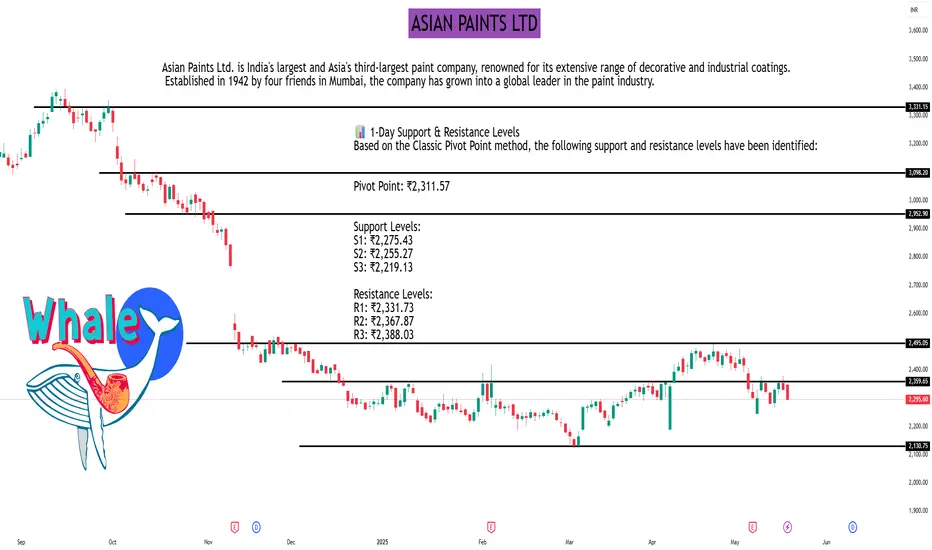
sian Paints Ltd. is India's largest and Asia's third-largest paint company, renowned for its extensive range of decorative and industrial paints, coatings, and home décor solutions. Established in 1942, the company has evolved into a significant player in the global paints and coatings industry.
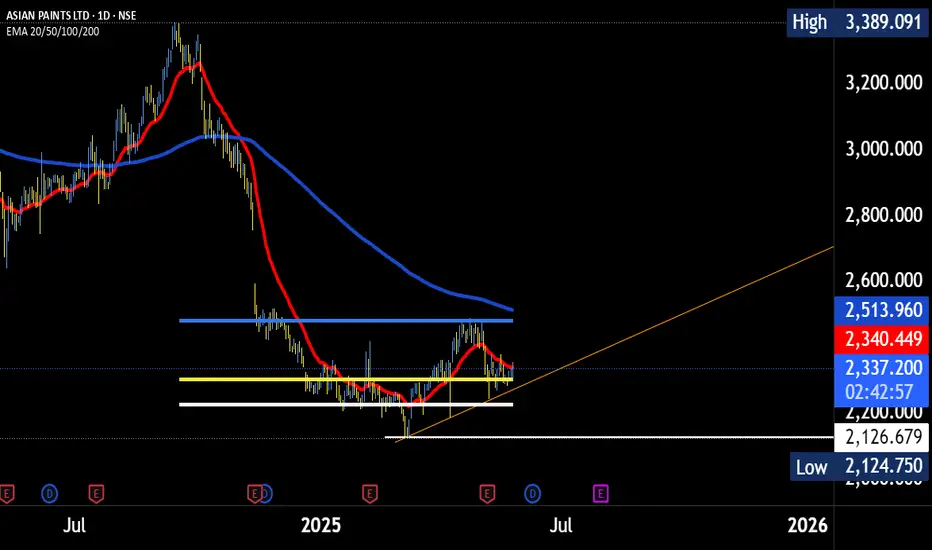
ASIAN PAINTS LTDAs of May 21, 2025, Asian Paints Ltd. (NSE: ASIANPAINT) closed at ₹2,295.60, reflecting a 1.54% decline from the previous day. The stock is currently trading approximately 32% below its 52-week high of ₹3,394.00, reached on September 16, 2024.
📊 1-Day Support & Resistance Levels
Based on the Classic Pivot Point method, the following support and resistance levels have been identified:
Pivot Point: ₹2,311.57
Support Levels:
S1: ₹2,275.43
S2: ₹2,255.27
S3: ₹2,219.13
Resistance Levels:
R1: ₹2,331.73
R2: ₹2,367.87
R3: ₹2,388.03
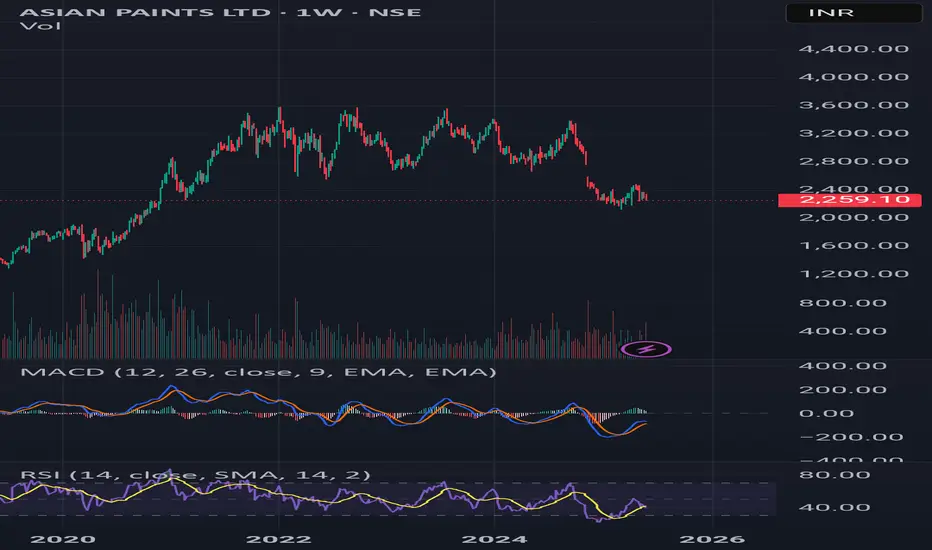
📈 Technical Indicators
Relative Strength Index (RSI): 41.88 – Indicates neutral momentum.
Moving Average Convergence Divergence (MACD): -15.56 – Suggests bearish momentum.
Average Directional Index (ADX): 17.09 – Reflects a weak trend strength.
Rate of Change (ROC): -5.80 – Points to a declining price momentum.
Money Flow Index (MFI): 29.47 – Indicates potential oversold conditions.
Supertrend: ₹2,468.26 – The current price is below this level, signaling a bearish trend.
📉 Moving Averages
50-day Simple Moving Average (SMA): ₹2,342.83
100-day SMA: ₹2,304.44
200-day SMA: ₹2,614.84
The current price is below all these moving averages, indicating a bearish outlook.
🔍 Market Outlook
Asian Paints Ltd. is exhibiting bearish signals across multiple technical indicators. The stock's position below key moving averages and a declining RSI suggest continued downward pressure. Traders should monitor the support levels closely; a breach below S1 (₹2,275.43) could indicate further downside, while a move above R1 (₹2,331.73) might suggest a potential reversal.
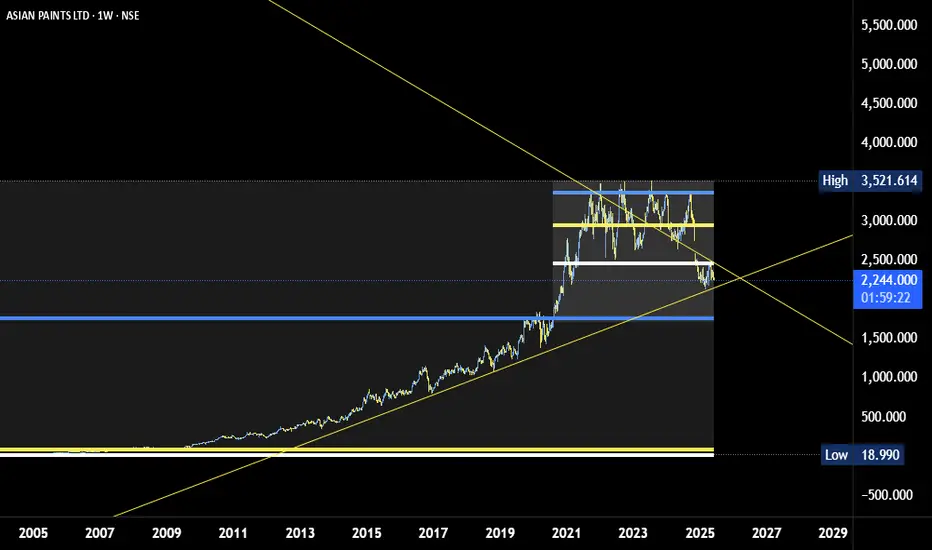
Asian Paints Ltd View For Next 52 WeeksAsian Paints Limited
Industry: Paints and Home Décor
Founded: 1942
Headquarters: Mumbai, India
Overview: Asian Paints is India's largest paint company and ranks among the top ten decorative coatings companies globally. It offers a wide range of products, including decorative and industrial paints, waterproofing solutions, adhesives, and home décor items. The company has a significant international presence, operating in 14 countries with manufacturing facilities in 27 locations worldwide
Asian Paints: A Blue-Chip Opportunity at 3-Year LowsAsian Paints, a stalwart in the Indian Paint market, has dropped to ₹2,300, marking a three-year low. Amidst this decline, the stock exhibits noteworthy indicators:
1. **Relative Strength Index (RSI)**: Currently below 50, signaling potential oversold territory.
2. **Price-to-Earnings Ratio (P/E)**: Historically low at <46, presenting a rare valuation opportunity.
Here’s why I believe this is an attractive long-term investment:
1. **Attractive Dividend Yield**: At the current price, the dividend yield is 1.46%, offering a steady income stream.
2. **Robust Financial Health**: The company boasts negligible debt, ensuring financial stability.
3. **Strong Reserves**: Asian Paints has a reserve of ₹17,928 crore, a solid buffer for future growth.
4. **Cash Flow Strength**: With a cash generation of ₹6,104 crore, the company has ample liquidity for operations and expansion.
5. **Growth-Oriented Investments**: The company is investing ₹2,500 crore in fixed assets, underscoring its focus on long-term growth.
As Warren Buffett says, *"Be fearful when others are greedy, and greedy when others are fearful."* This downturn may present a strategic buying opportunity for patient investors.
---
**Disclaimer**
1. Perform your own analysis or consult a financial advisor before investing.
2. This investment may require a long horizon to yield significant returns.

ASIAN PAINTS GREAT BUYING OPPORTUNITY 20% UPSIDE POTENTIAL!Hello traders, in this analysis I'm going to discuss about Asian paints, ASIAN PAINTS have corrected from almost 3400 lvl to 2200 lvl now after the correction stock is moving in Sideways stock is good above mentioned 2500 resistance zone if stock consolidate in that range for few days and than give break out than it's really a good zone to accumulate these stock. After clearing the mentioned resistance zone there is no any strong resistance in between, stock is ready to head towards 3000 lvl. Stock might face some sideways or small correction near gap down high and after filling gap it may face some rejection. But major resistance zone is not in Between so from my point of view ASIANET PAINT is ready to blast soon if it's sustain above resistance zone. You have to give some ample amount of time for our level to come.
This is my personal view your view might differ from mine, do your own research before taking any trades.

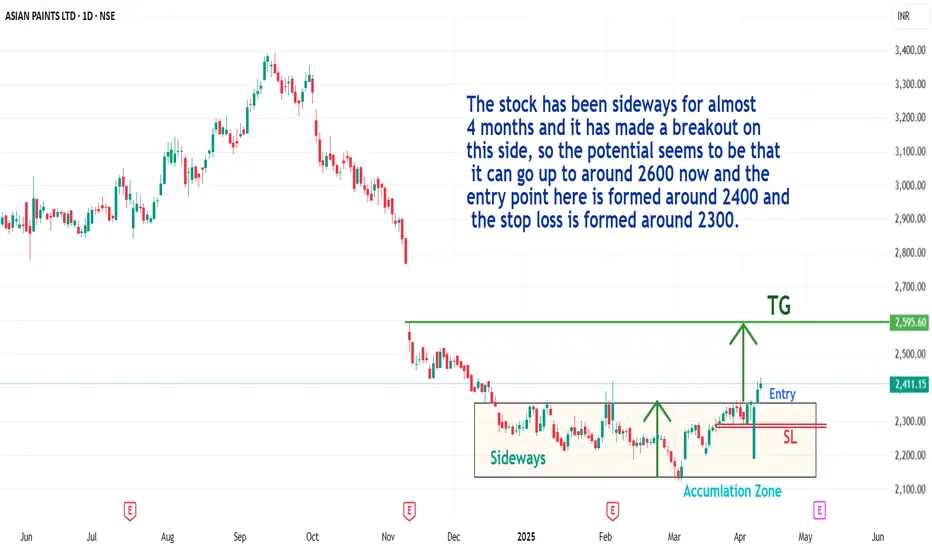
Asian paint stock 4 months sideways zone breakoutThe stock has been sideways for almost 4 months and it has made a breakout on this side, so the potential seems to be that it can go up to around 2600 now and the entry point here is formed around 2400 and the stop loss is formed around 2300.
ASIAN PAINT LONGAsian paints breaking out from resistance zone,expecting good upside TGT in short term.
