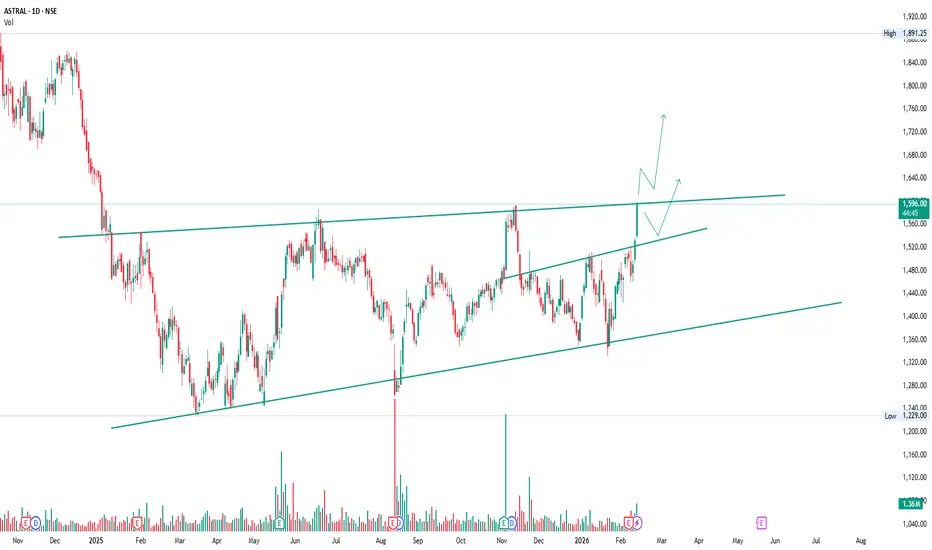
ASTRAL Rising Channel BreakoutASTRAL has been respecting a rising channel pattern, making consistent higher highs and higher lows.
Price recently pulled back to the lower boundary and bounced strongly — confirming buyers are defending structure.
Now it has pushed back toward the upper channel resistance with strong bullish can
Astral Limited
No trades
Next report date
—
Report period
—
EPS estimate
—
Revenue estimate
—
18.70 INR
5.24 B INR
58.32 B INR
123.02 M
About Astral Limited
Sector
Industry
CEO
Sandeep Pravinbhai Engineer
Website
Headquarters
Ahmedabad
Founded
1996
IPO date
Feb 14, 2007
Identifiers
2
ISIN INE006I01046
Astral Ltd. engages in manufacturing and marketing of plumbing and piping systems for both residential and industrial applications. It operates through the following segments: Plumbing, and Paints and Adhesives. The company was founded on March 25, 1996 and is headquartered in Ahmedabad, India.
Related stocks
ASTRAL LIMITED cmp1383 moving towards 739 levels 52W lowAs per chat astral is not in any condition to give upward break out cmp 1383 and once support @1232 broken which highly likely to happen it will steep deep dive towards 739 levels which will be good level to buy for long term investment. Chart pattern invalidate if stock breaks R@1590

ASTRAL - STWP Equity Snapshot📊 STWP Equity Snapshot – Astral Ltd (ASTRAL)
(Educational | Chart-Based Interpretation)
ASTRAL continues to trade within a broader range-bound structure, with price oscillating between well-defined supply and demand zones rather than establishing a sustained trend. After facing rejection near the 1

ASTRALASTRAL – Market structure remains bullish.
The stock has held above the previous low near 1348 and showed a clear reversal from the 1350 zone, maintaining a higher high–higher low structure since forming the bottom around 1260.
Price is currently trading above all key EMAs, indicating improving mo

ASTRAL ltd ready to move higher?No strong breakout yet. Stock is consolidating.
above 1500 looks like a breakout level
sl 20-25%
tp 50-75%
rrr 1:2
Key levels to watch:
Support: ₹1,400–1,420
Major support: ₹1,300
Resistance: ₹1,520–1,550
Astral has the potential to move higher, but the ride may not be smooth, there are mixed si

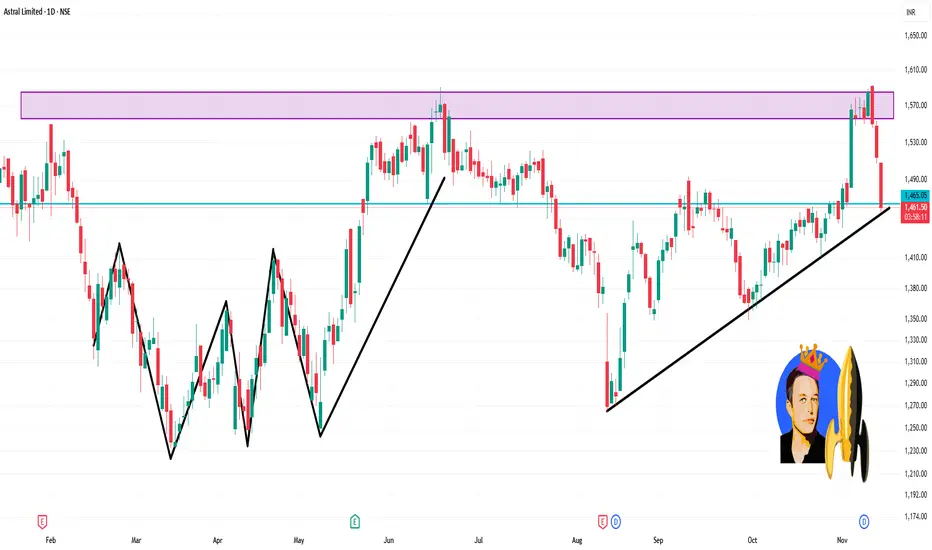
Astral-Breakout Retest Near Reversal Supply Zone Price Action Astral Limited on NSE is retesting the breakdown zone after a strong rally from demand and is now trading close to a higher‑timeframe reversal/supply area on the daily chart. Price is respecting short‑term EMAs with visible N‑pattern swings, giving a potential short setup with defined entry, SL arou

ASTRAL : RE touching the trendline, and a bullish signHi All,
It looks good to my eyes that this will be a good entry to get atleast 10%.
Wrong breakout always give good trade, and it looks like a false breakdown of the trend and with a bullish green candle as of now, lets wait until day end and see how it goes and enter if it shows the same green ca

ASTRAL : Re-touching the trendline confirming the bullish trend?Astral has broken out of a long-term (~125-week) continuation pattern, retesting a major breakout trendline. The weekly chart suggests this retest may serve as a springboard for another leg up.
Technical Trigger: A strong weekly hold or close above the retest zone (trendline / Super Trend) will val

ASTRAL 1 Day Time Frame 📊 Recent Price Snapshot
Latest closing around ₹1,460-₹1,470.
Daily range on latest day: High ~ ₹1,508, Low ~ ₹1,460.
52 week high ~ ₹1,867, 52 week low ~ ₹1,232.
🔍 Key Levels for the 1-Day Timeframe
Support Levels
Around ₹1,440–₹1,450: Recent lows touched ~1,445.
Further support nearer the 200-
Astral: EMA Breakout Powers Fresh RallyTechnical Analysis
Astral Limited showcases an exceptional wealth creation journey spanning two decades. The stock has delivered a super bullish rally from below ₹4 to reaching ₹2,454 - representing an extraordinary 600x+ growth over 20 years.
Over the past 5 years since 2021, the stock has estab

See all ideas
Summarizing what the indicators are suggesting.
Neutral
SellBuy
Strong sellStrong buy
Strong sellSellNeutralBuyStrong buy
Neutral
SellBuy
Strong sellStrong buy
Strong sellSellNeutralBuyStrong buy
Neutral
SellBuy
Strong sellStrong buy
Strong sellSellNeutralBuyStrong buy
An aggregate view of professional's ratings.
Neutral
SellBuy
Strong sellStrong buy
Strong sellSellNeutralBuyStrong buy
Neutral
SellBuy
Strong sellStrong buy
Strong sellSellNeutralBuyStrong buy
Neutral
SellBuy
Strong sellStrong buy
Strong sellSellNeutralBuyStrong buy
Displays a symbol's price movements over previous years to identify recurring trends.
AMEG
Amundi MSCI Emerging Markets SRI Climate Paris Aligned -UCITS ETF DR- DistributionWeight
0.30%
Market value
8.10 M
USD
MSDU
Amundi MSCI Emerging Markets SRI Climate Paris Aligned UCITS ETF DR (D)Weight
0.30%
Market value
8.10 M
USD
AMEI
Amundi MSCI Emerging Markets SRI Climate Paris Aligned UCITS ETF DR C- CapitalisationWeight
0.30%
Market value
8.10 M
USD
Explore more ETFs
Frequently Asked Questions
The current price of ASTRAL is 1,592.10 INR — it has increased by 3.91% in the past 24 hours. Watch Astral Limited stock price performance more closely on the chart.
Depending on the exchange, the stock ticker may vary. For instance, on NSE exchange Astral Limited stocks are traded under the ticker ASTRAL.
ASTRAL stock has risen by 5.89% compared to the previous week, the month change is a 9.36% rise, over the last year Astral Limited has showed a 10.41% increase.
We've gathered analysts' opinions on Astral Limited future price: according to them, ASTRAL price has a max estimate of 1,900.00 INR and a min estimate of 1,363.00 INR. Watch ASTRAL chart and read a more detailed Astral Limited stock forecast: see what analysts think of Astral Limited and suggest that you do with its stocks.
ASTRAL reached its all-time high on Jul 2, 2024 with the price of 2,454.00 INR, and its all-time low was 1.35 INR and was reached on Mar 13, 2009. View more price dynamics on ASTRAL chart.
See other stocks reaching their highest and lowest prices.
See other stocks reaching their highest and lowest prices.
ASTRAL stock is 4.33% volatile and has beta coefficient of 1.01. Track Astral Limited stock price on the chart and check out the list of the most volatile stocks — is Astral Limited there?
Today Astral Limited has the market capitalization of 411.48 B, it has increased by 2.77% over the last week.
Yes, you can track Astral Limited financials in yearly and quarterly reports right on TradingView.
Astral Limited is going to release the next earnings report on May 20, 2026. Keep track of upcoming events with our Earnings Calendar.
ASTRAL earnings for the last quarter are 4.00 INR per share, whereas the estimation was 4.76 INR resulting in a −16.00% surprise. The estimated earnings for the next quarter are 5.87 INR per share. See more details about Astral Limited earnings.
Astral Limited revenue for the last quarter amounts to 15.41 B INR, despite the estimated figure of 15.63 B INR. In the next quarter, revenue is expected to reach 20.35 B INR.
ASTRAL net income for the last quarter is 1.08 B INR, while the quarter before that showed 1.35 B INR of net income which accounts for −20.10% change. Track more Astral Limited financial stats to get the full picture.
Astral Limited dividend yield was 0.29% in 2024, and payout ratio reached 19.23%. The year before the numbers were 0.19% and 18.45% correspondingly. See high-dividend stocks and find more opportunities for your portfolio.
As of Feb 11, 2026, the company has 9.78 K employees. See our rating of the largest employees — is Astral Limited on this list?
EBITDA measures a company's operating performance, its growth signifies an improvement in the efficiency of a company. Astral Limited EBITDA is 9.81 B INR, and current EBITDA margin is 16.44%. See more stats in Astral Limited financial statements.
Like other stocks, ASTRAL shares are traded on stock exchanges, e.g. Nasdaq, Nyse, Euronext, and the easiest way to buy them is through an online stock broker. To do this, you need to open an account and follow a broker's procedures, then start trading. You can trade Astral Limited stock right from TradingView charts — choose your broker and connect to your account.
Investing in stocks requires a comprehensive research: you should carefully study all the available data, e.g. company's financials, related news, and its technical analysis. So Astral Limited technincal analysis shows the strong buy rating today, and its 1 week rating is buy. Since market conditions are prone to changes, it's worth looking a bit further into the future — according to the 1 month rating Astral Limited stock shows the buy signal. See more of Astral Limited technicals for a more comprehensive analysis.
If you're still not sure, try looking for inspiration in our curated watchlists.
If you're still not sure, try looking for inspiration in our curated watchlists.